GL 15 Weather Services

Rev 02/2025
Disclaimer
Students should use their textbooks, syllabus, and Airman Certification Standards (ACS) as their primary sources of information. EcFlight is an online training tool designed to simplify and enhance your ground school learning experience. However, it is not a substitute for FAA- or school-approved study materials. Before using these slides for study, always refer to your officially approved resources, such as the Jeppesen physical or electronic book and other FAA-approved materials.
Reference Books
- “10 Things Pilots Should Know About Datalink Weather | High Performance Aviation, LLC.” High Performance Aviation, www.flyhpa.com/2017/06/10-things-pilots-should-know-about-datalink-weather/.
- Advisory Circular 00-45H. 1 Aug. 2018, www.faa.gov/documentLibrary/media/Advisory_Circular/AC_00-45H_Chg_2.pdf.
- Instrument Pilot Syllabus (10001785-003). (2015). Englewood, CO: Jeppesen.
- Noaa, & National Weather Service. (2013, March 15). AWC - Aviation Weather Center. Retrieved from https://www.aviationweather.gov/gfa/help
Reference Multimedia
- https://i0.wp.com/www.weatherworks.com/lifelong-learning-blog/wp-content/uploads/2016/10/Fig001-Matthew-120hr-track-161002-8amEDT.jpg
- https://media.npr.org/assets/img/2018/03/01/ap_17253127134669nws_wide-74a9b1d4e77ed95dfeb0988e9e65095d5af556f2-s1600-c85.webp
- https://www.aopa.org/-/media/Images/AOPA-Main/News-and-Media/Publications/Flight-Training-Magazine/2006/2006f_ap_careerpilot.jpeg?h=540&w=961&la=en&hash=8B54D43B69538F165D620BAF560F05E4
Index

Aviation Weather Reports and Forecasts
- Aviation weather reports and forecasts are printed in coded formats and in plain text. These reports can be retrieved from approved weather sources such as 1800wxbrief.com, aviationweather.gov, and EFB sources such as ForeFlight.
- Obtaining and understanding weather charts is important before conducting your IFR cross-country flight because the outcome will result in either a go or no-go decision, or the need to file an alternate airport.
Observations
- Weather reports have been observed of existing conditions at a particular time and place.
- These weather observations are gathered by meteorologists, automated systems, radar and reported by pilots.
Aviation Routine Weather Report (METAR)
- Aviation weather reports and forecasts are printed in coded formats and in plain text. These reports can be retrieved from approved weather sources such as 1800wxbrief.com, aviationweather.gov, and EFB sources such as ForeFlight.
- Obtaining and understanding weather charts is important before conducting your cross-country flight because the outcome will result in either a go or no-go decision, or filing an alternate airport may be required.
Aviation routine weather report is the primary weather report, issued hourly, and expires when the next is issued. METARs are reported in a standard format.
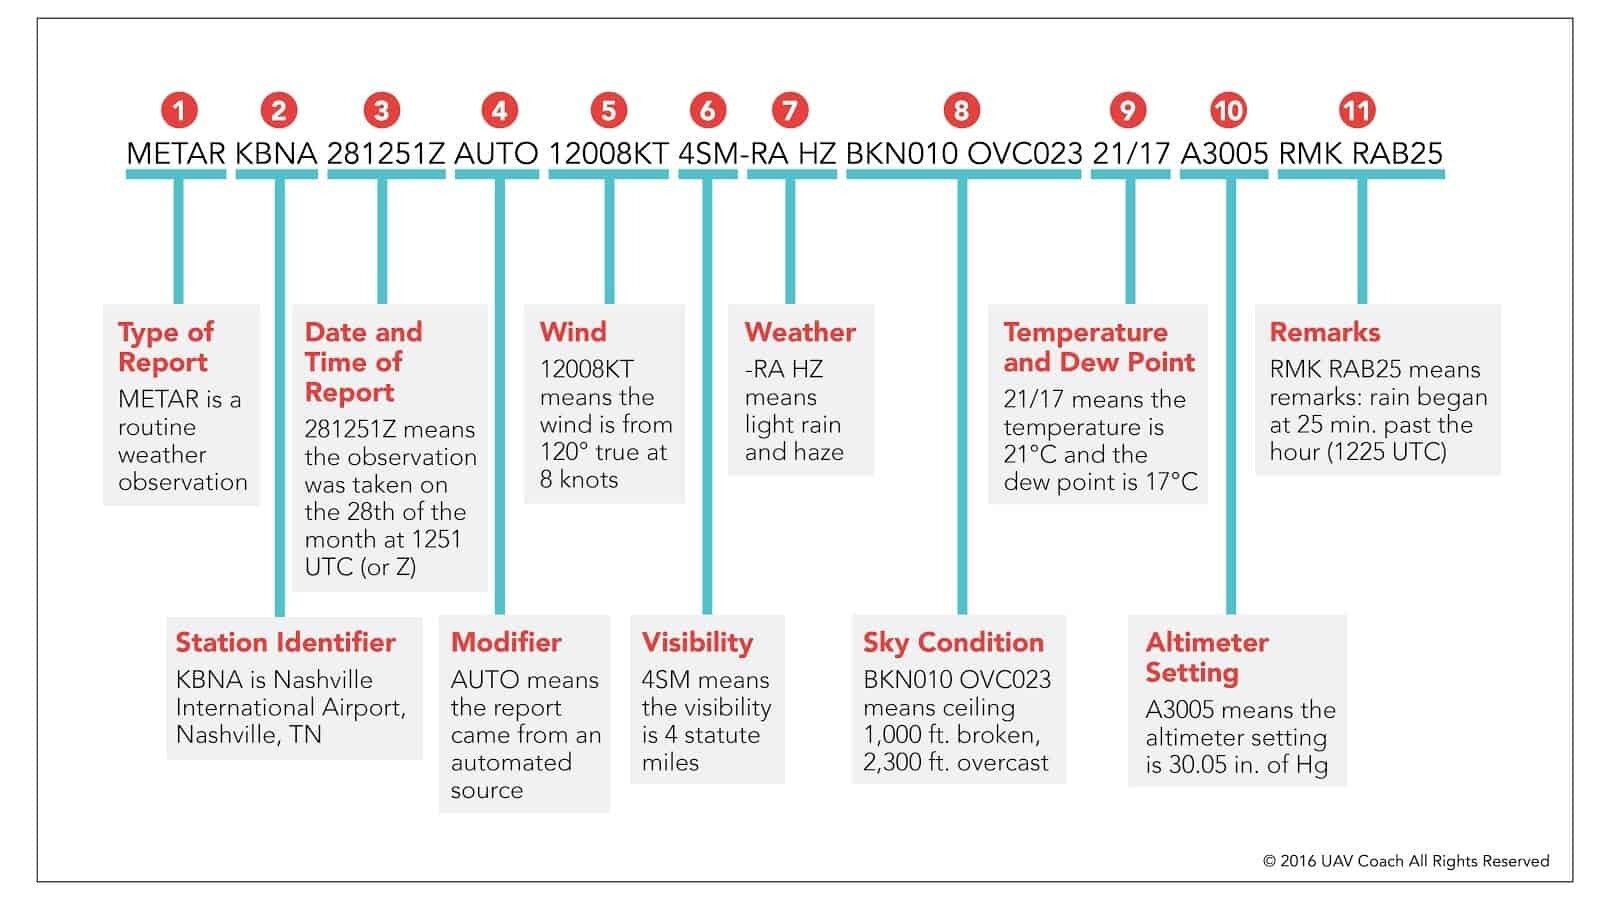
- The type of report, METAR or SPECI, precedes the body of all reports. The SPECI weather observation is an unscheduled report indicating a significant change in one or more elements. It can be issued at any time between routine METAR reports.
Type of report

METAR SPECI KOKC 011955Z AUTO 22015G25KT 180V250 3/4SM R17L/2600FT +TSRA BR OVC010CB 18/16 A2992 RMK AO2 TSB25 TS OHD MOV E SLP132
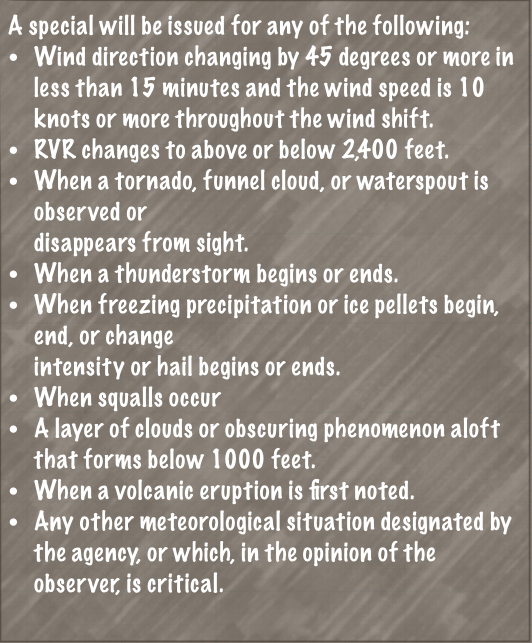
SPECI will be issued when:
-
Each reporting station is listed by its Four-letter International Civil Aviation Organization (ICAO).
In the USA the letter K precedes.
Station Identifier
METAR SPECI KOKC 011955Z AUTO 22015G25KT 180V250 3/4SM R17L/2600FT +TSRA BR OVC010CB 18/16 A2992 RMK AO2 TSB25 TS OHD MOV E SLP132

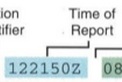
Time of report
METAR SPECI KOKC 011955Z AUTO 22015G25KT 180V250 3/4SM R17L/2600FT +TSRA BR OVC010CB 18/16 A2992 RMK AO2 TSB25 TS OHD MOV E SLP132
- The date of the month and the time of the observation. The time is given in UTC or Zulu time.
- Example bellow the day (01) and time (19:55 Zulu)
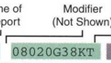
Modifier
METAR SPECI KOKC 011955Z AUTO 22015G25KT 180V250 3/4SM R17L/2600FT +TSRA BR OVC010CB 18/16 A2992 RMK AO2 TSB25 TS OHD MOV E SLP132
-
When the METAR is created by a totally automated weather observation station, the modifier AUTO is going to be present.
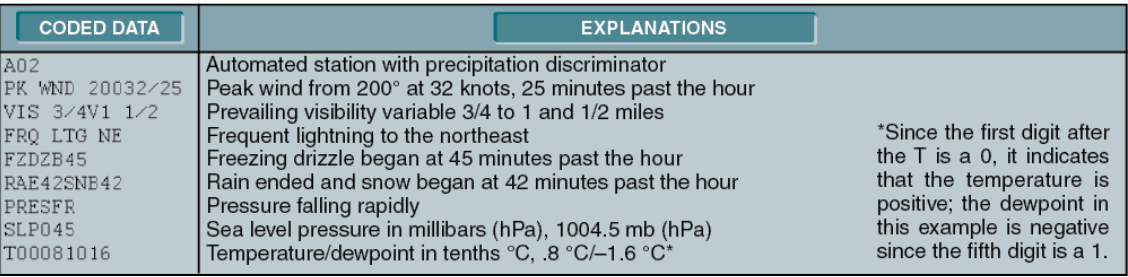
- These stations are classified by the type of sensor equipment used to make the observations, and AO1 or AO2 will be noted in the remarks section of the report. An A01 indicates an automated weather reporting station without a precipitation discriminator, while an A02 indicates automated observing equipment with a precipitation discriminator and was used to take the observation.

Wind Information
METAR SPECI KOKC 011955Z AUTO 22015G25KT 180V250 3/4SM R17L/2600FT +TSRA BR OVC010CB 18/16 A2992 RMK AO2 TSB25 TS OHD MOV E SLP132
- The wind direction and speed are reported in a five-digit group, or six digits if the speed is over 99 knots.
- The first three digits represent the direction from which the wind is blowing, in reference to true north. The next two (or three) digits show the speed in knots (KT). Calm winds are reported as 00000KT. Gusty winds are reported with a G, followed by the highest gust.
220° 15 Knots Gust 25 Knots
- Prevailing visibility is the reported visibility considered representative of recorded visibility conditions at the manual station during the time of observation. It is the greatest distance that can be seen throughout at least half of the horizon circle, not necessarily continuous.
- Surface visibility is the prevailing visibility from the surface at manual stations or the visibility derived from sensors at automated stations.
Visibility Group
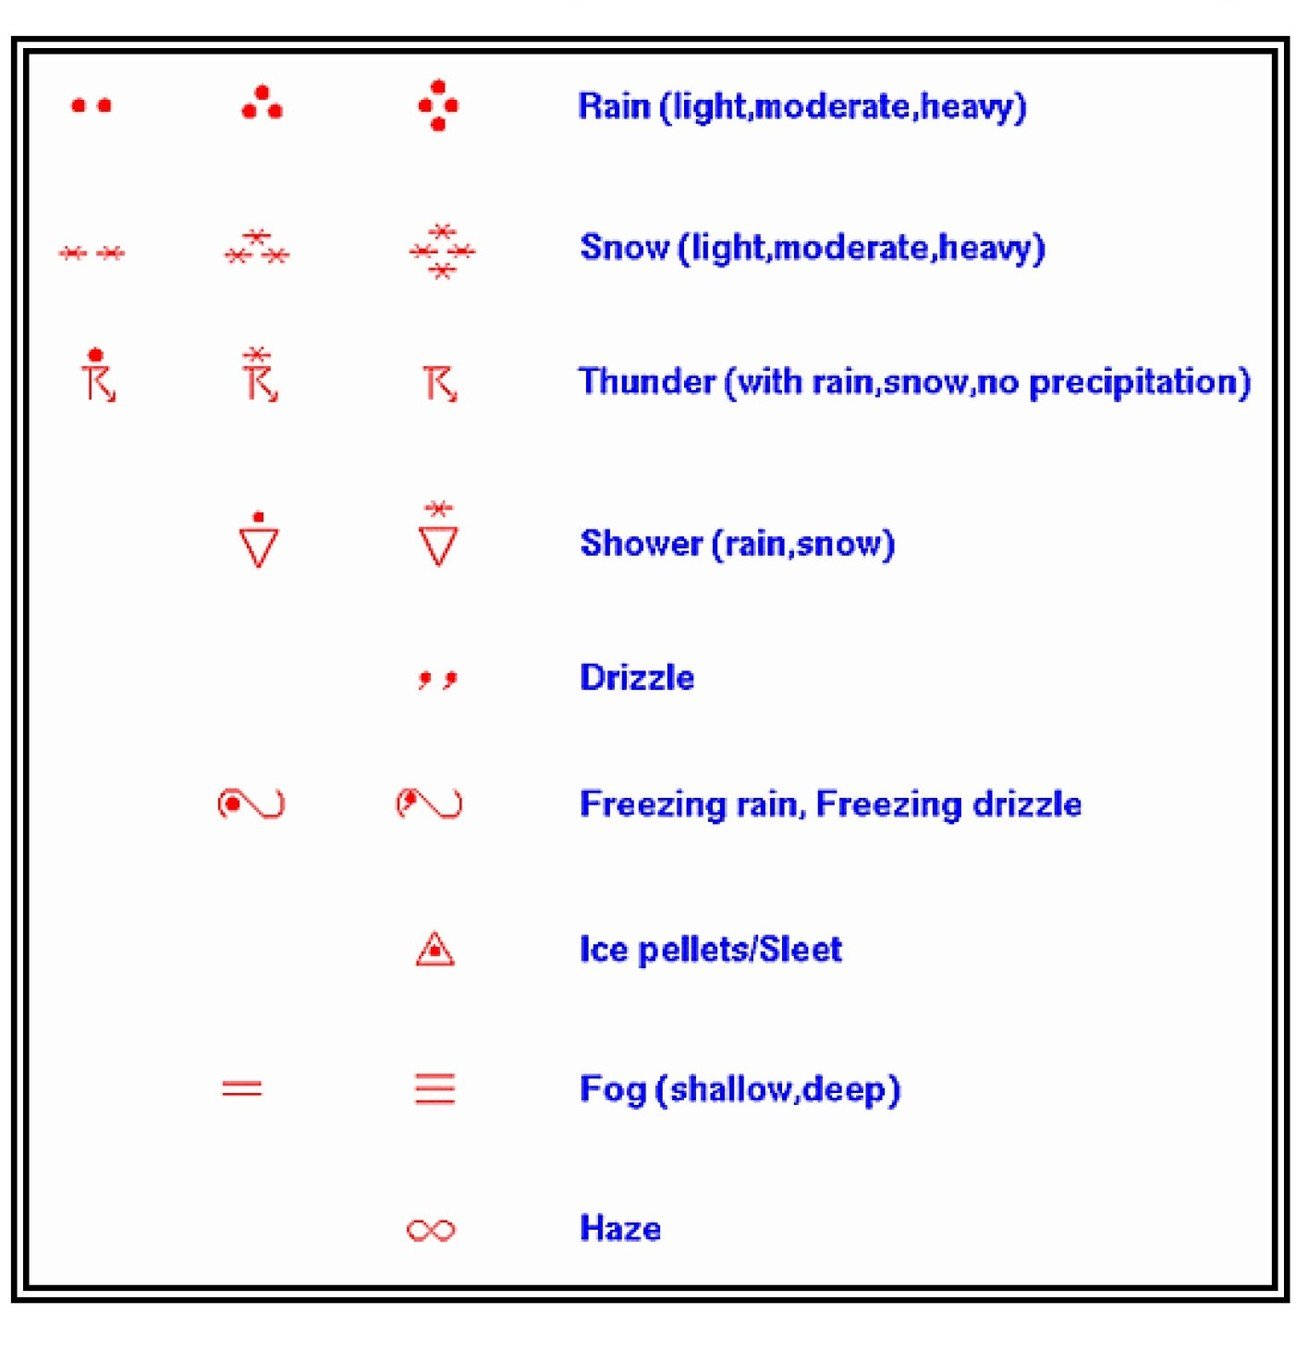
- Weather or obstructions to visibility which are present at the time of the observation are reported immediately after the visibility in the following order: intensity or proximity, descriptor, precipitation, obstruction to visibility, and any other weather phenomena.
Weather
METAR KOKC 011955Z AUTO 22015G25KT 180V250 3/4SM R17L/2600FT +TSRA BR OVC010CB 18/16 A2992 RMK AO2 TSB25 TS OHD MOV E SLP132
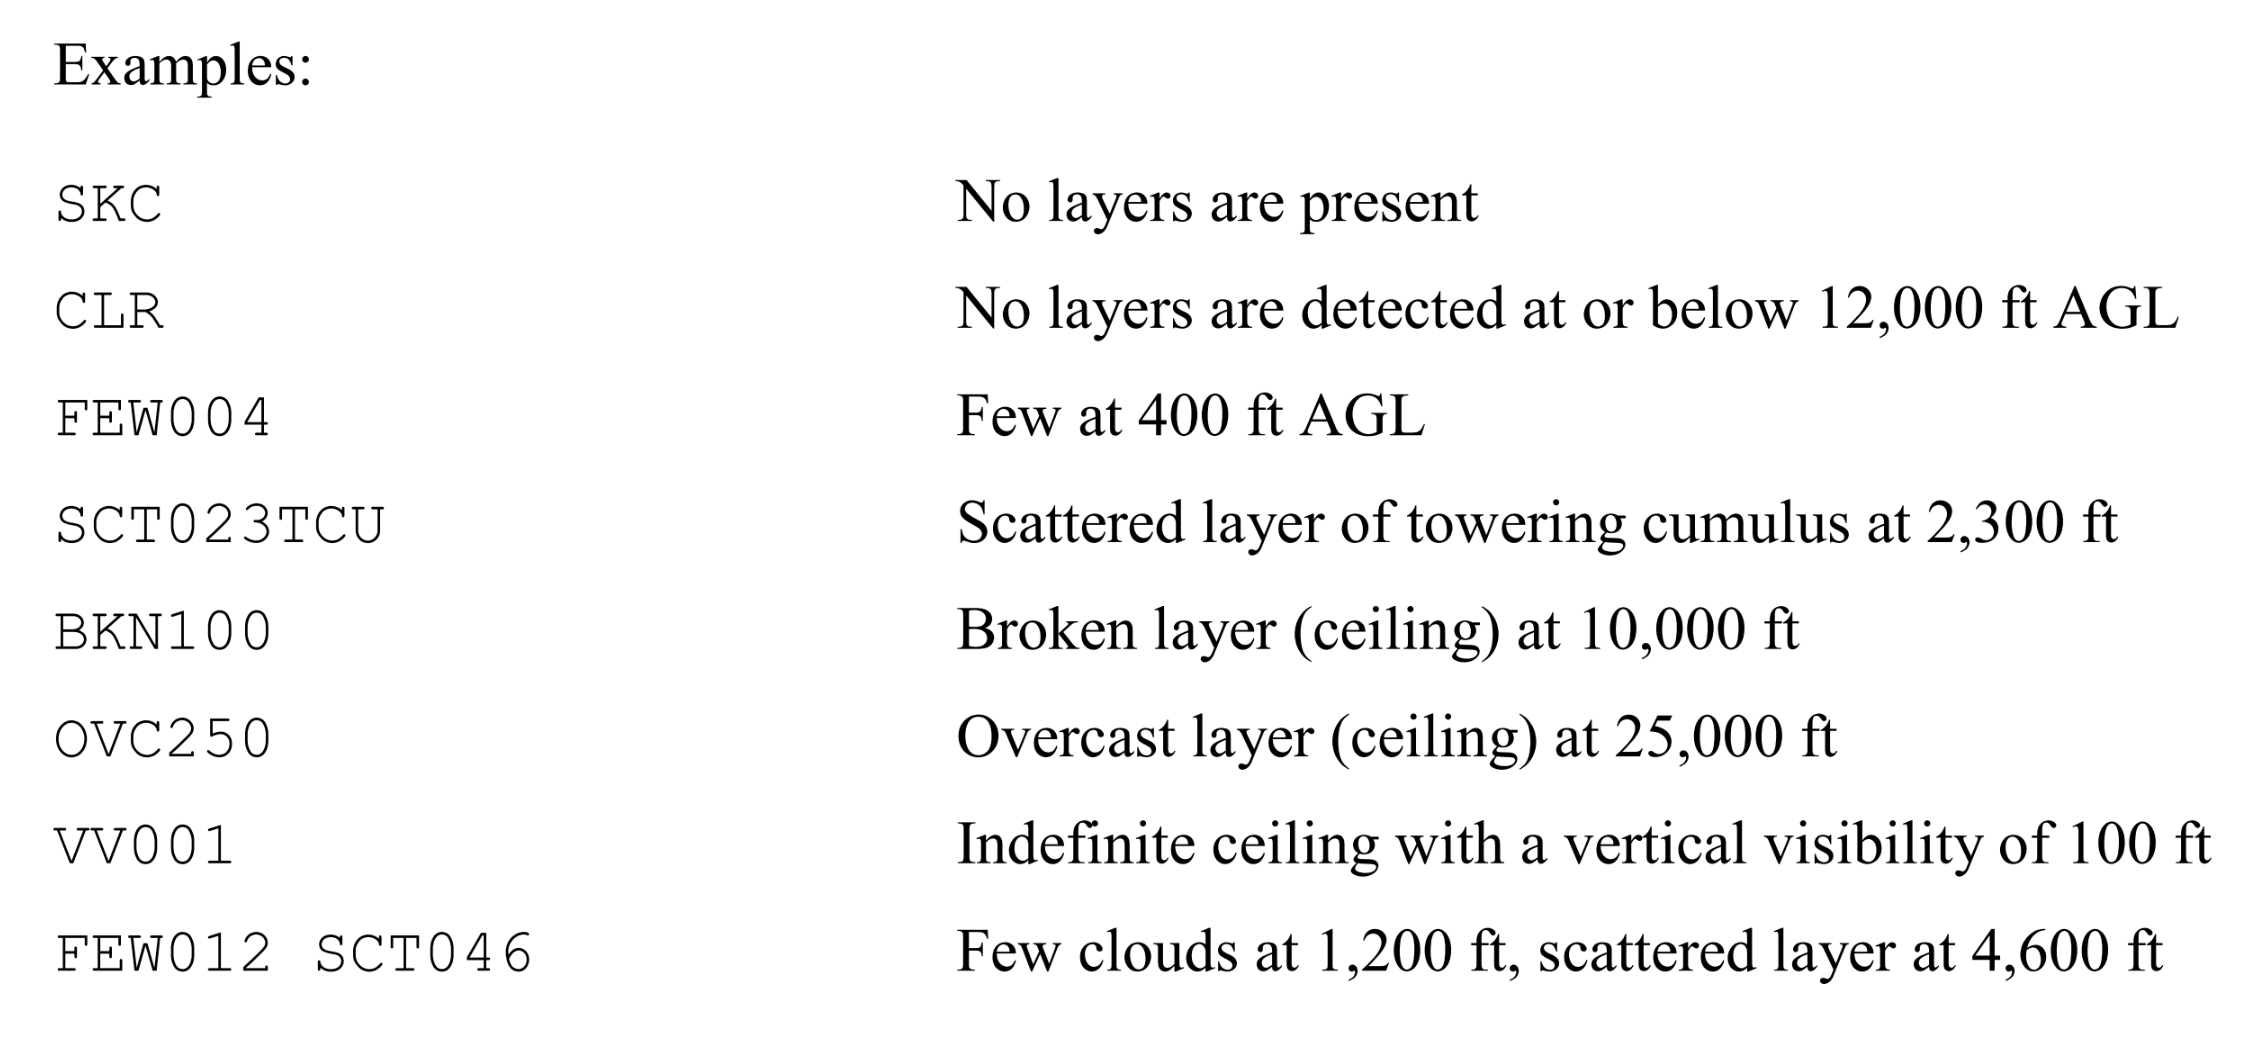
Sky Condition Group
- METAR KOKC 011955Z AUTO 22015G25KT 180V250 3/4SM R17L/2600FT +TSRA BR OVC010CB 18/16 A2992 RMK AO2 TSB25 TS OHD MOV E SLP132
- Overcast 1,000 Feet with cumulonimbus clouds
- Sky condition is a description of the appearance of the sky. It includes either cloud cover, vertical visibility, or clear skies.
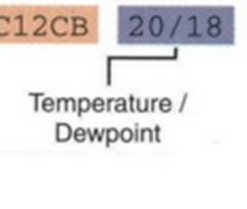
- In the example, the temperature and dewpoint were reported as 20°C and 18°C, respectively. Temperatures below 0° Celsius are prefixed with an M to indicate minus. For instance, 10°C below zero would be shown as M10.
Temperature and Dew Point
- The altimeter setting is reported in inches of mercury in a four-digit group prefaced by an A.
Altimeter

The beginning of the remarks section is indicated by the code RMK. The remarks section reports weather considered significant to aircraft operations.
Remarks
weather observing equipment needs maintenance
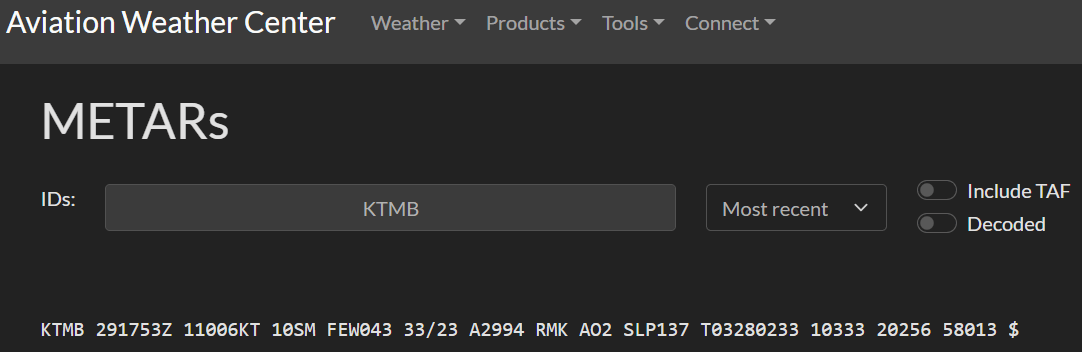
How to obtain the report
Pilot Weather Reports (PIREPs)
A pilot report or PIREP is a report of actual weather conditions encountered by an aircraft in flight.
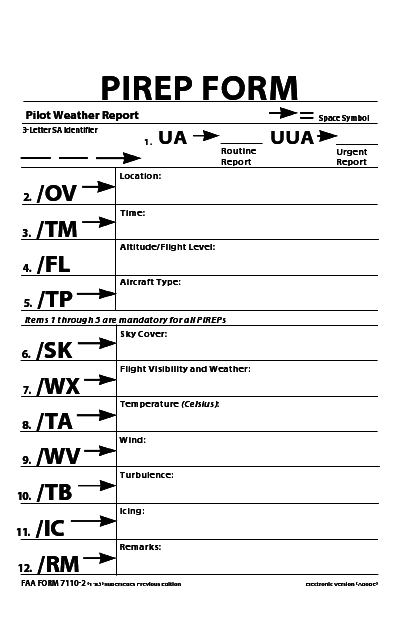
- Two types of PIREPs: Routine (UA) or Urgent (UUA)
- Pilots are required to report the first five elements for all PIREPs
- Routine (UA):
- Weather conditions are present except for the one mentioned in an UUA report.
- Urgent (UUA):
-
Weather phenomena such as:
- Tornadoes, funnel clouds, or waterspouts.
- Severe or extreme turbulence (including clear air turbulence).
- Severe icing.
- Hail.
- Low level wind shear.
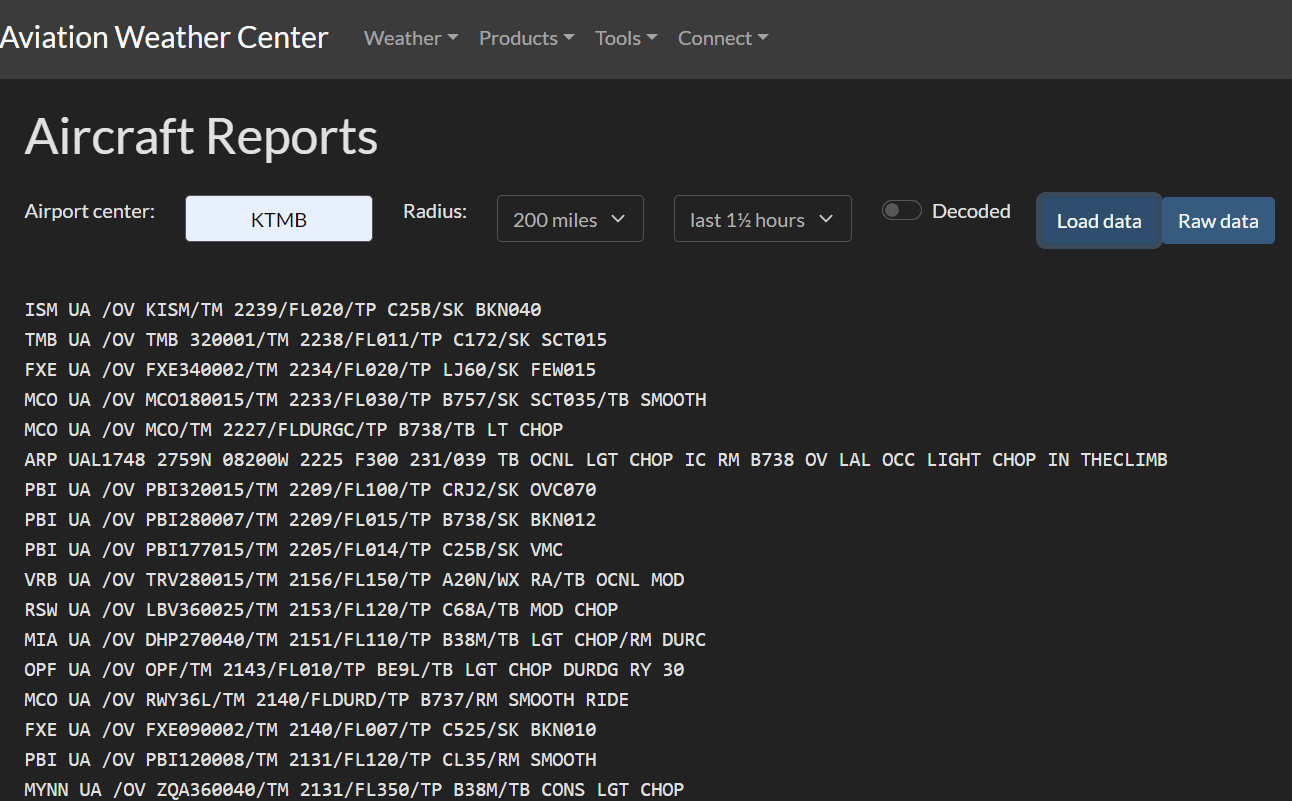
PIREP Decoding
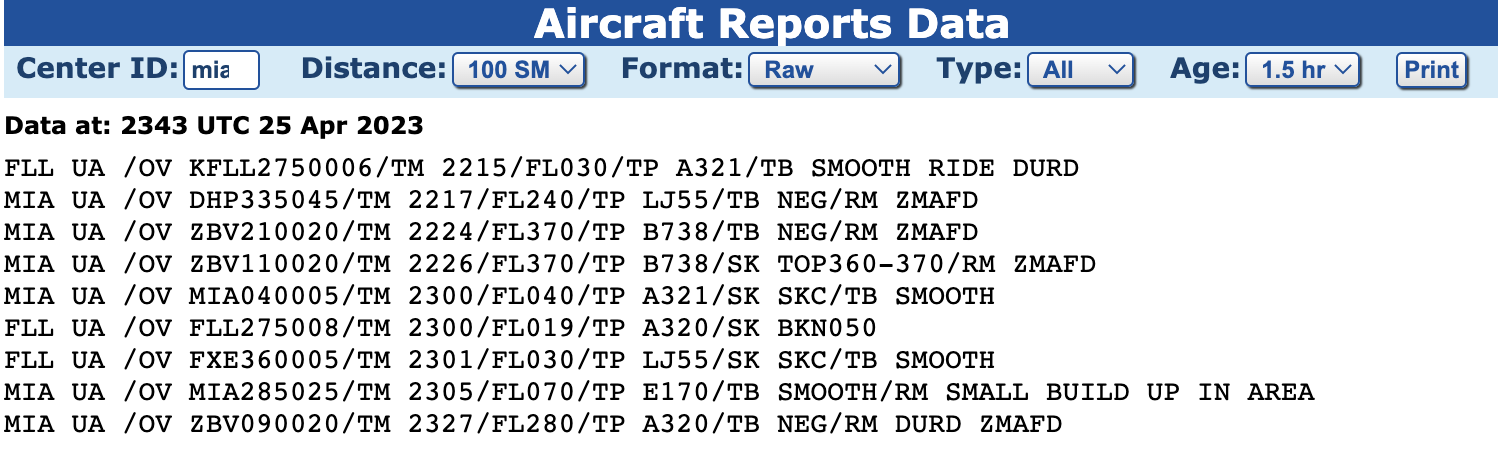
A routine report by a pilot; 20NM on the 090 radial from Bimini VORTAC at 2327 ZULU at 28,000 ft. The type of aircraft is an Airbus 320. Negative turbulence during decent (DURC) or on the approach. Reported with MIA ARTCC (ZMAFD)
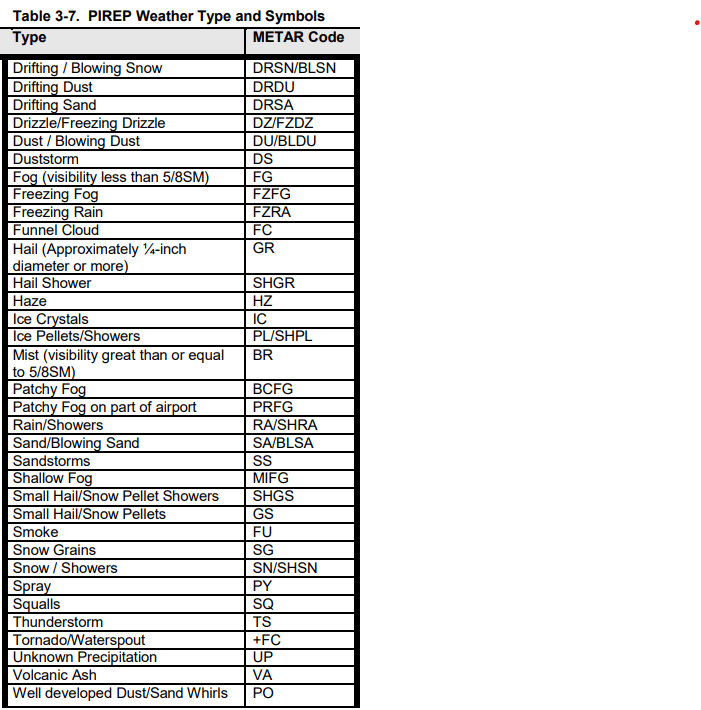
Precipitation intensity indicators (- for light, none for moderate, and + for heavy) represent types of precipitation, excluding ice crystals and hail, covering those linked to thunderstorms and showery patterns.
How to obtain the report
Forecasts
- A forecast is a prediction of weather conditions expected in the future that pilots are using for flight planning.
- Forecast reports often used are TAFs and Wind and Temperature Aloft.
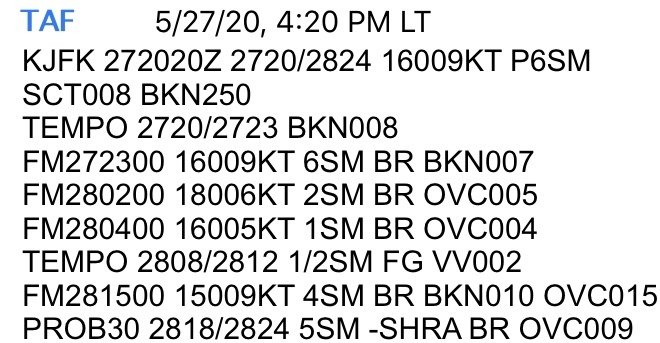
Terminal Aerodrome Forecast (TAF)
- A TAF is a report established for the five statute mile radius around an airport. TAF reports are usually given for larger airports. Each TAF is valid for a 24 or 30-hour time period and is updated four times a day at 0000Z, 0600Z, 1200Z, and 1800Z. The TAF utilizes the same descriptors and abbreviations as the METAR report. The TAF includes the following information in sequential order:
- Type of report
- ICAO Station
- Date and time of origin
- Valid period dates and times
- Forecast weather
Means that visibility is greater than 6SM
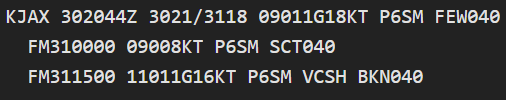
- FM – is used when a rapid change is expected, usually occurring in less than one hour.
- BECMG – is used when a gradual change in conditions is expected over a longer time period, usually two hours. The time period when the change is expected is displayed by four-digit groups separated by a “/”.
- TEMPO – is used for any conditions in wind, visibility, weather, or sky condition which are expected to last for generally less than an hour at a time (occasional).
- PROB30 – is used when the occurrence of thunderstorms or precipitation is 30-39% and PROB40 when the probability is between 40-49%.
How to obtain the report
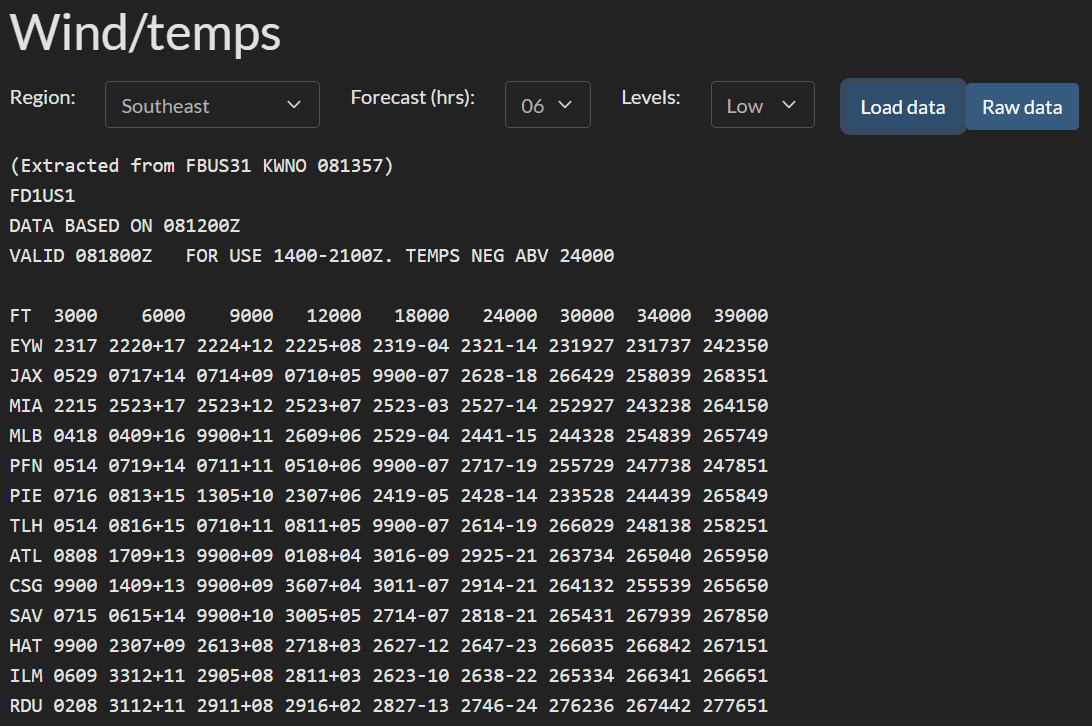
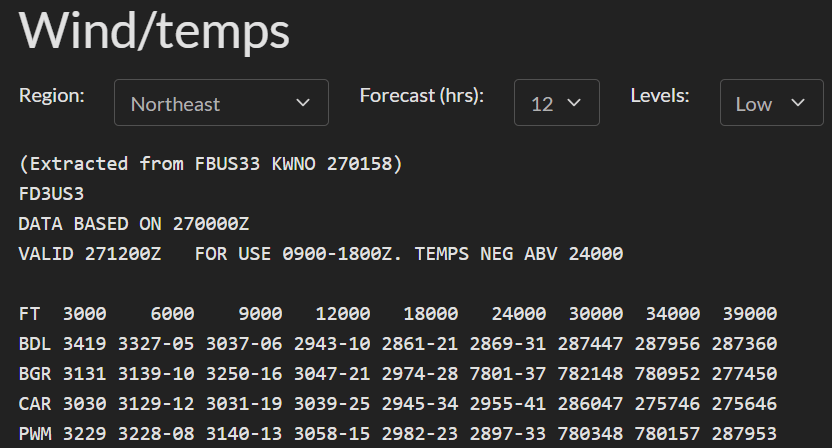
Wind and Temperatures Aloft Forecast
Computer-prepared forecast of wind direction, wind speed, and temperature at specific times, altitudes, and locations, depending on the station elevation.
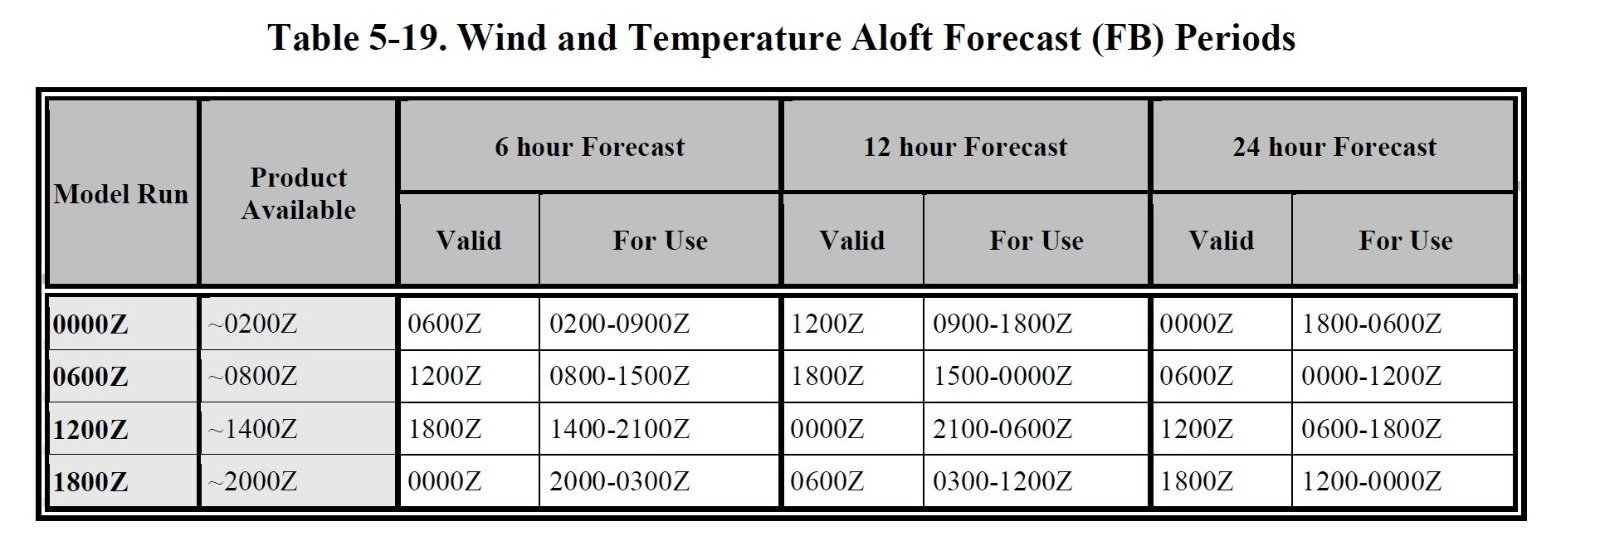
Issued 4 times daily, valid for the time stated on the chart. If the scheduled forecast is delayed, the existing valid forecast based on the earlier 6-hourly data can be used until a new forecast is transmitted Wind and temperature aloft forecast (FB) is available on https://www.aviationweather.gov/ in both text and graphic formation.
-
When you see 9900, it means winds light and variable.
-
To find the direction and speed when the wind is more than 100 knots, subtract 50 from the wind direction section and add 100 to the speed section. The temperature above FL240 will always be negative.
-
Example 780952:
Wind direction: 78-50 = 28 Winds from 280°
Speed: 09 + 100 = 109 knots.
Temperature: -52 C°
It's issued 4 times per day.
Wind forecasts are not issued for altitudes within 1,500 ft of the location's elevation, and temperature forecasts are not issued for altitudes within 2,500 ft.
How to obtain the report
AIRMETs and SIGMETs
- AIRMETs, SIGMETs, and convective SIGMETs are textual forecasts that depict hazardous weather conditions.
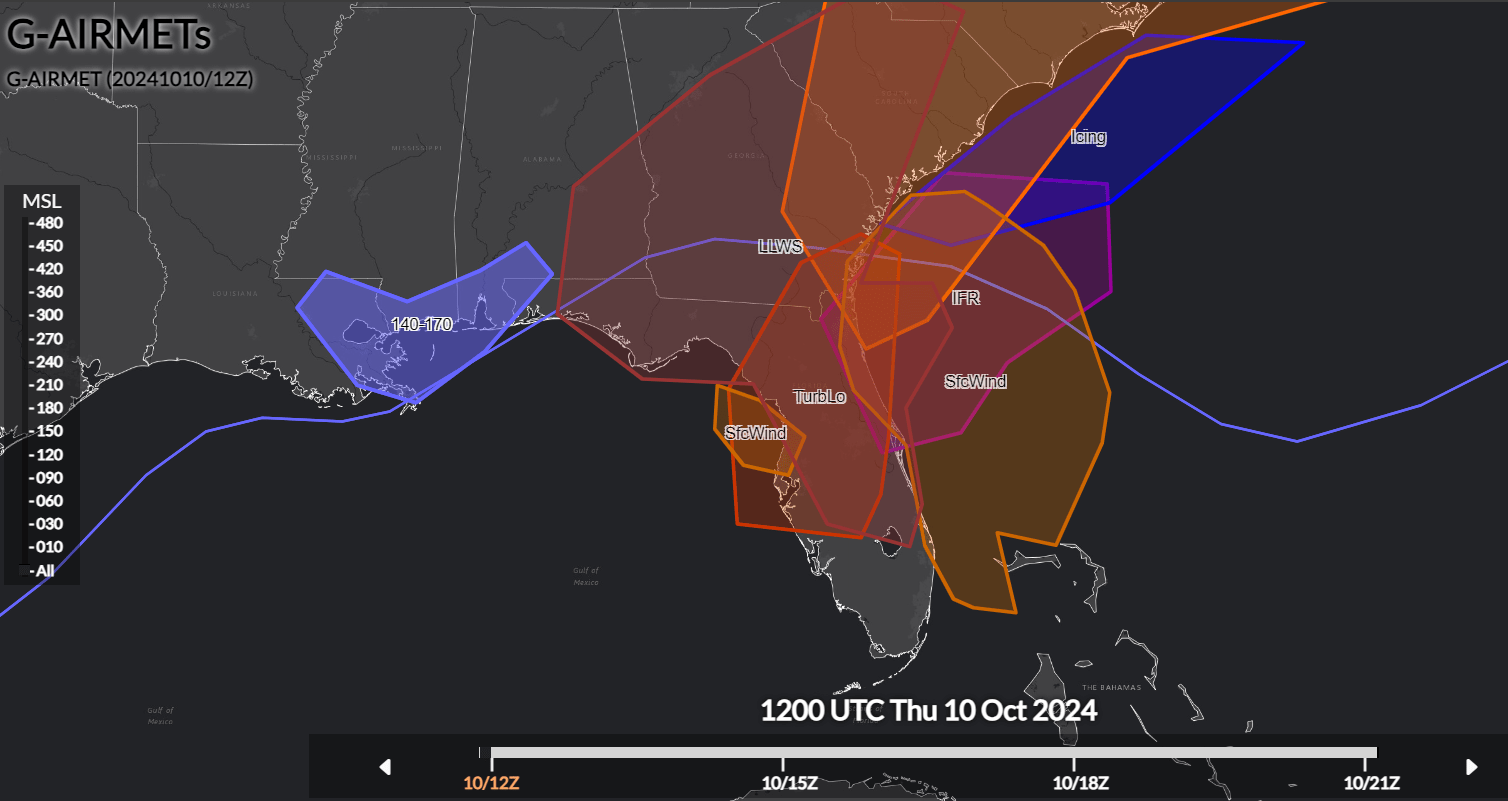
- Both AIRMETs and SIGMETs are presented graphically on the map.
AIRMET
- Airman’s Meteorological Information.
- AIRMETs format: Graphical (G-AIRMET) and Textual
- AIRMETs Textual (WAs) are issued every 6 hours.
- These weather conditions are potentially hazardous to light aircraft and VFR pilots.
- We have three types of AIRMET
- Sierra
- Tango
- Zulu
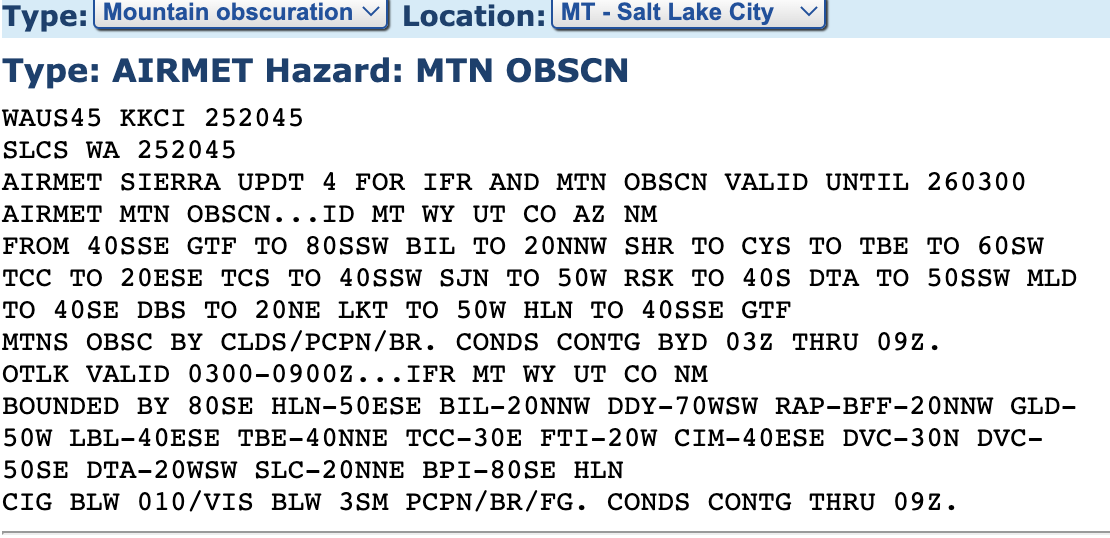
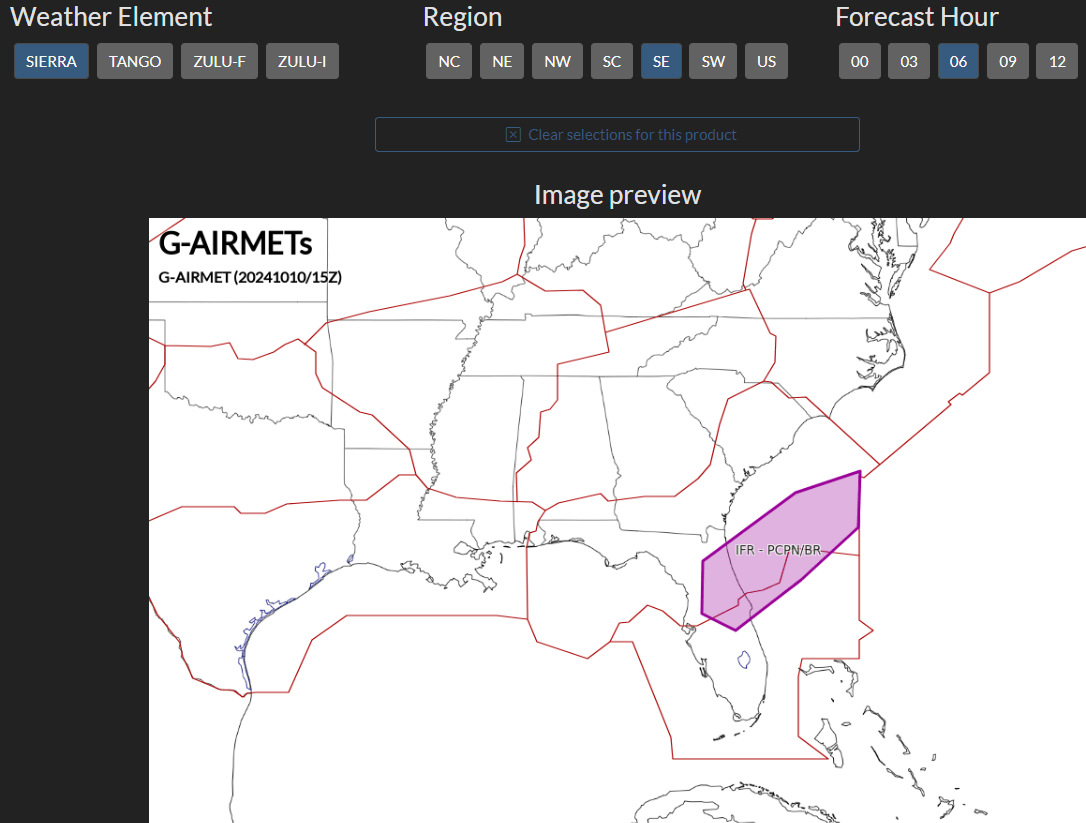
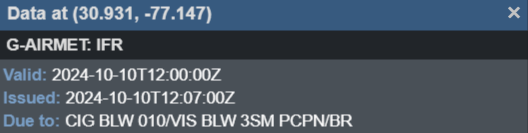
AIRMET Sierra (IFR)
- Ceilings less than 1000 feet and/or visibility less than 3 miles affecting over 50% of the area at one time
- Mountain obscuration caused by low visibility
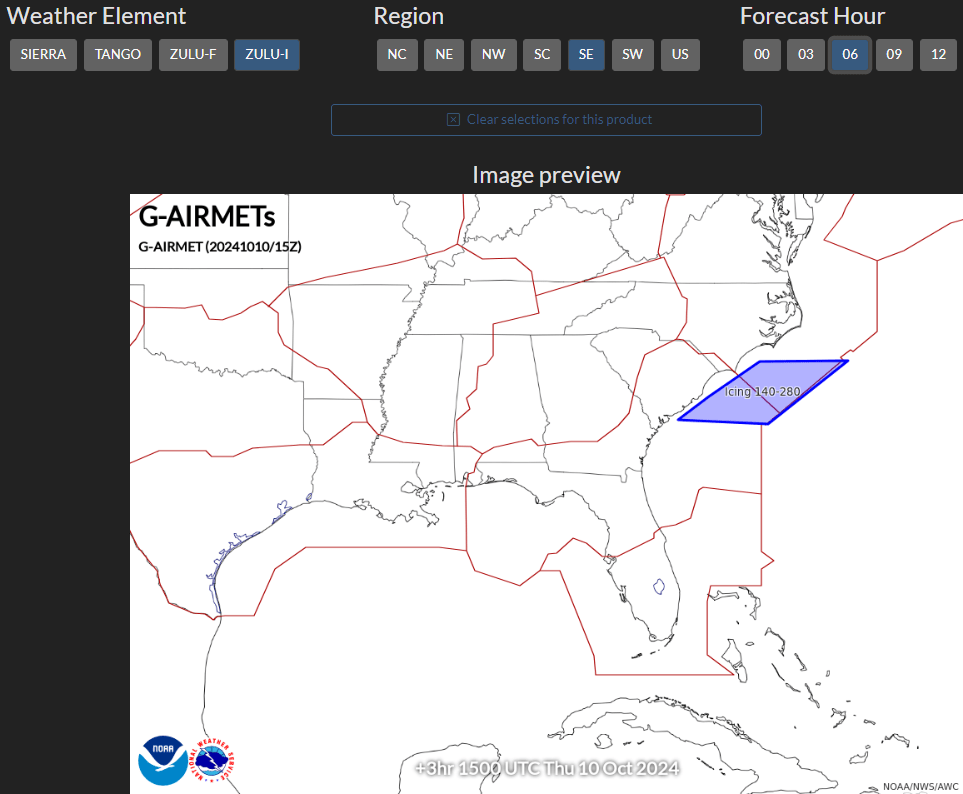
G-AIRMET
Textual
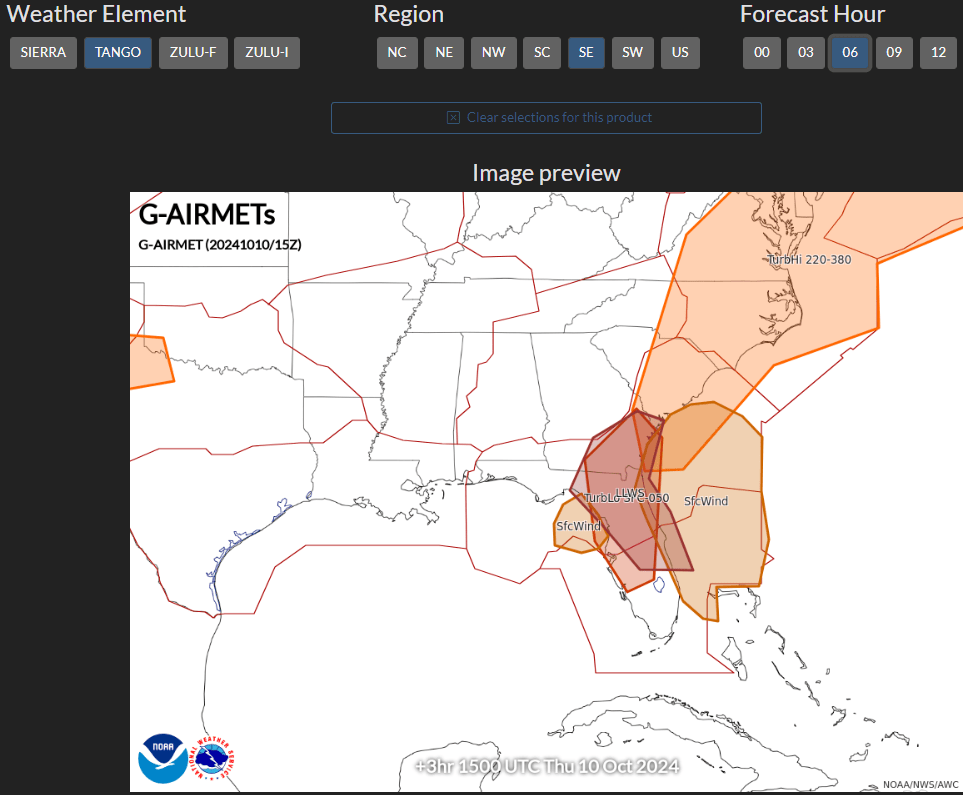
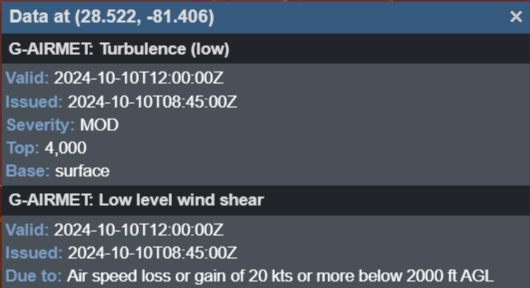
AIRMET Tango (Turbulence)
- Moderate turbulence, non-convective low-level wind shear
- Sustained surface winds of 30 knots or more at the surface
G-AIRMET
Textual
AIRMET Zulu (Icing)
- Moderate icing
- Freezing levels
G-AIRMET
Textual
SIGMET
- Significant meteorological information (SIGMET) are issued for hazardous weather, other than convective activity, which is considered significant to all aircraft.
- SIGMETs include severe icing, severe or extreme turbulence, clear air turbulence (CAT), dust storms and sandstorms lowering visibility to less than three miles, and volcanic ash. But now associate with thunderstorms.
- SIGMETs are unscheduled forecasts that are valid for four hours, but if the SIGMET relates to hurricanes, it is valid for six hours.
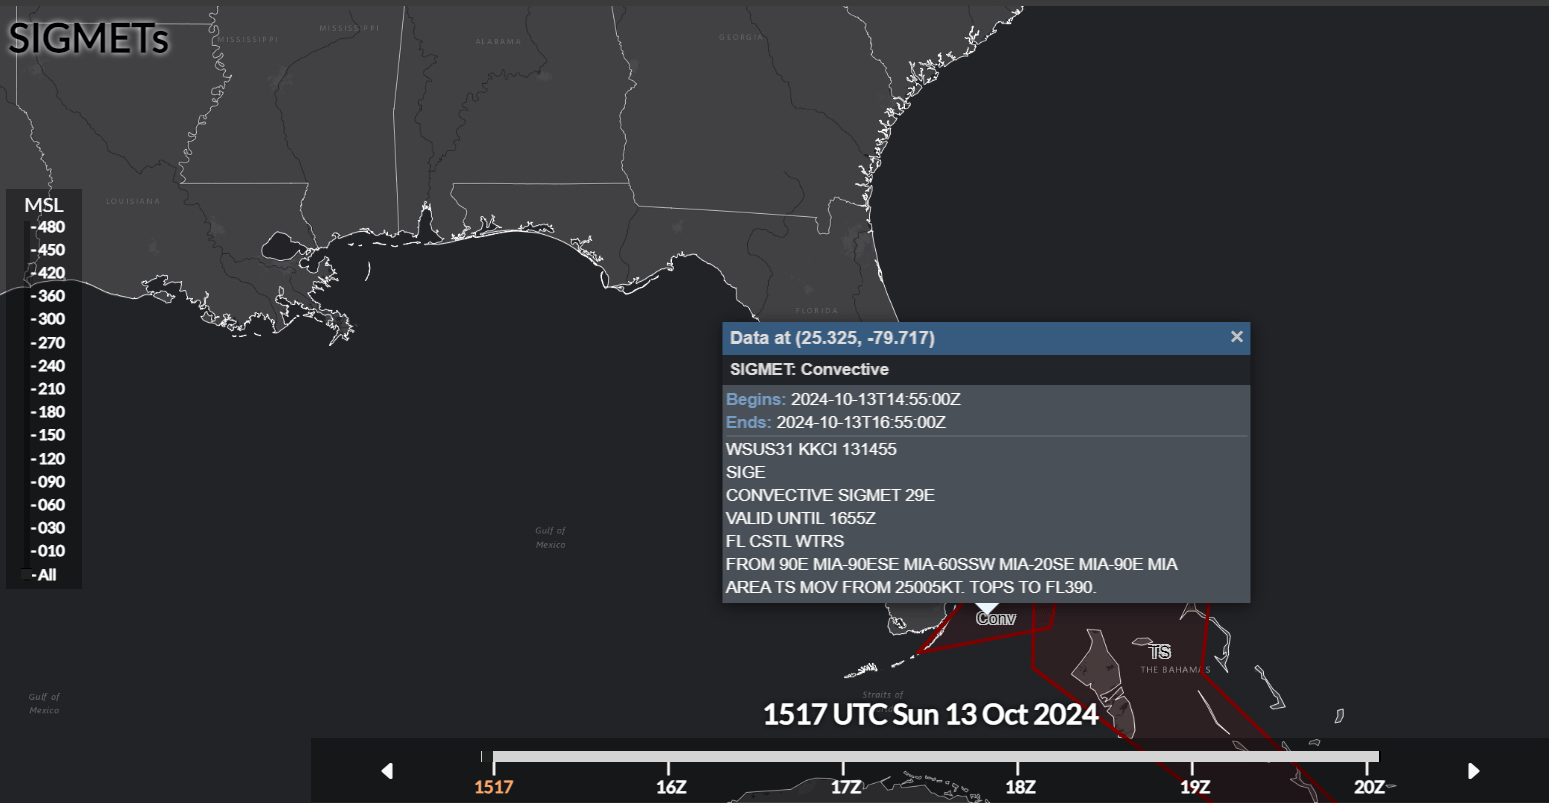
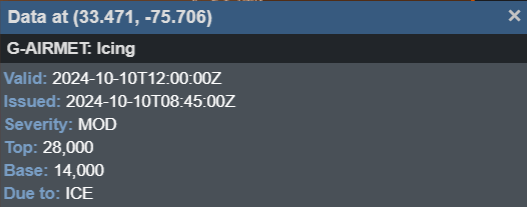
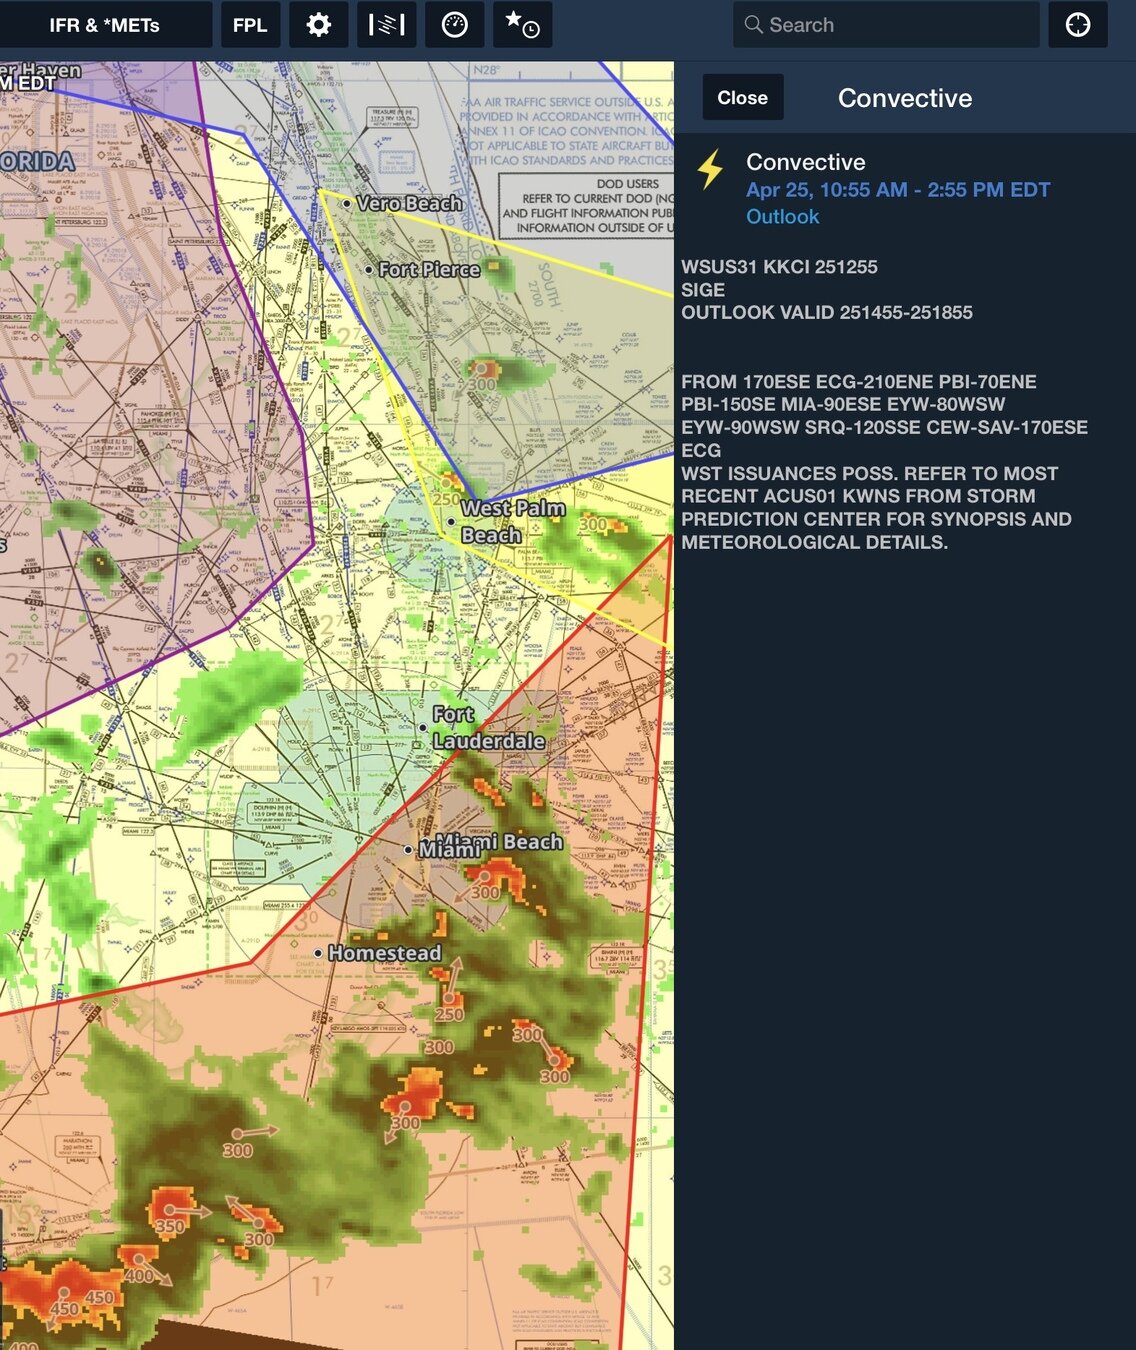
Convective SIGMET
Convective SIGMET (WTS)
- Issued for hazardous convective weather (thunderstorms) which is significant to the safety of all aircraft.
- Although they can be issued whenever necessary, they are typically issued at 55 minutes past the hour. They last for two hours.
-
WSTs include any of the following phenomena:
- tornadoes
- lines of thunderstorms, thunderstorms over a wide area,
- embedded thunderstorms
- hail greater than or equal to 3/4 inch in diameter, and/or
- wind gusts to 50 knots or greater.
-
A WST consists of either an observation
and a forecast.
Severe Weather Report and Forecasts
Some of the severe weather reports and forecasts are:
- Hurricane Advisory
- Convective Outlook
- Severe Weather Watch Bulletin
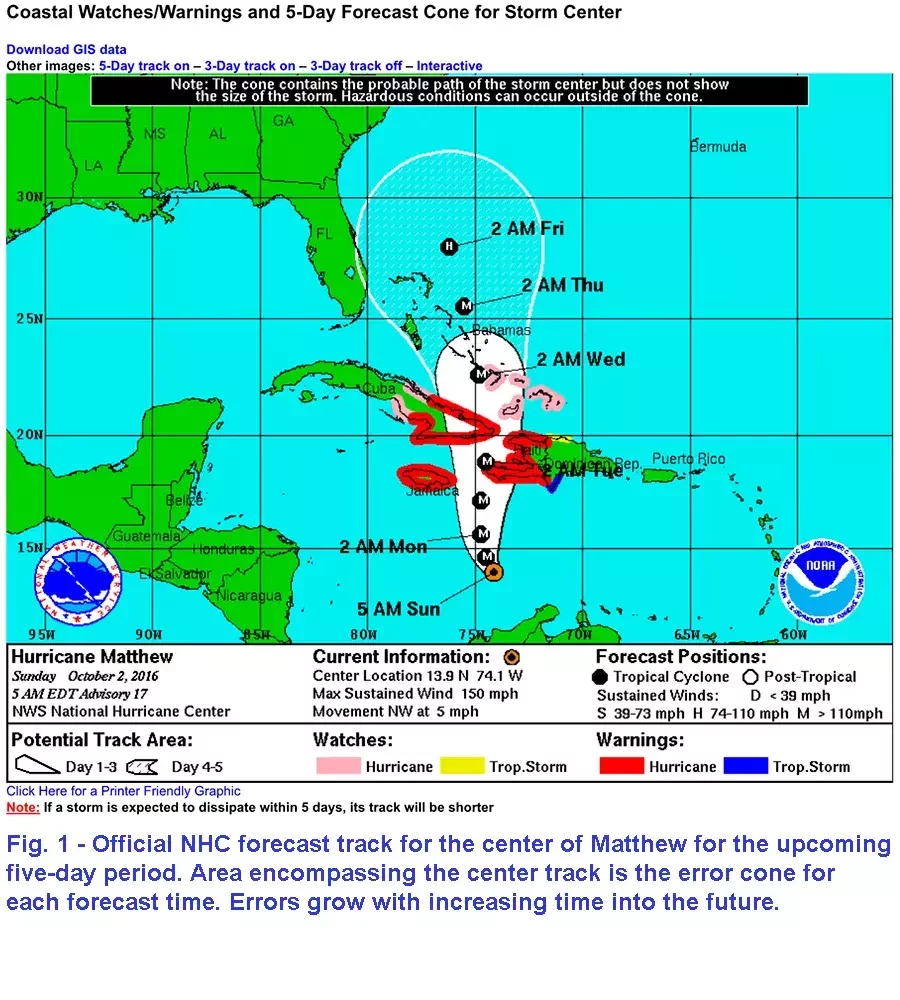
Hurricane Advisory (WH)
- When a hurricane is located at least 300 nautical miles offshore, but threatens a coastline, a hurricane advisory (WH) is issued every 6 hours.
- The WH gives the location of the storm center, its expected movement, and the maximum winds in and near the storm center.
- It is current data and does not contain specific ceilings, visibilities, and weather hazards.
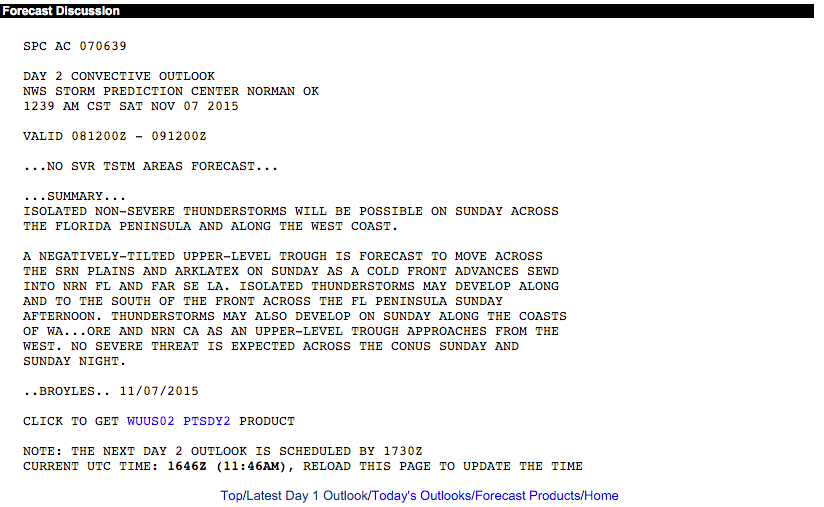
Convective Outlook (AC)
Is a national forecast of thunderstorm activity covering three 24-hour periods: Day 1 (5 times), Day 2 (2 times), and Day 3 (2 times). ACs describe areas with a slight, moderate, or high risk of severe thunderstorms.
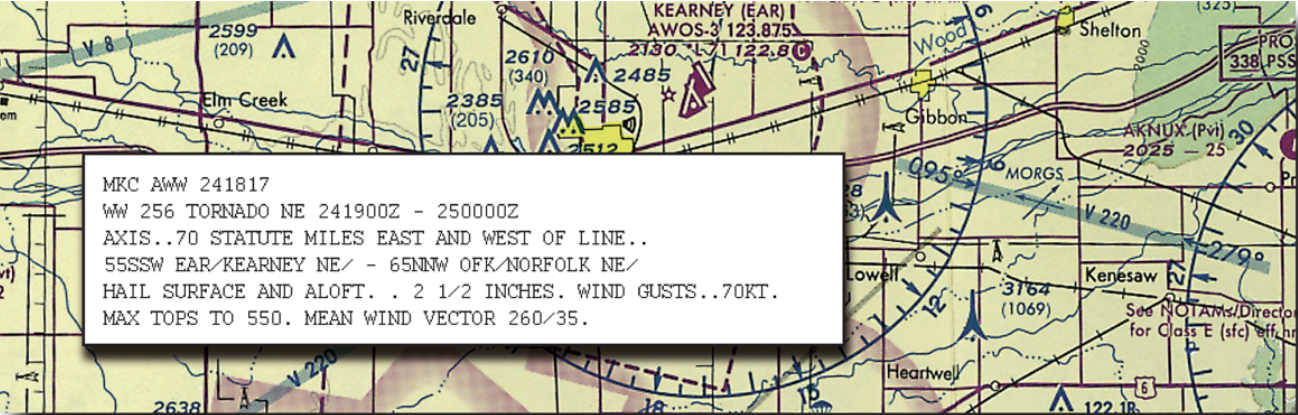
Severe Weather Watch Bulletin (WW)
Defines areas of possible severe thunderstorms or tornadoes. WWs are issued on an unscheduled basis and are updated as required.
Graphic Weather Products
Graphic weather reports provide weather observations from weather radar, satellites and other sources.
- Includes observational data, forecasts, and warnings that can be viewed from 14 hours in the past to 18 hours in the future.
- Thunderstorms, clouds, flight category, precipitation, icing, turbulence, temperature, winds, ceiling and visibility.
- It also helps you determine the conditions at airports that do not have terminal aerodrome forecasts.
- Hourly model data and forecasts, including information on clouds, flight category, precipitation, icing, turbulence, wind, and graphical output from the National Weather Service’s National Digital Forecast Data (NDFD), are available.

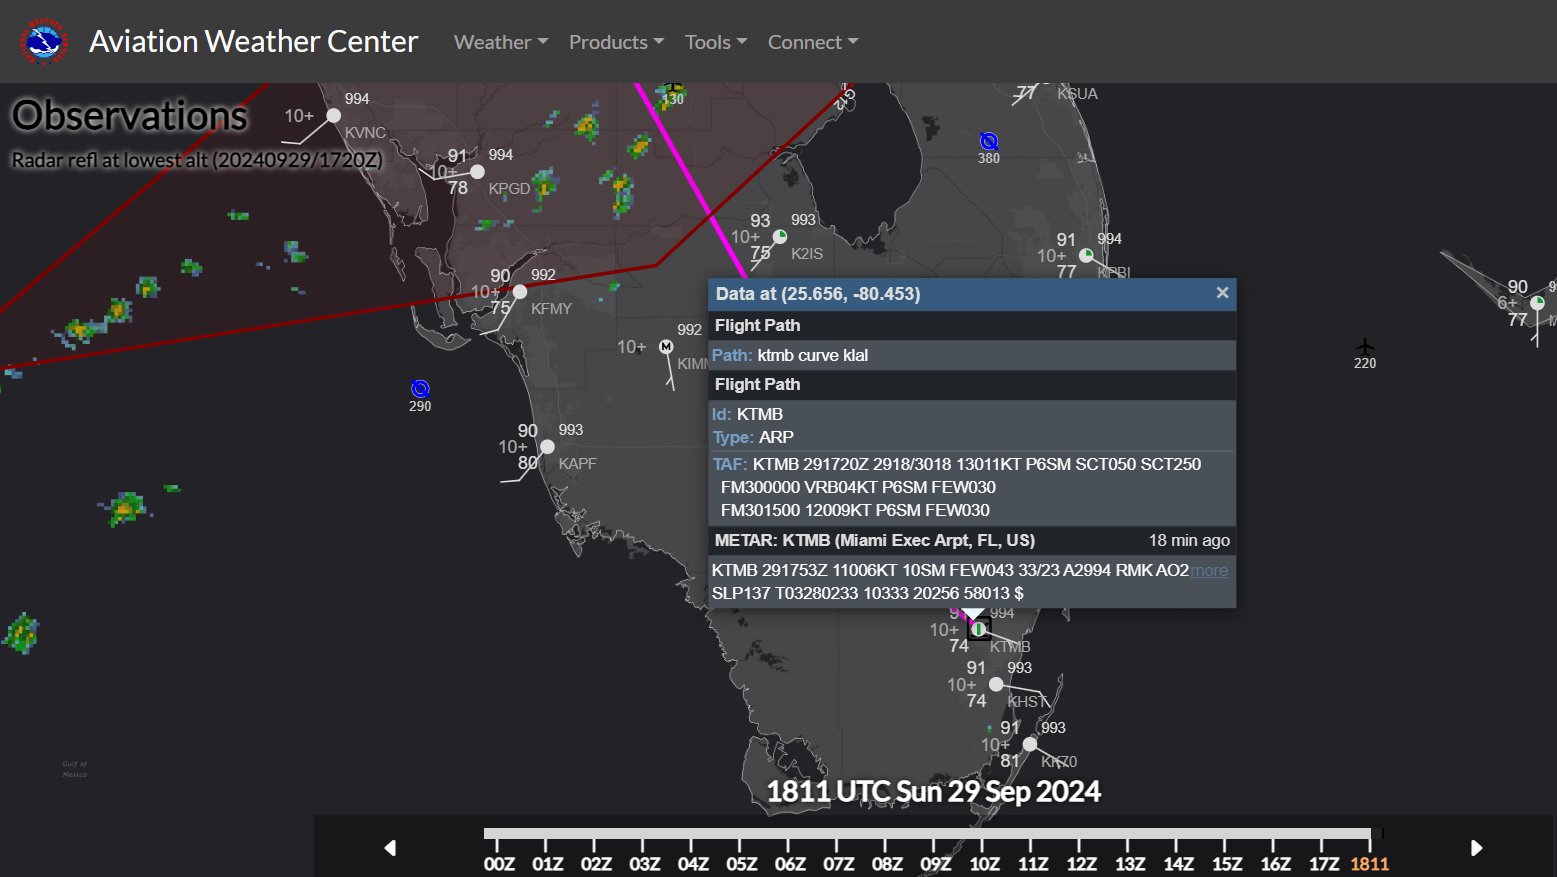
Observations
Weather data that has been collected by sensors. Most common type of weather observations are radar observations, satellite imagery and surface observations.
Radar Observations
- Weather radar observations provide a graphical display of both precipitation and non-precipitation targets detected by weather radar.
- The network of Weather Surveillance Radar - 1988 Doppler (WSR-88D) is continuously generating radar observations.
- The color on radar images represents the reflectivity of the precipitation target measured in decibels (dBZ).
Satellite Imagery
- There are some weather observations that were made from satellite imagery, as well as recorded temperatures, humidity, wind speeds, and water vapor areas.
- There are 3 types of satellite imagery: visible, infrared (IR), and water vapor.
Visible Satellite Imagery
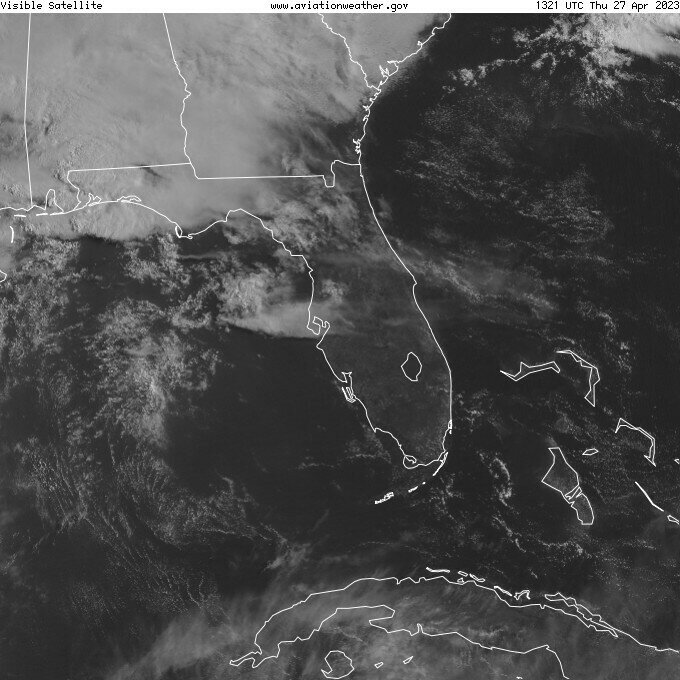
- Presence of clouds, their shape, and texture
-
Clouds usually are white
- Land and water appear in gray or black shades
- Produced by the reflection of sunlight (radiation), and the images are only available during daylight hours.
Infrared (IR) Satellite Imagery
- Depicting heat radiation created by different cloud tops and surfaces. Images are available for day or night hours.
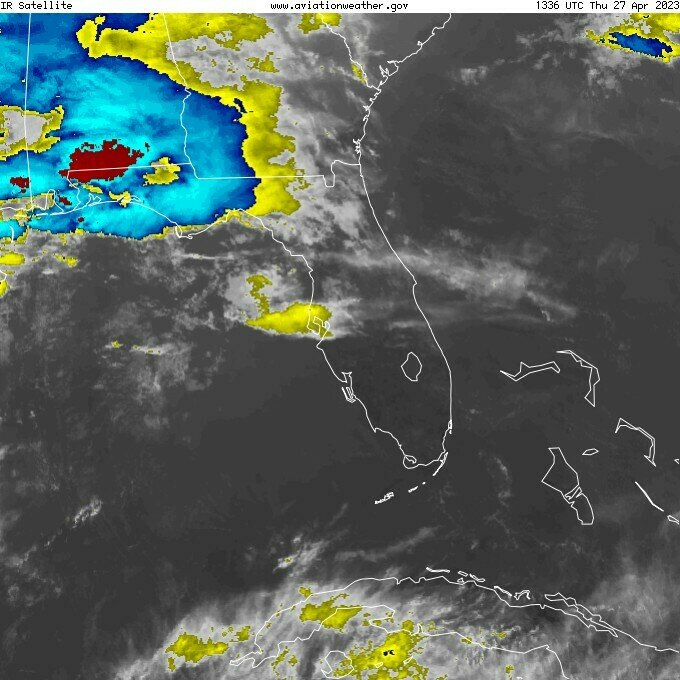
- Clouds that are very high in the atmosphere are often blue or purple.
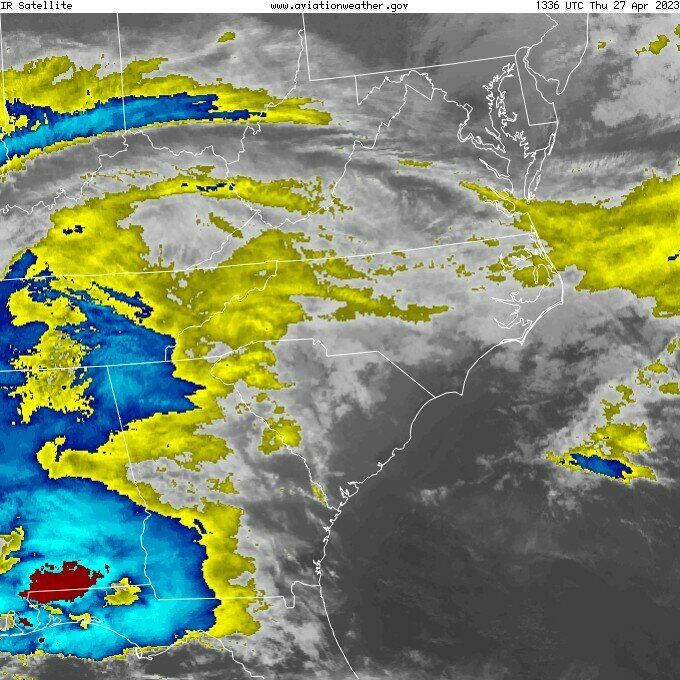
- Clouds that are very near the Earth's surface are warm and depicted orange or red.
Water Vapor Satellite Imagery
- Quantity of water vapor located in the middle and upper troposphere. Images are available during day or night hours.
- Determine the location and movement of weather systems, jet streams, and thunderstorms.
- Areas shown in red are very dry in the upper atmosphere and will show clear skies from the ground.
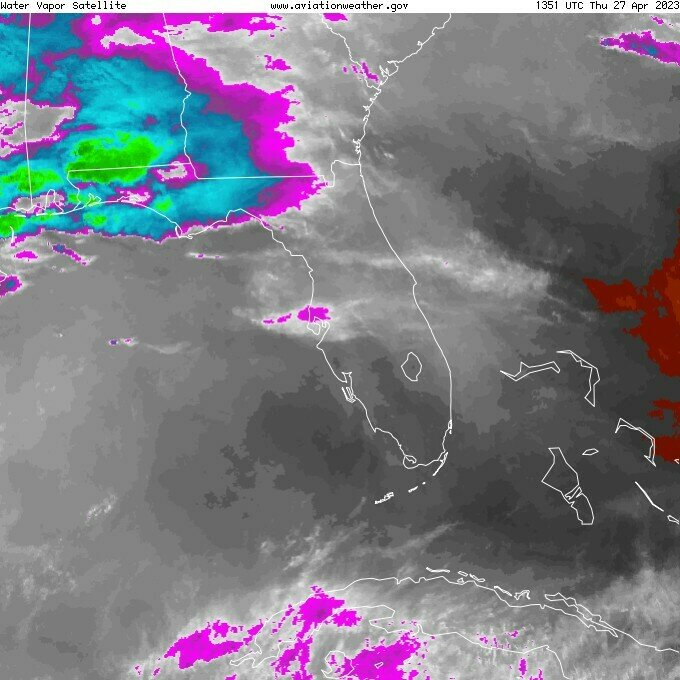
- Areas that are blue and green indicate high-level moisture, and clouds can be found in the mid and upper atmosphere.
How to change the Satellite Imagery view?
Graphical Depiction of METARs
- A graphical METAR can be thought of as a visual representation of a text METAR. It transforms the intricate codes and figures found in a text-based report into simple diagrams and symbols.
- You can rapidly understand key meteorological parameters, including wind direction and speed, visibility, cloud cover, temperature, and pressure, with the aid of this visual representation. Pilots may swiftly evaluate meteorological conditions and make well-informed judgments with the help of this useful tool.
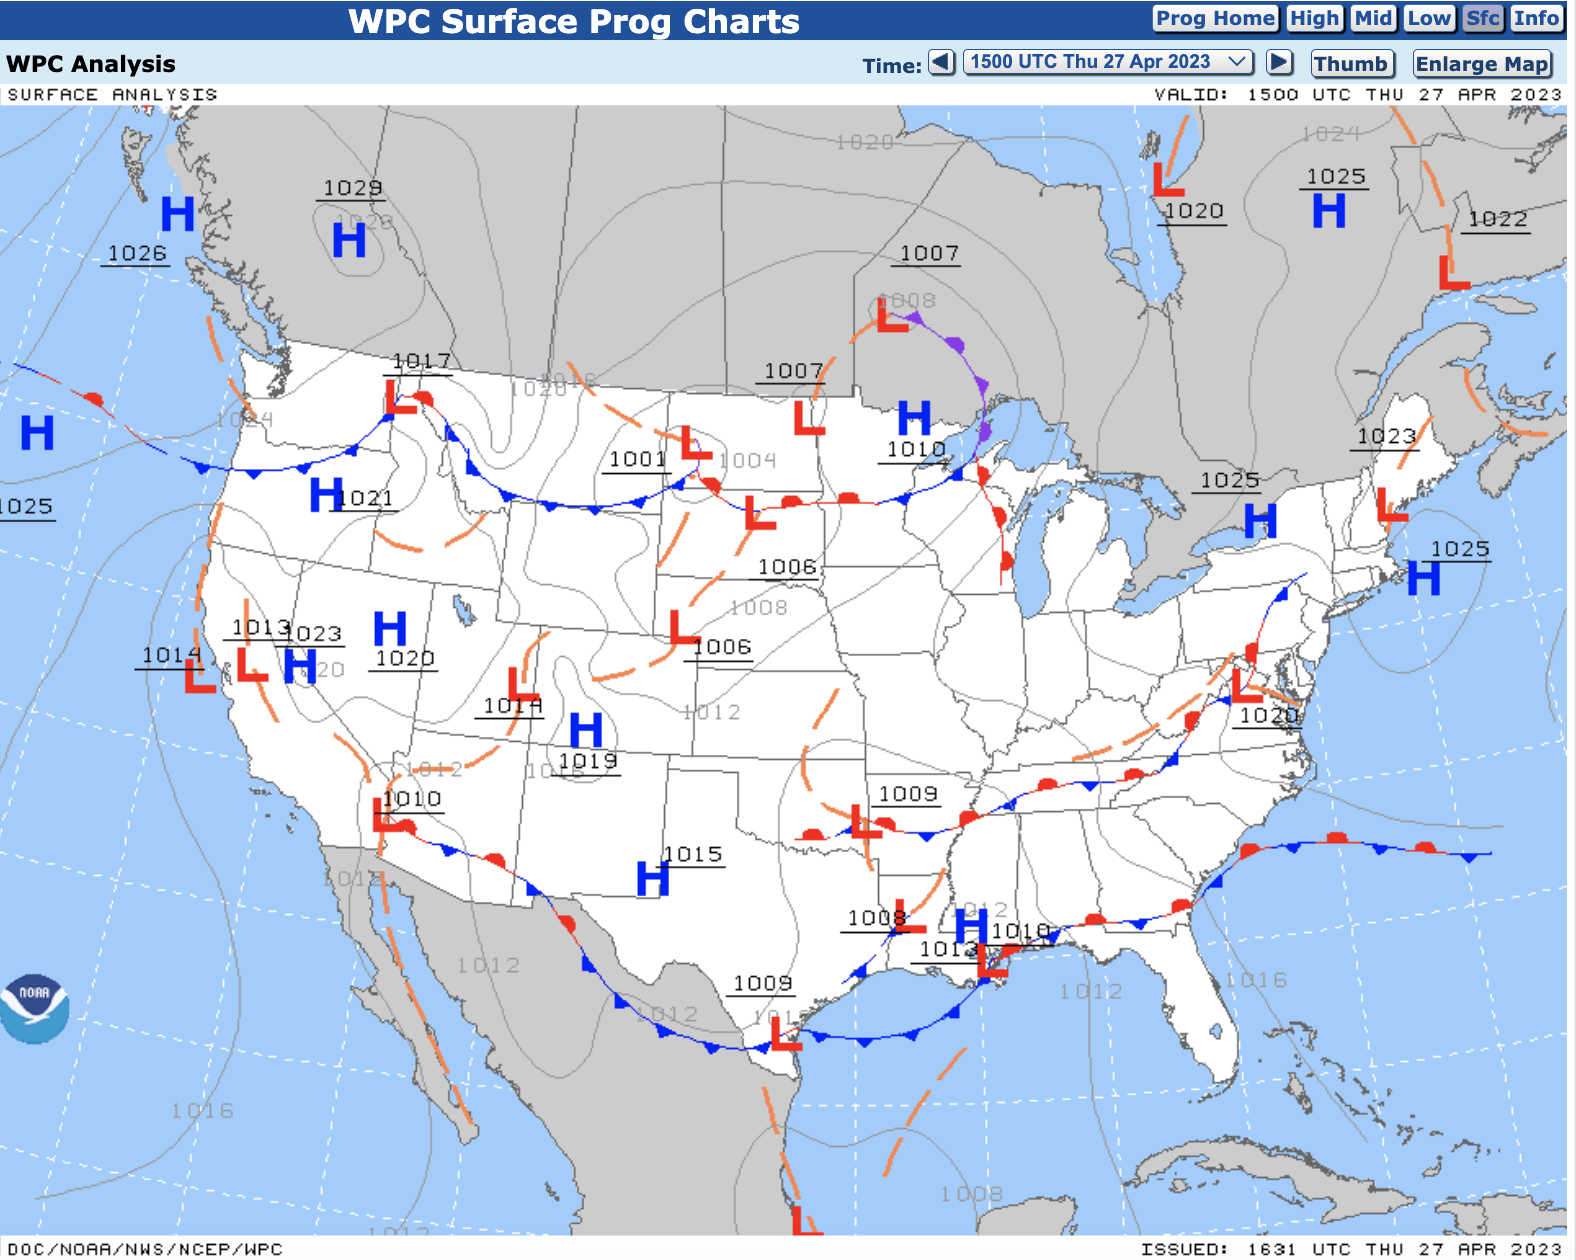
Analysis
Surface Analysis Chart
- You can get a picture of atmospheric pressure patterns at the earth’s surface.
- Also, locations of high and low-pressure systems and associated fronts.
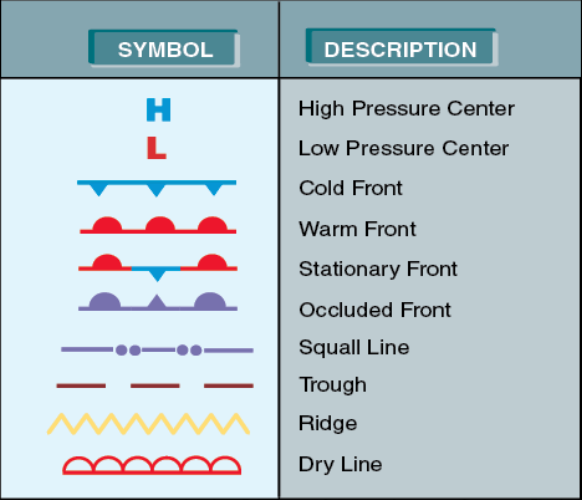
Cold front
Pressure in Milibars.
Pressure in Milibars.
A weather symbol is plotted if, at the time of observation, precipitation is either occurring or a condition exists, causing reduced visibility.
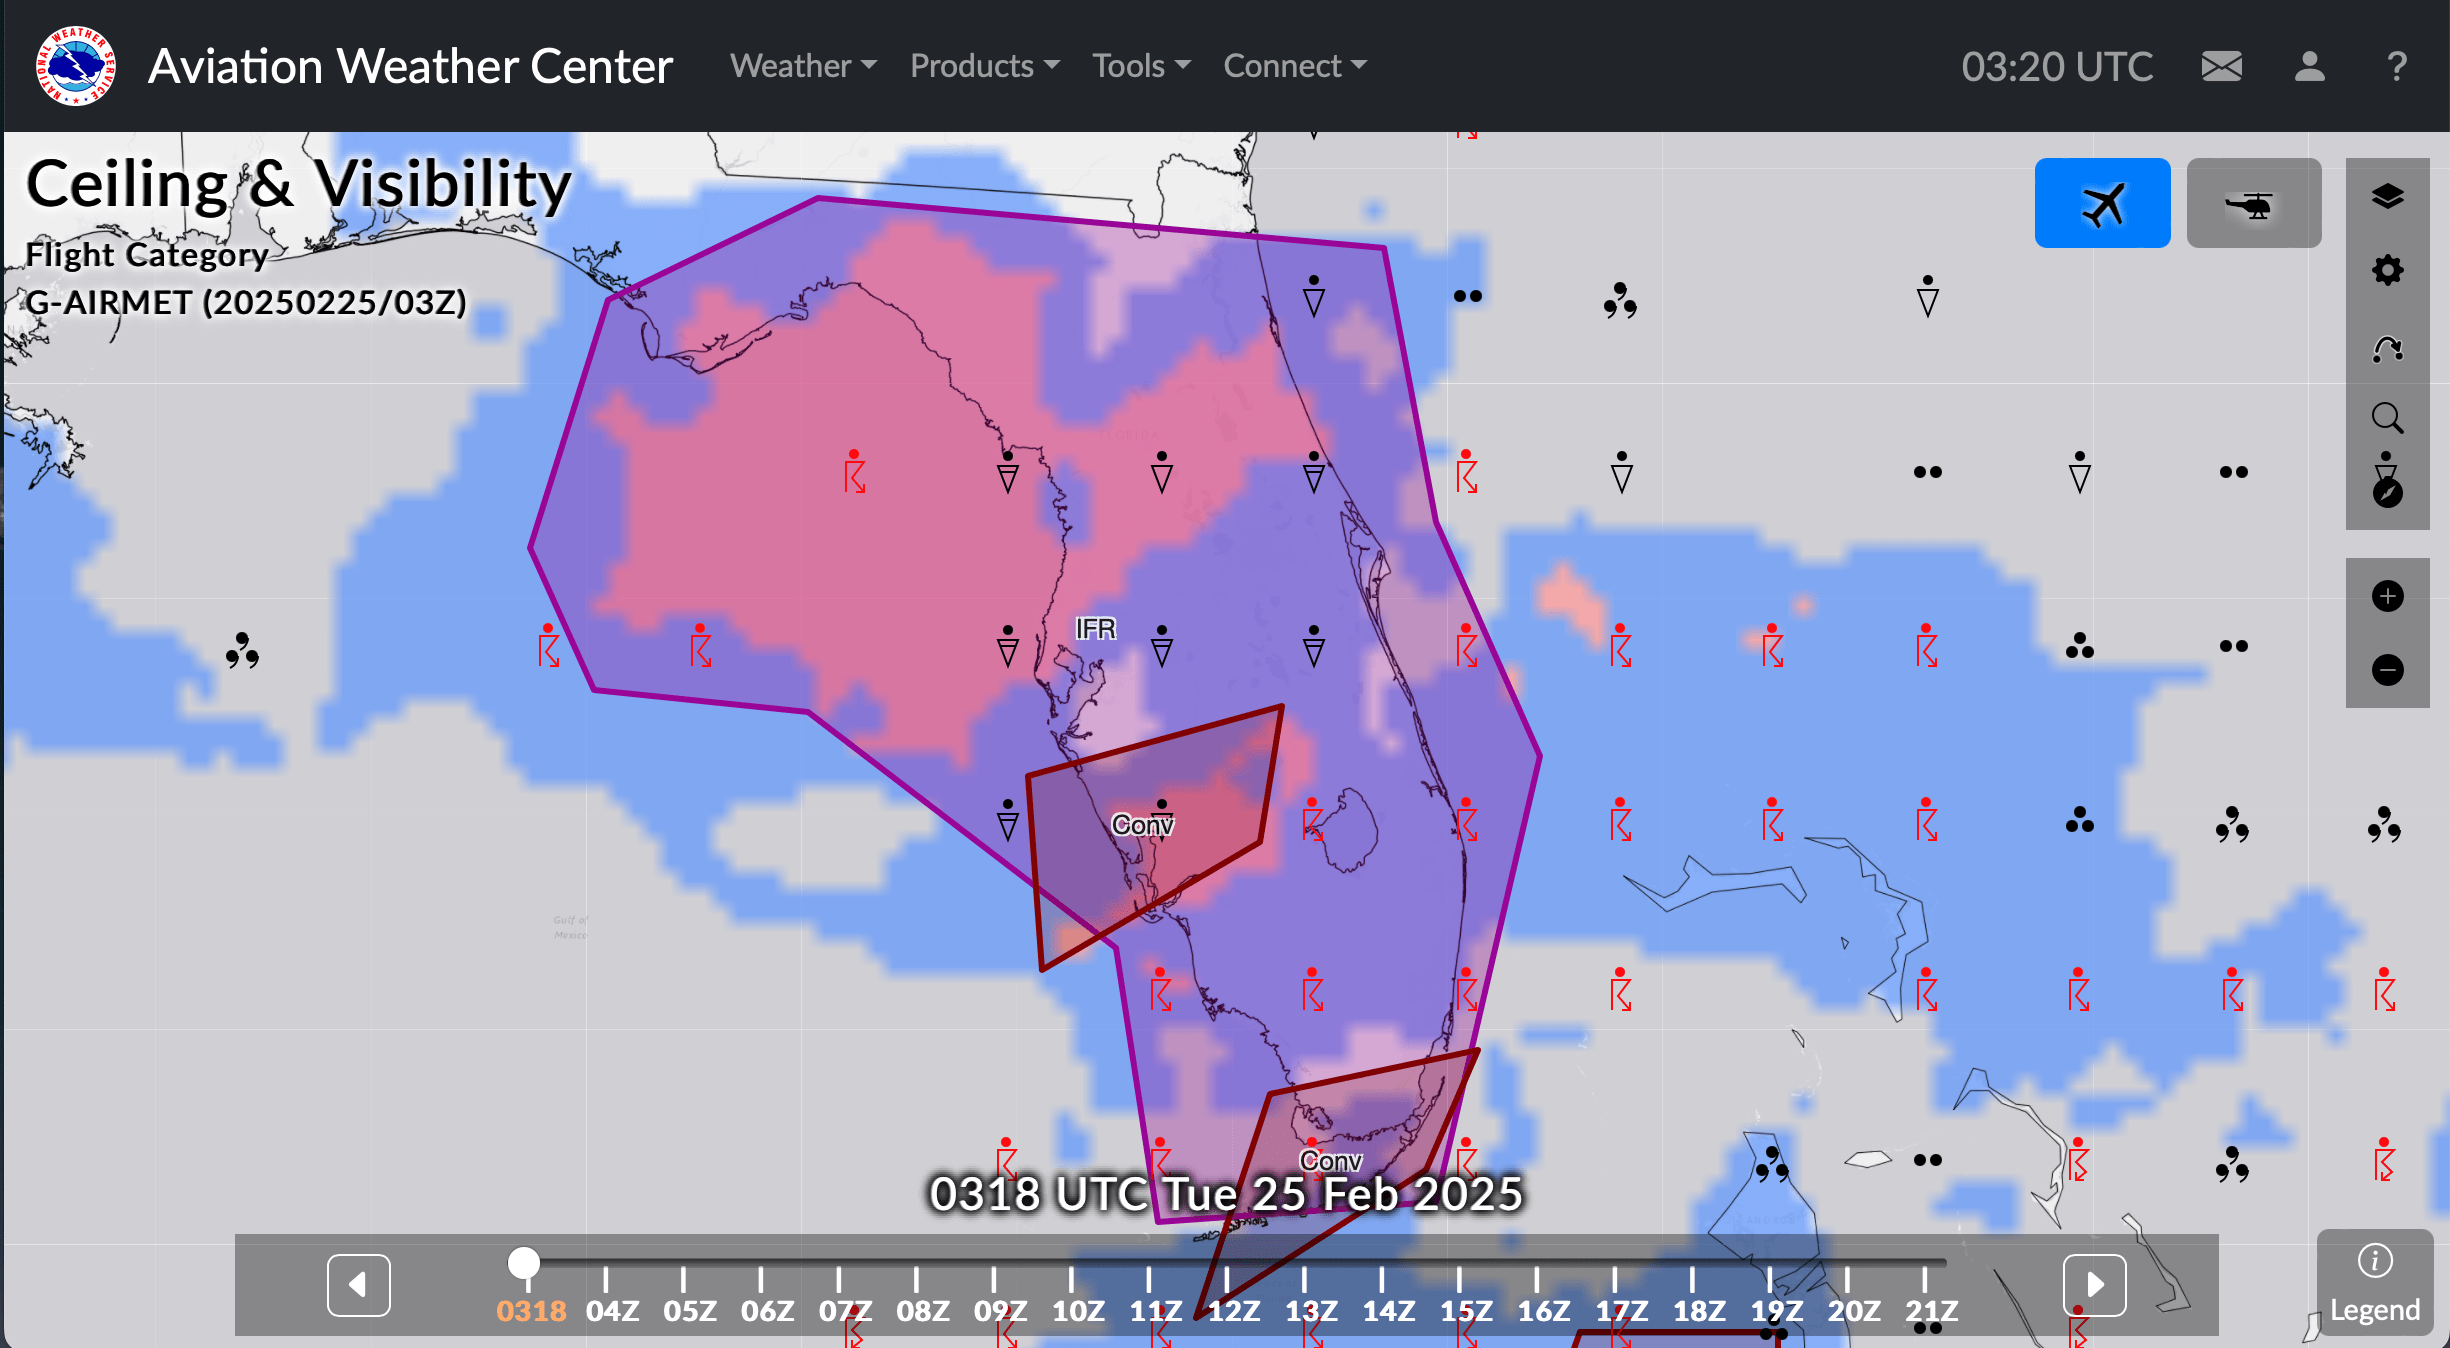
Ceiling and Visibility Analysis (CVA)
- Provides a real-time display of current observed and estimated ceilings and visibility across the U.S.
- It can be determined if it's VFR, MVFR, IFR, or LIFR conditions.
- CVA are updated every 5 minutes
Forecasts
Forecasts will help pilots understand the weather conditions such as ceilings and visibility, surface winds, icing conditions, hazardous weather and winds aloft.
Aviation Forecasts
-
There are 2 types of aviation forecasts:
- Aviation Cloud Forecast
- Aviation Surface Forecast
- On these charts, pilots will find cloud coverages, AIRMETs, weather phenomena, and winds.
- The forecasts are updated every 3 hours and provide forecasts for 3, 6, 9, 12, 15, and 18 hours in the future.
Aviation Cloud Forecast
- The colors on the chart are the amount of cloud coverage and the type of AIRMET.
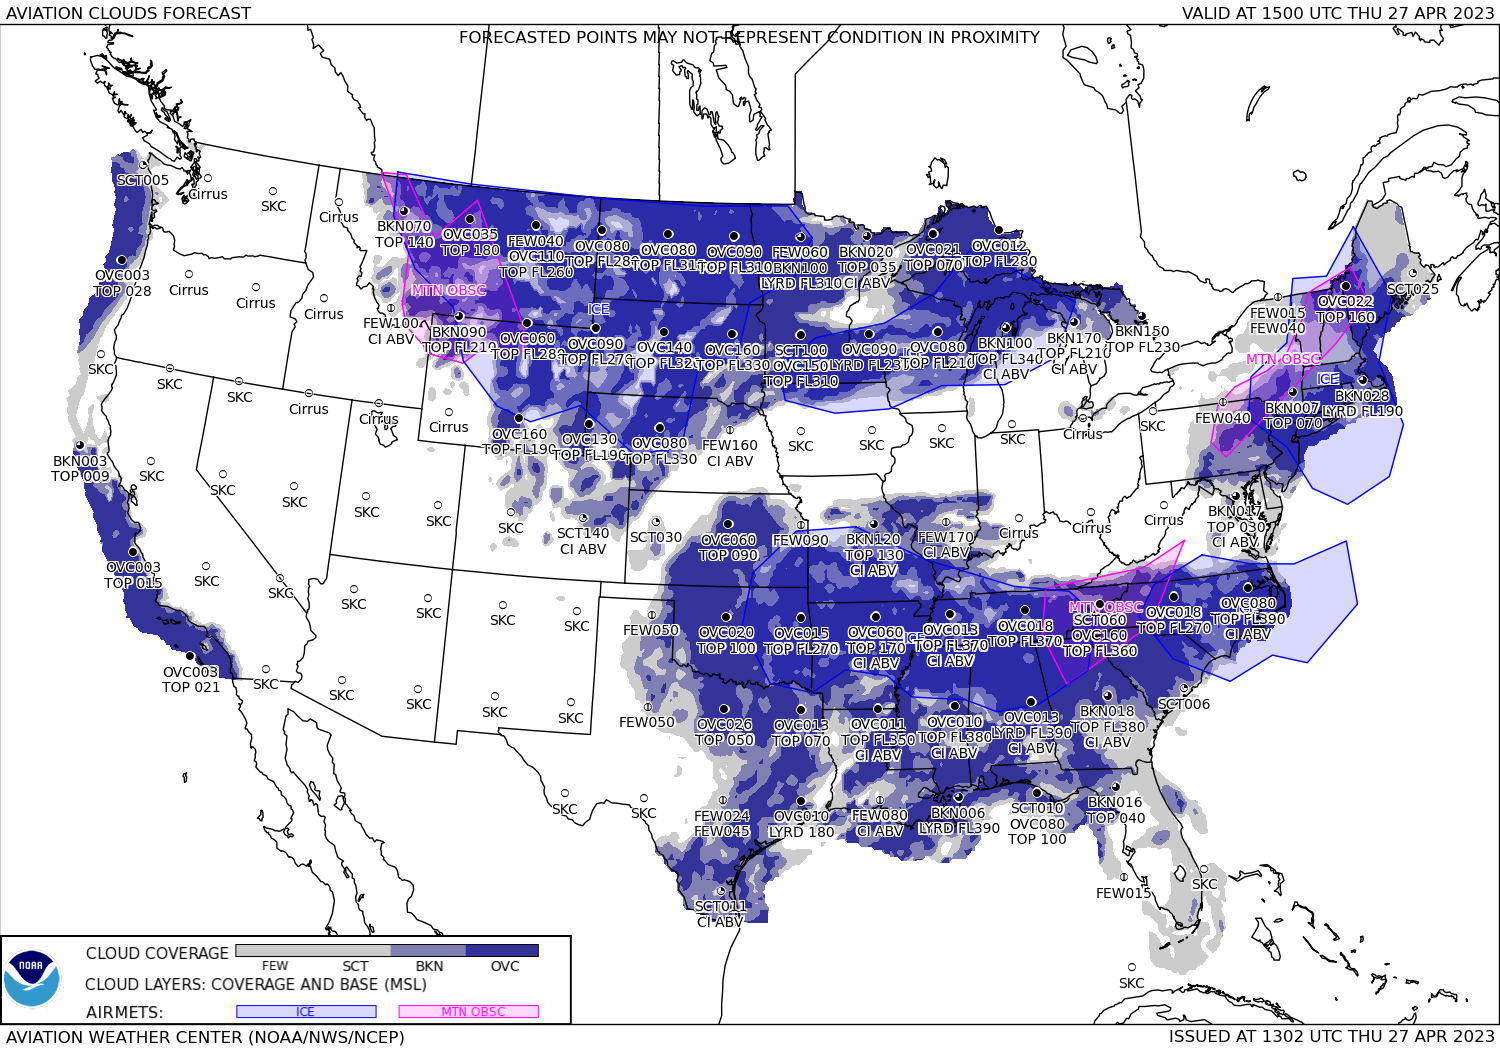
- Provides cloud coverage, bases, layers, and tops, AIRMETs for mountain obscuration and icing.
Aviation Surface Forecast
- The color indicates the flight category, type of AIRMET, and type of precipitation.
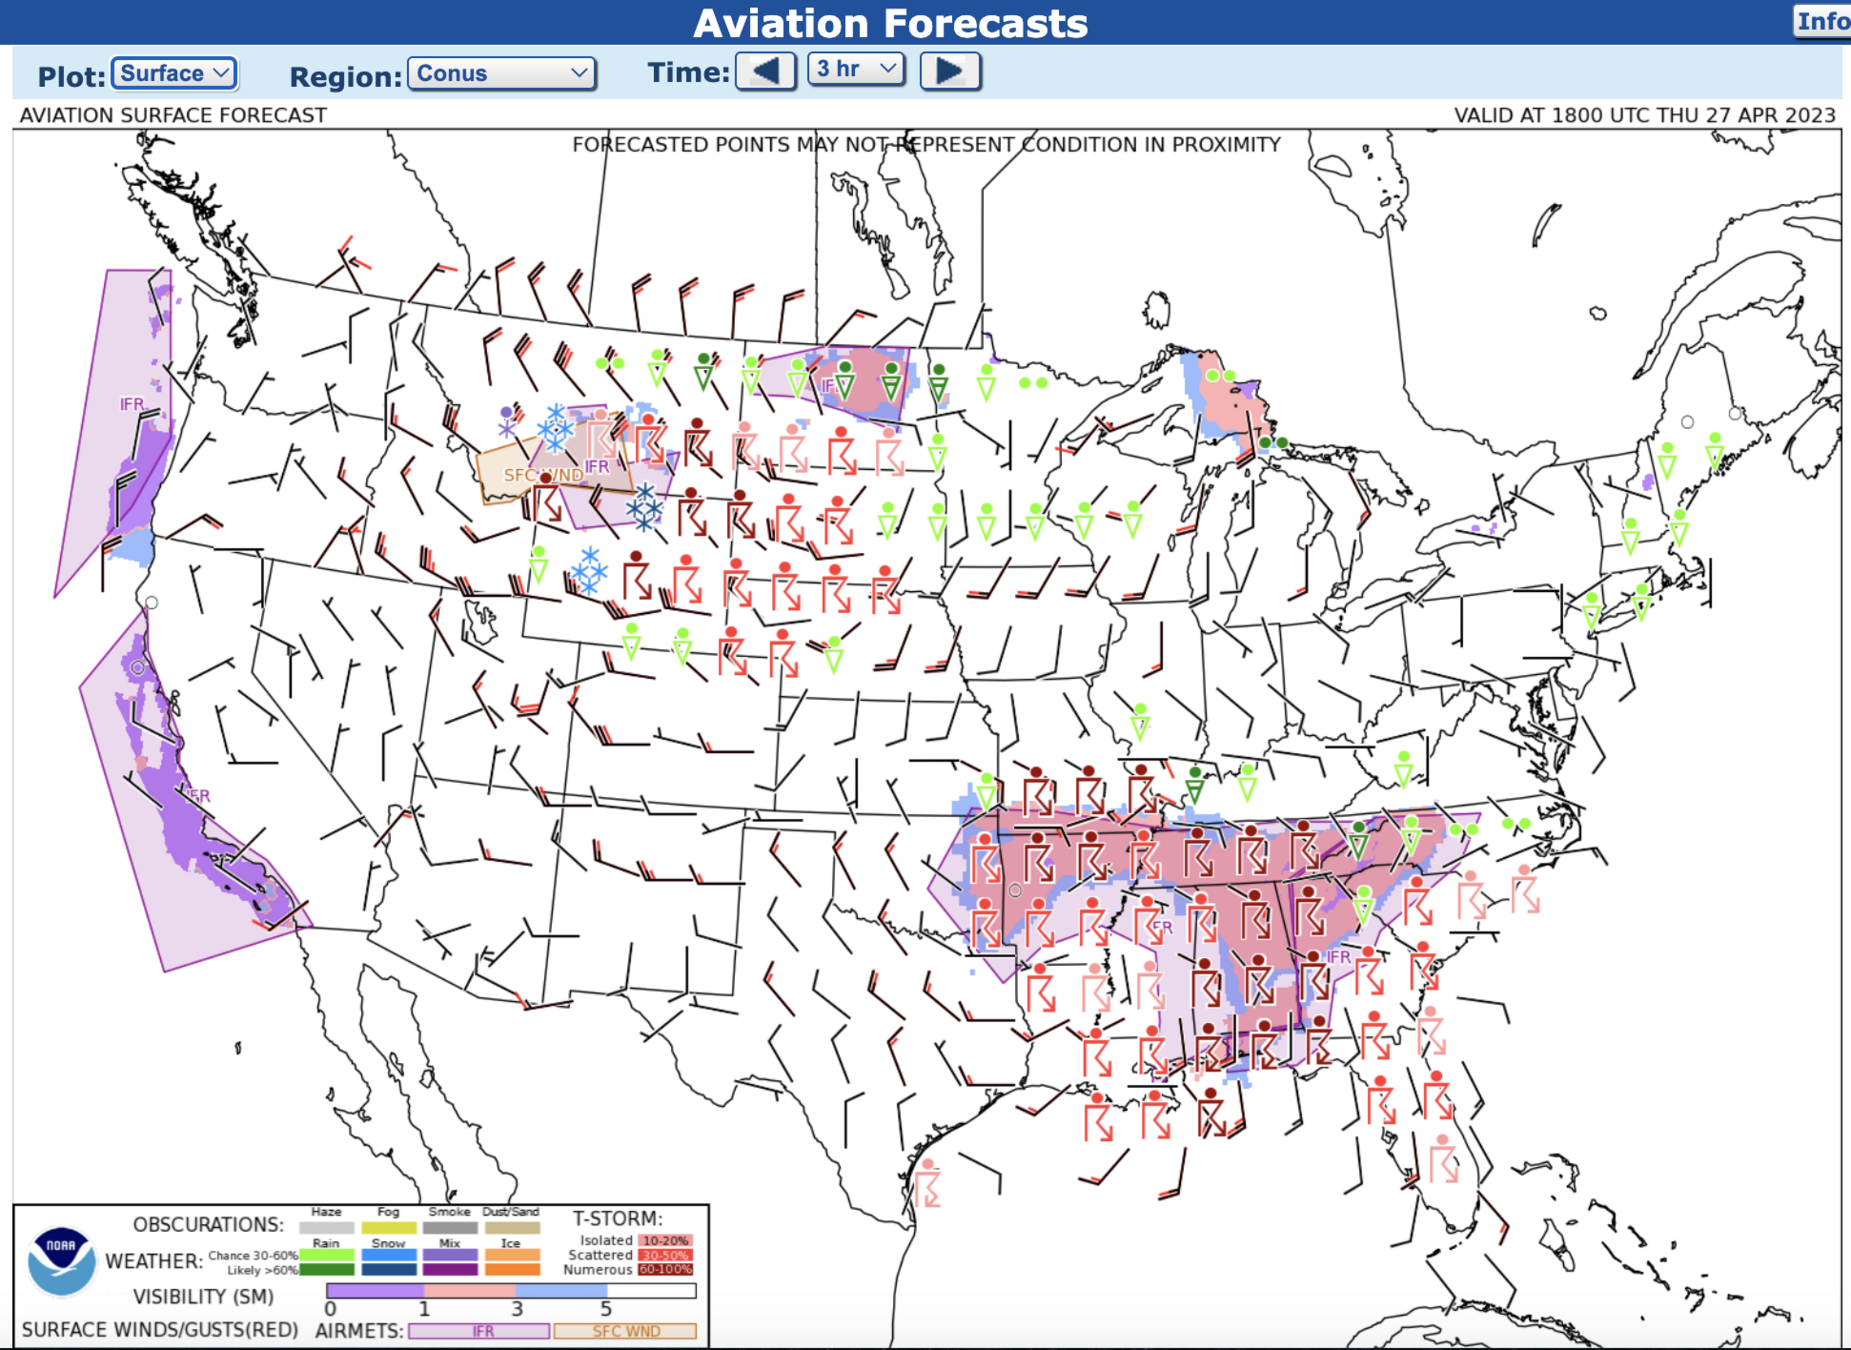
- Provides visibility, weather phenomena, winds and gusting winds, AIRMETs for IFR conditions, and sustained winds of more than 30 kts.
Short-Range Surface Prognostic (PROG) Chart
- An overview of the progression of surface weather, such as a change in position, size intensity of conditions over a time period.
- The chart contained standard symbols for fronts, isobars, and low and high pressure centers.
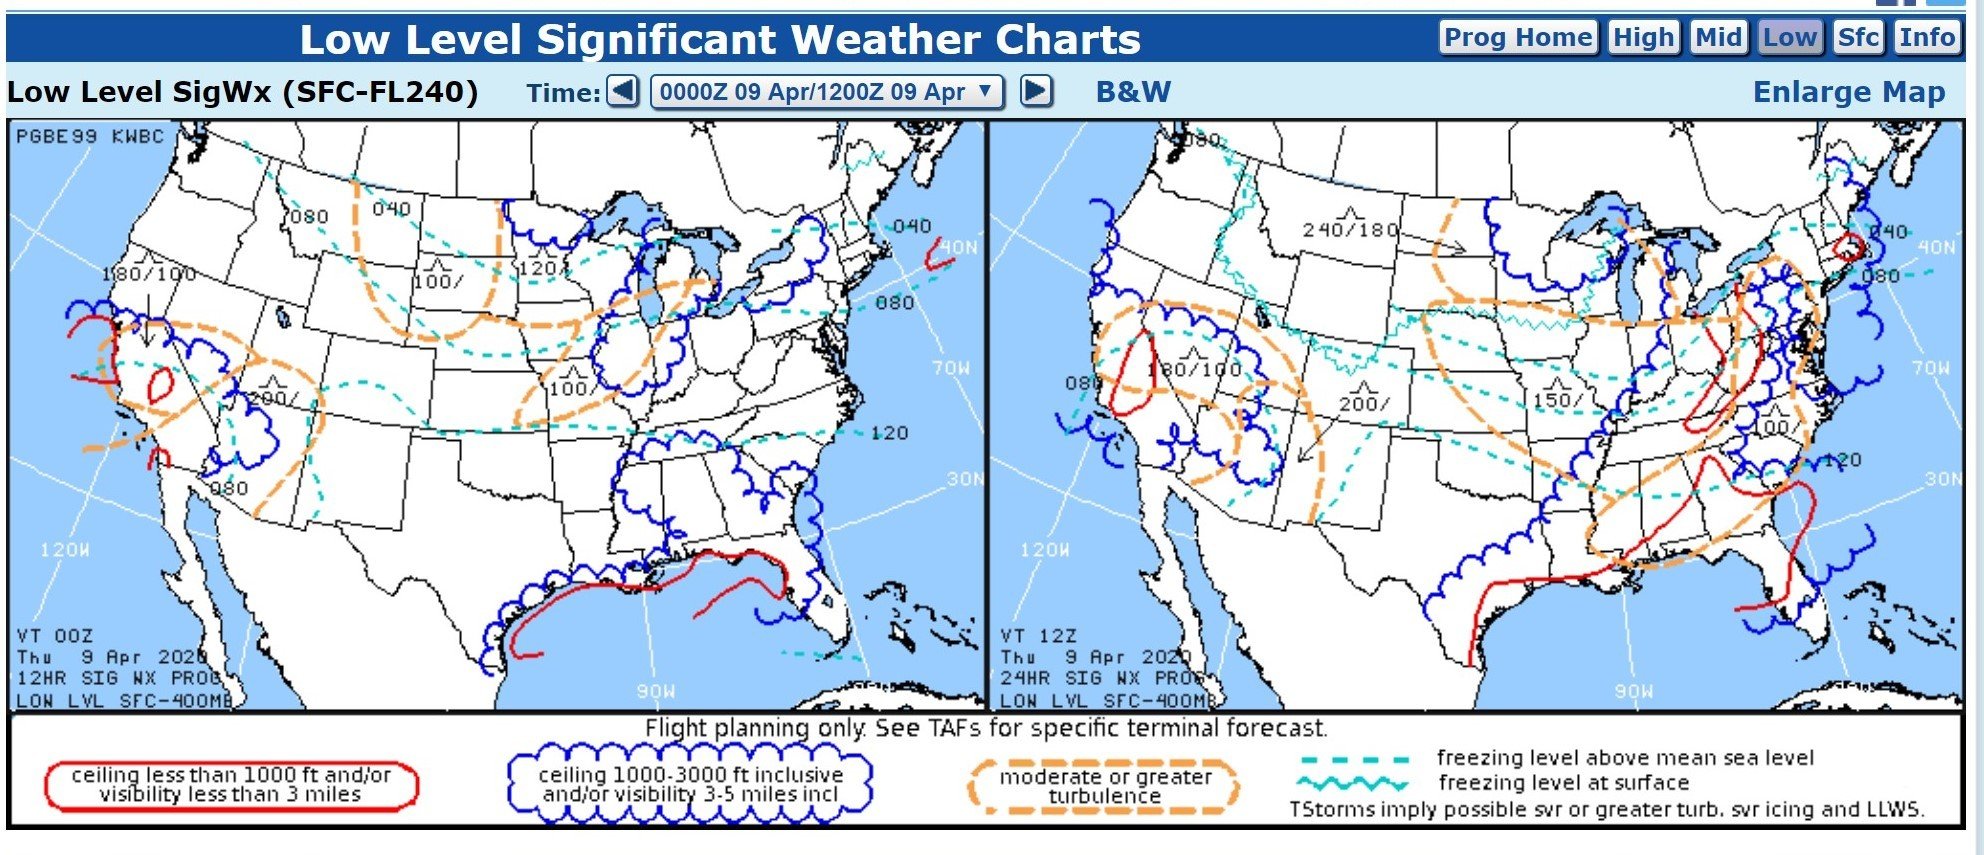
U.S. Low-Level Significant Weather (SIGWX) Chart
- Valid from the surface up to FL240.
- It is designed to help you plan your flights to avoid areas of low visibilities and ceilings as well as regions where turbulence and icing may exist.
- Low-level prog charts are issued are issued 4 times a day with a 12 hour and 24 hour panel.
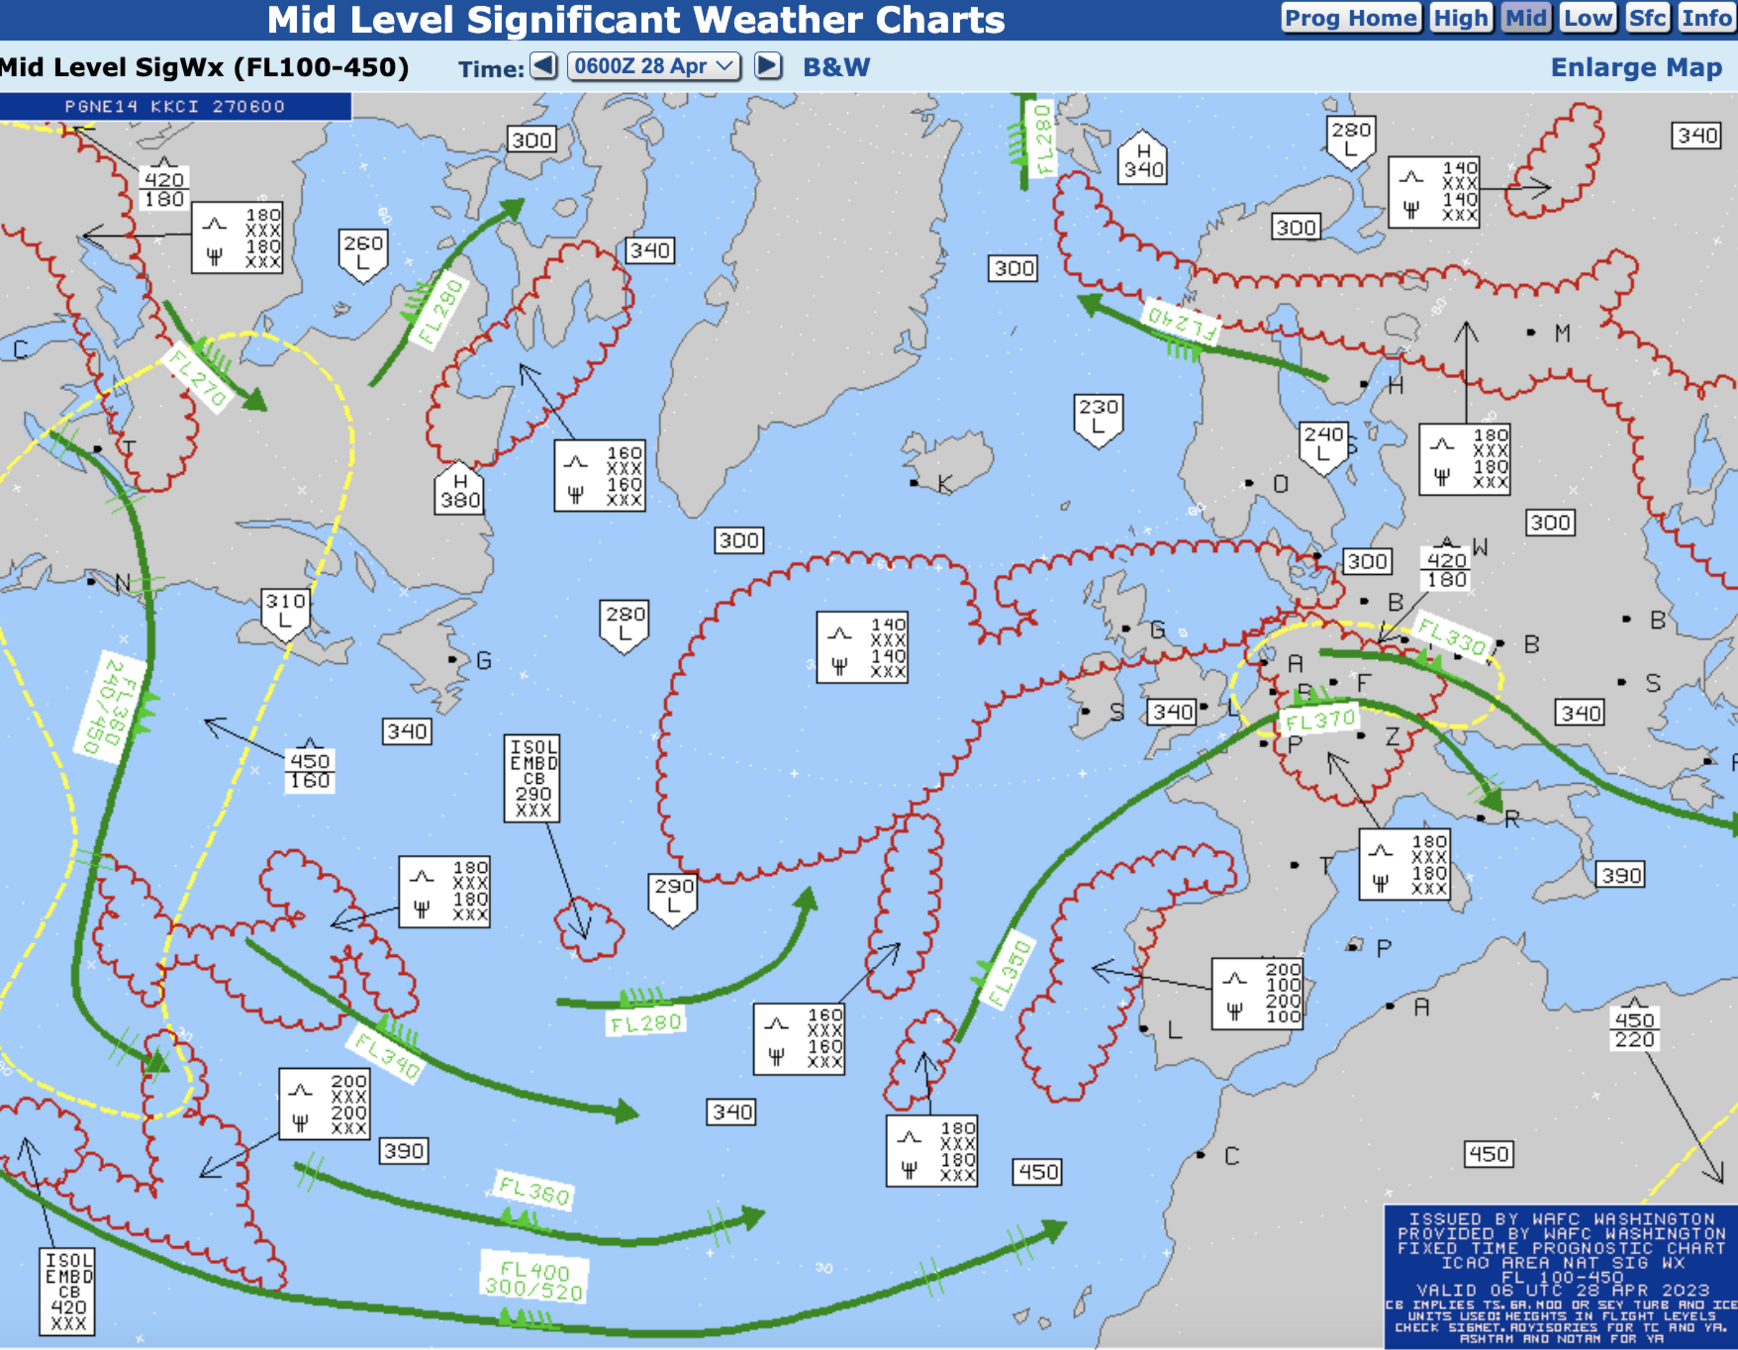
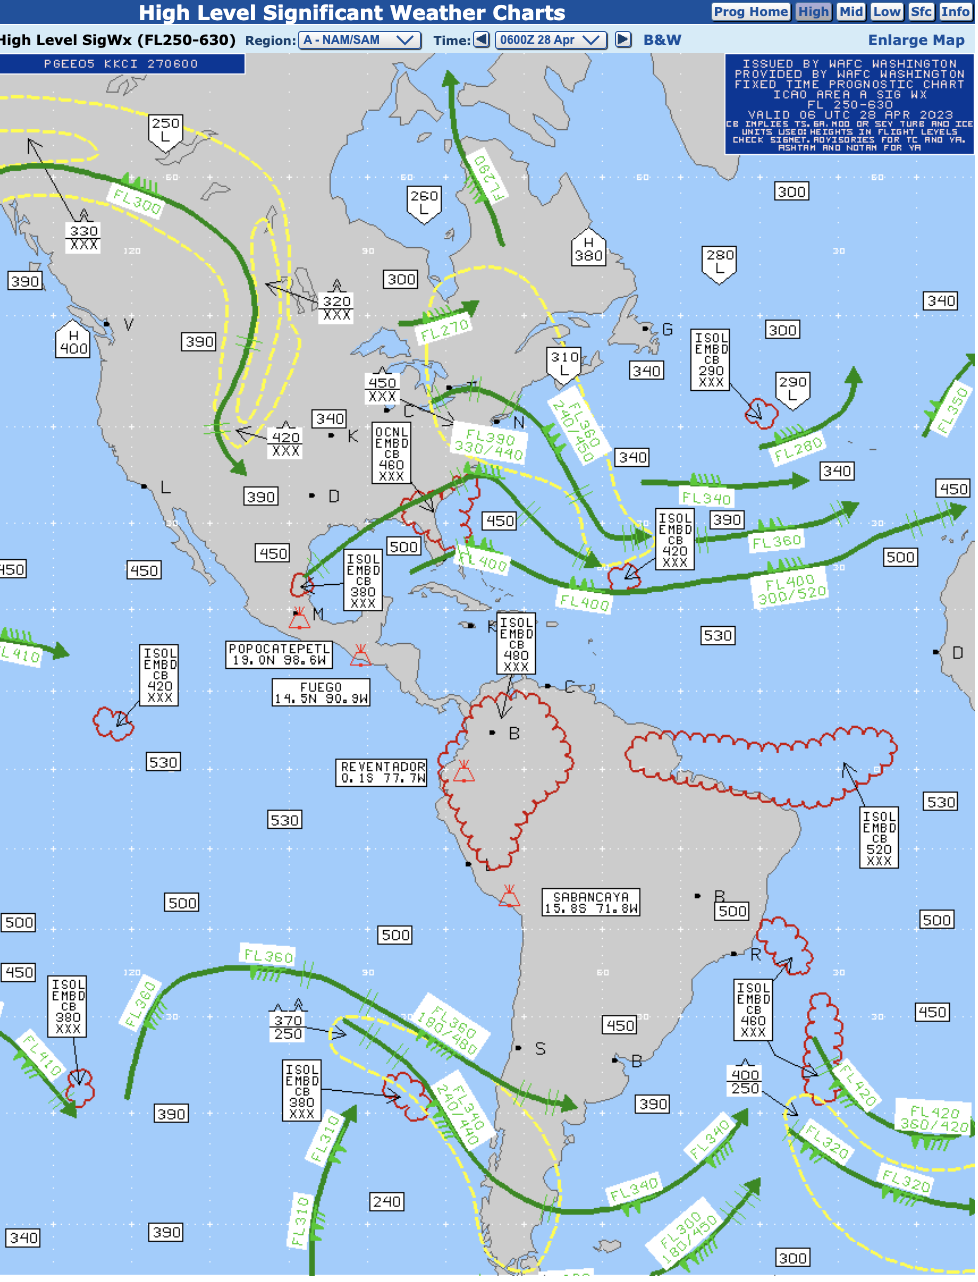
Mid- and High-Level SIGWX Charts
- Mid-level SIGWX chart covers altitude from 10,000 ft MSL to FL450 and issued for North Atlantic Ocean Region.
- High-level SIGWX chart covers altitude from FL250 to FL630 and issued for areas all over the world.
- Forecasted weather such as thunderstorm, tropical cyclones, squall lines, moderate or greater turbulence, jet streams, volcanic activity are being depicted on these charts.
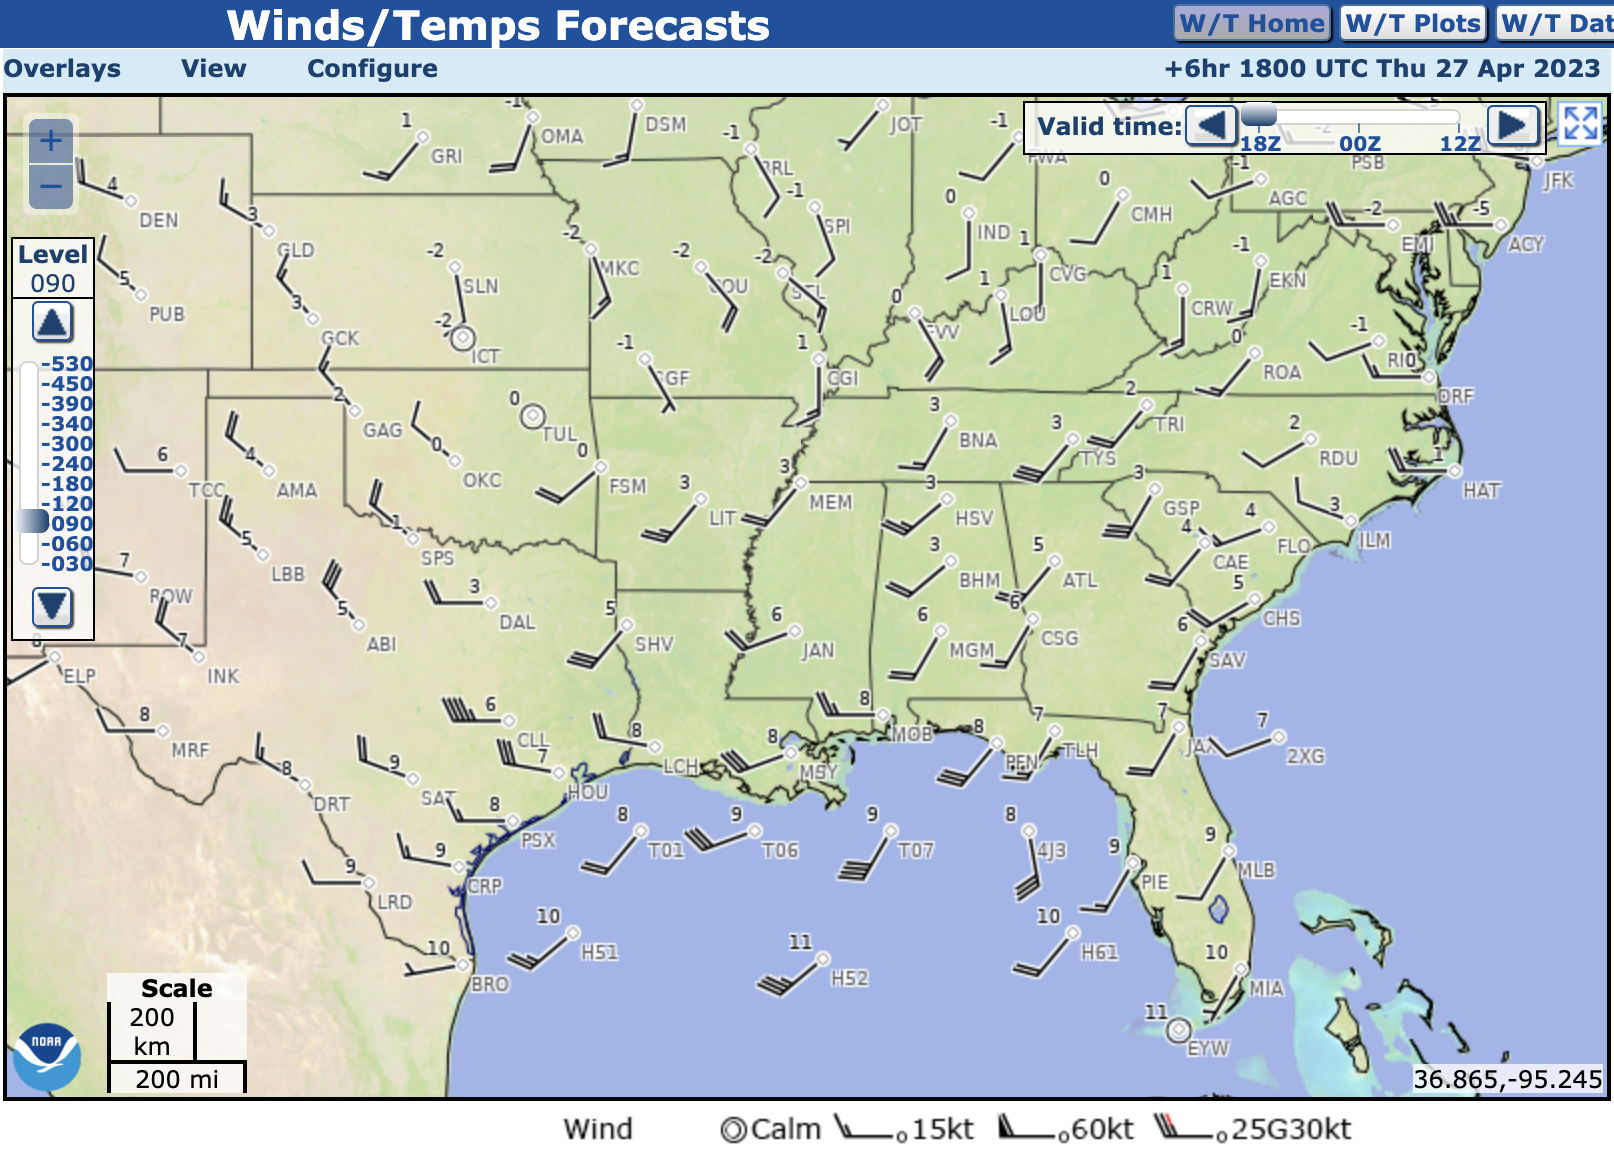
Winds and Temperatures Aloft Forecast
- Graphical charts depict wind direction, wind speed, temperature at specific altitudes, times and locations.
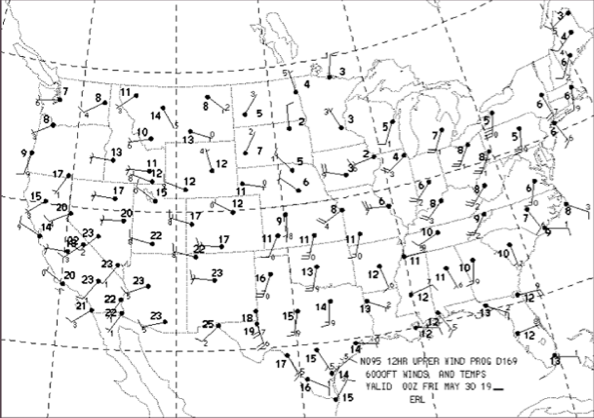
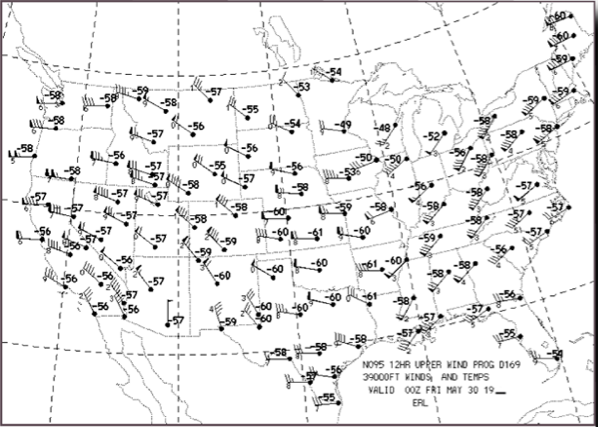
- Altitude and time frame can be selected for a 6, 12, 24 hour forecast.
Wind forecasts are not issued for altitudes within 1,500 ft of the location's elevation, and temperature forecasts are not issued for altitudes within 2,500 ft.
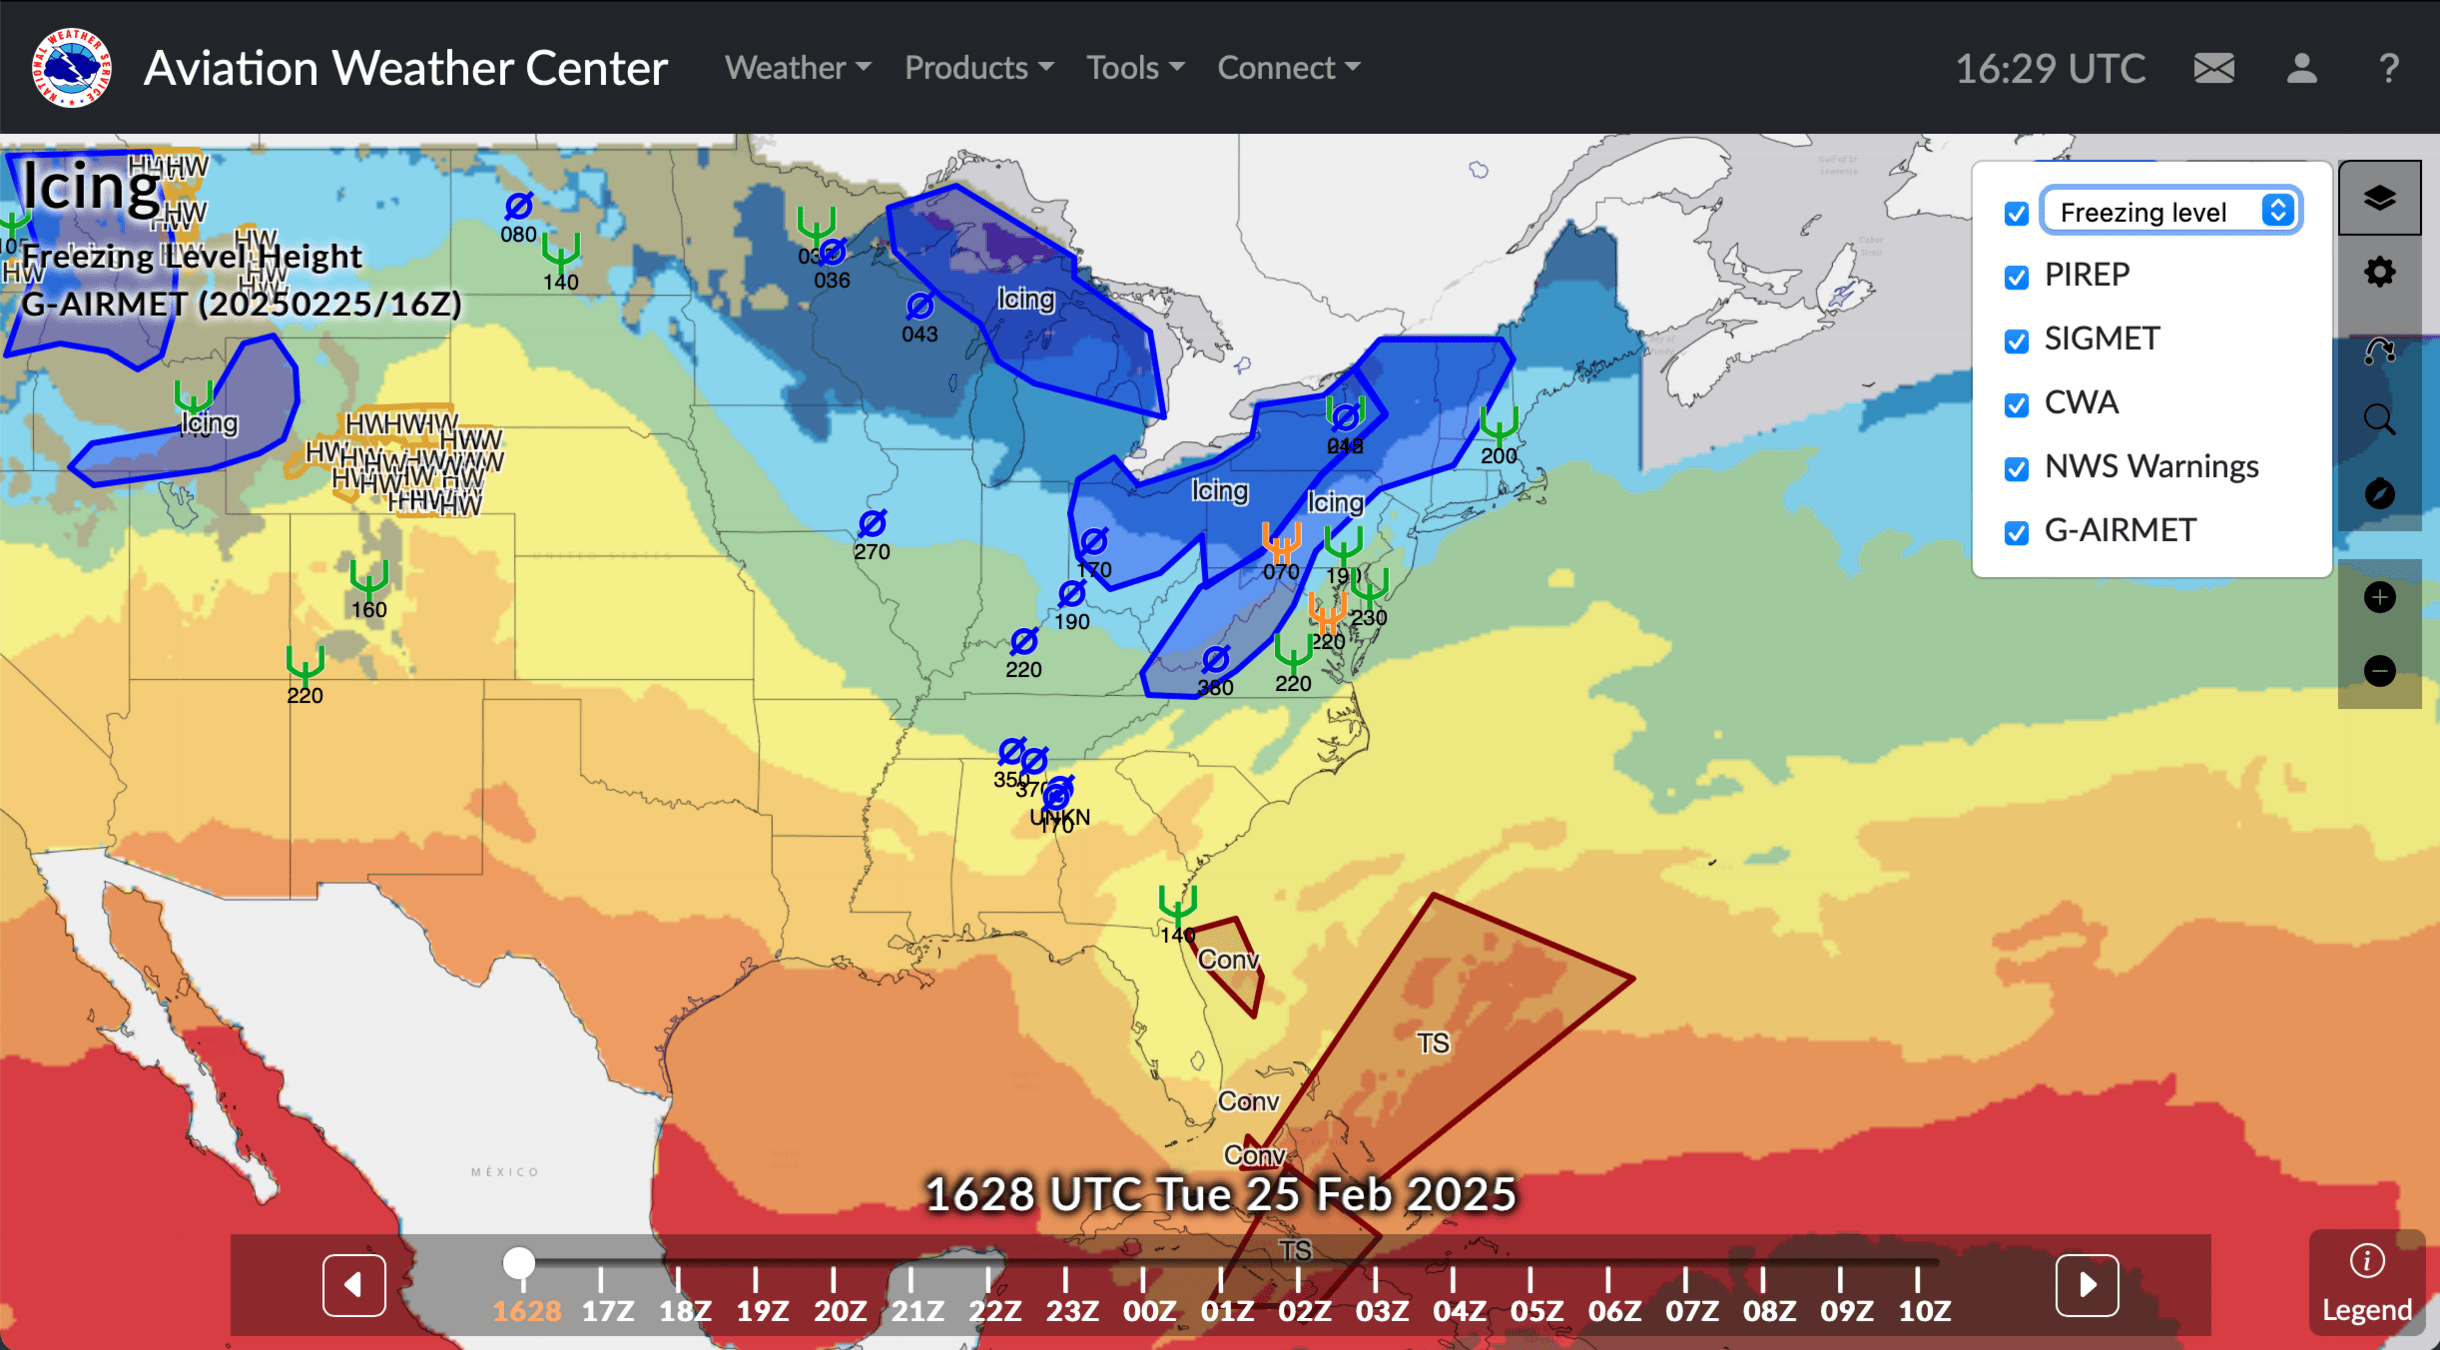
Freezing-Level Graphics
- You can check AIRMETS, PIREPS for the most updated Icing and freezing conditions of the area.
- Freezing-level graphics are one of the good sources that will help with assessing the risk of ice when planning an ift flight.
- The colors on the freezing-level graphics represent the height in hundreds of feet above MSL of the lowest freezing level.
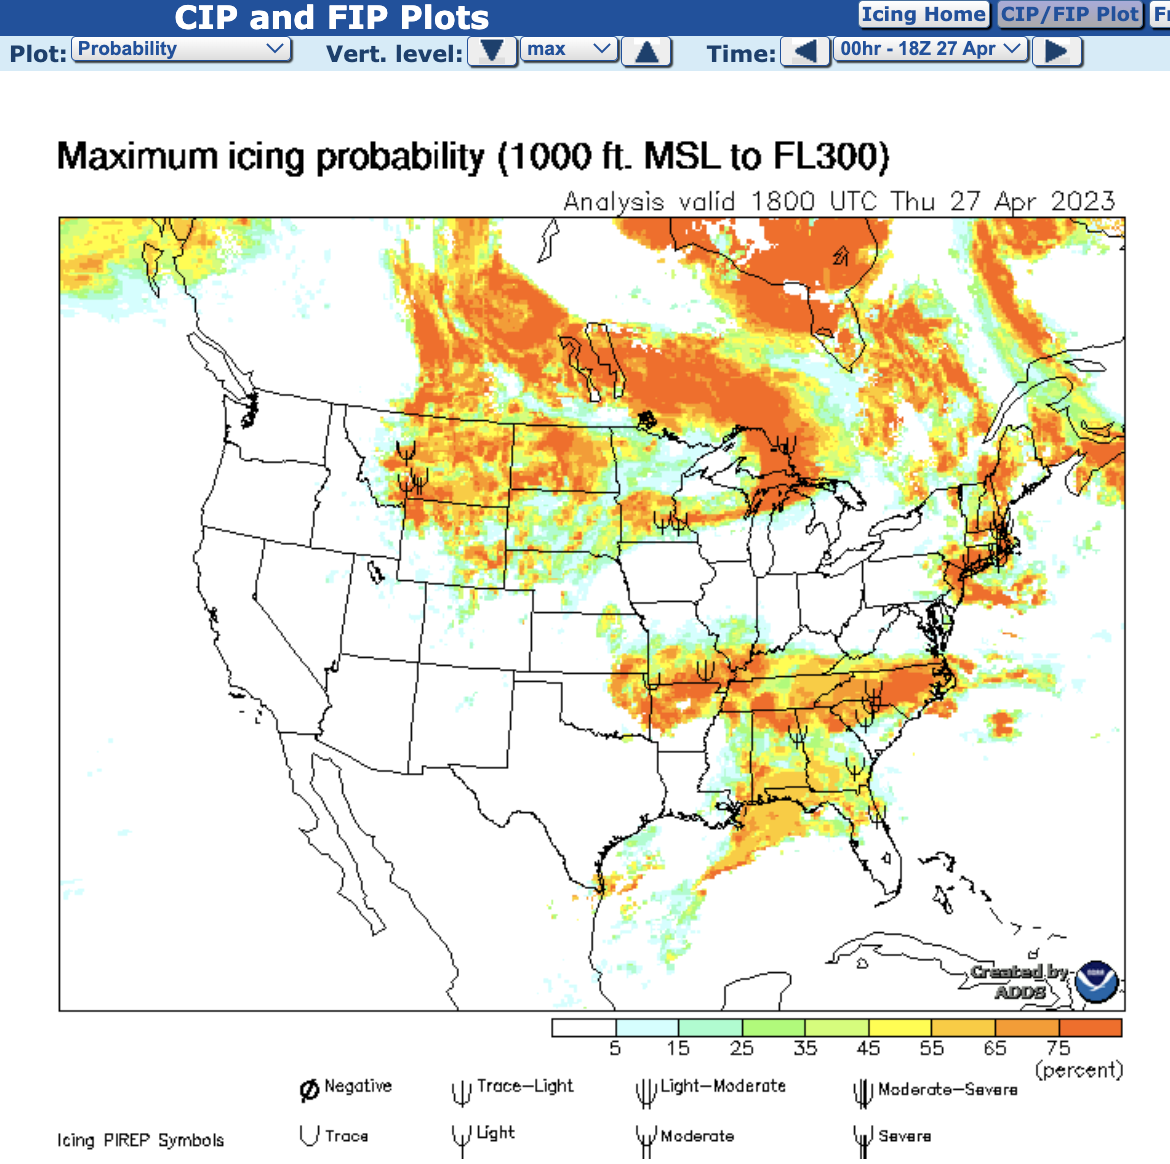
Current and Forecasts Icing Products (CIP/FIP)
- Current Icing Product (CIP) provide an hourly 3D picture of icing risks that has been predicted with sensors and numerical weather prediction (NWP) model.
- Forecast Icing Product (FIP) also uses the NWP model to predict the probabilty of icing in the future.
Current Icing Product (CIP)
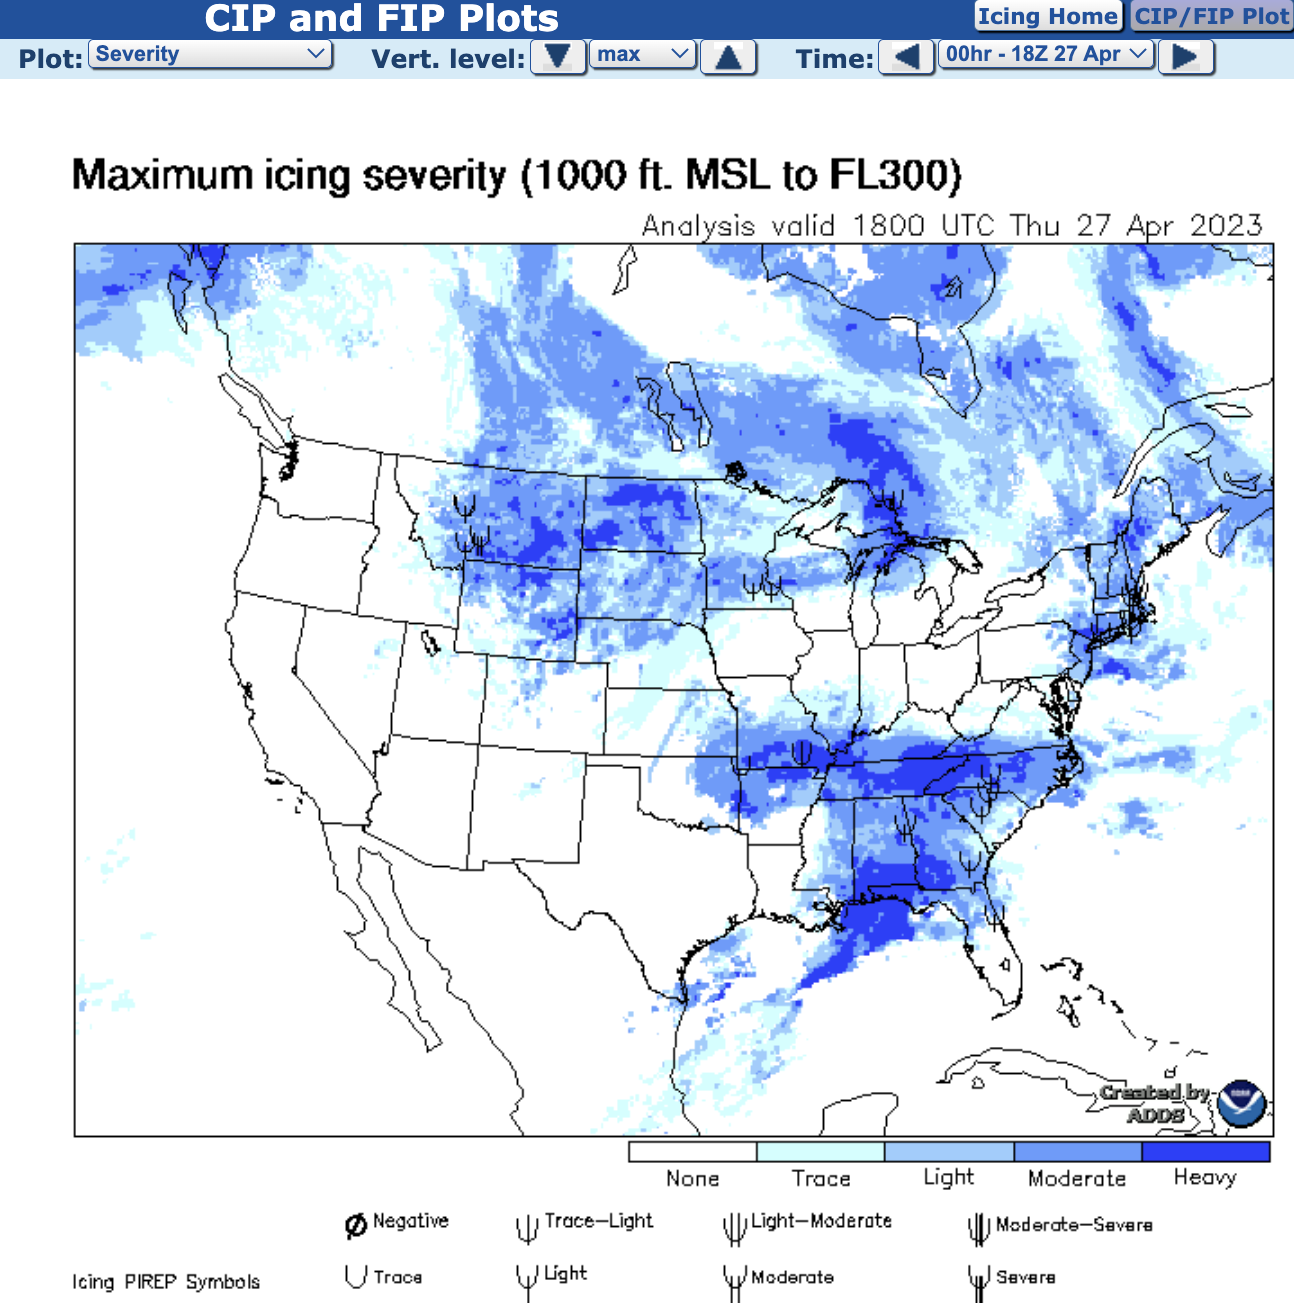
Forecast Icing Product (FIP)
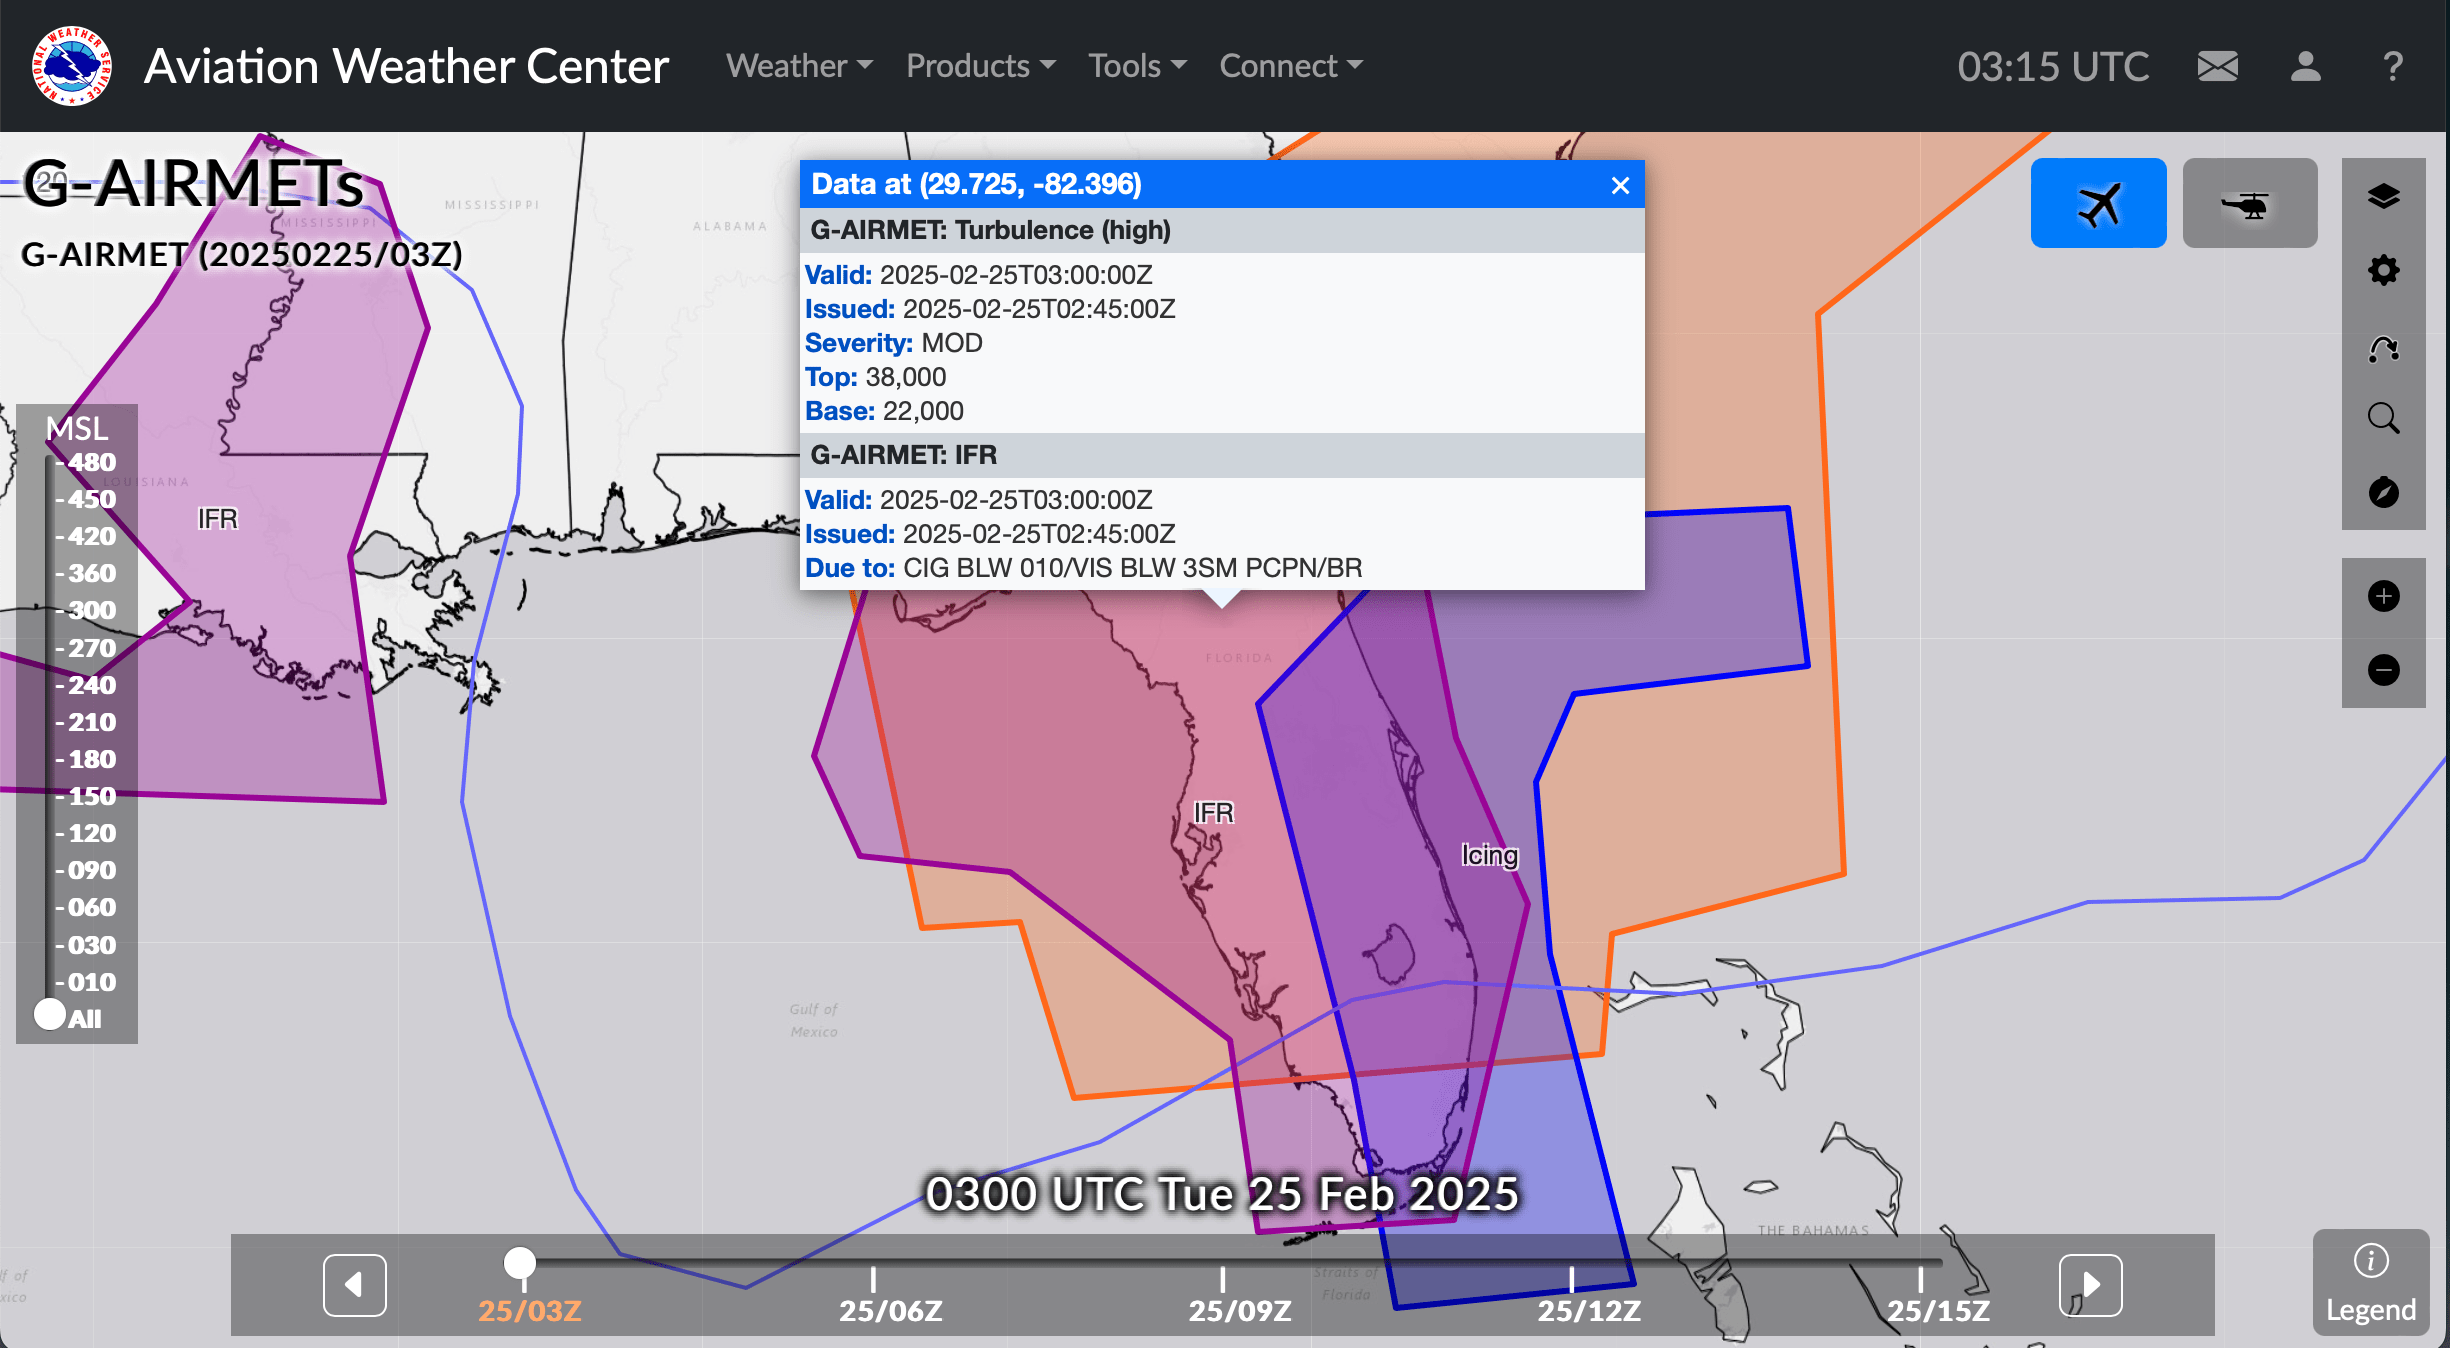
G-AIRMET
-
G-AIRMETs are graphical AIRMETs that depict hazardous weather.
- G-AIRMETs are issued at discrete times 3 hours apart for a period of up to 12 hours into the future.
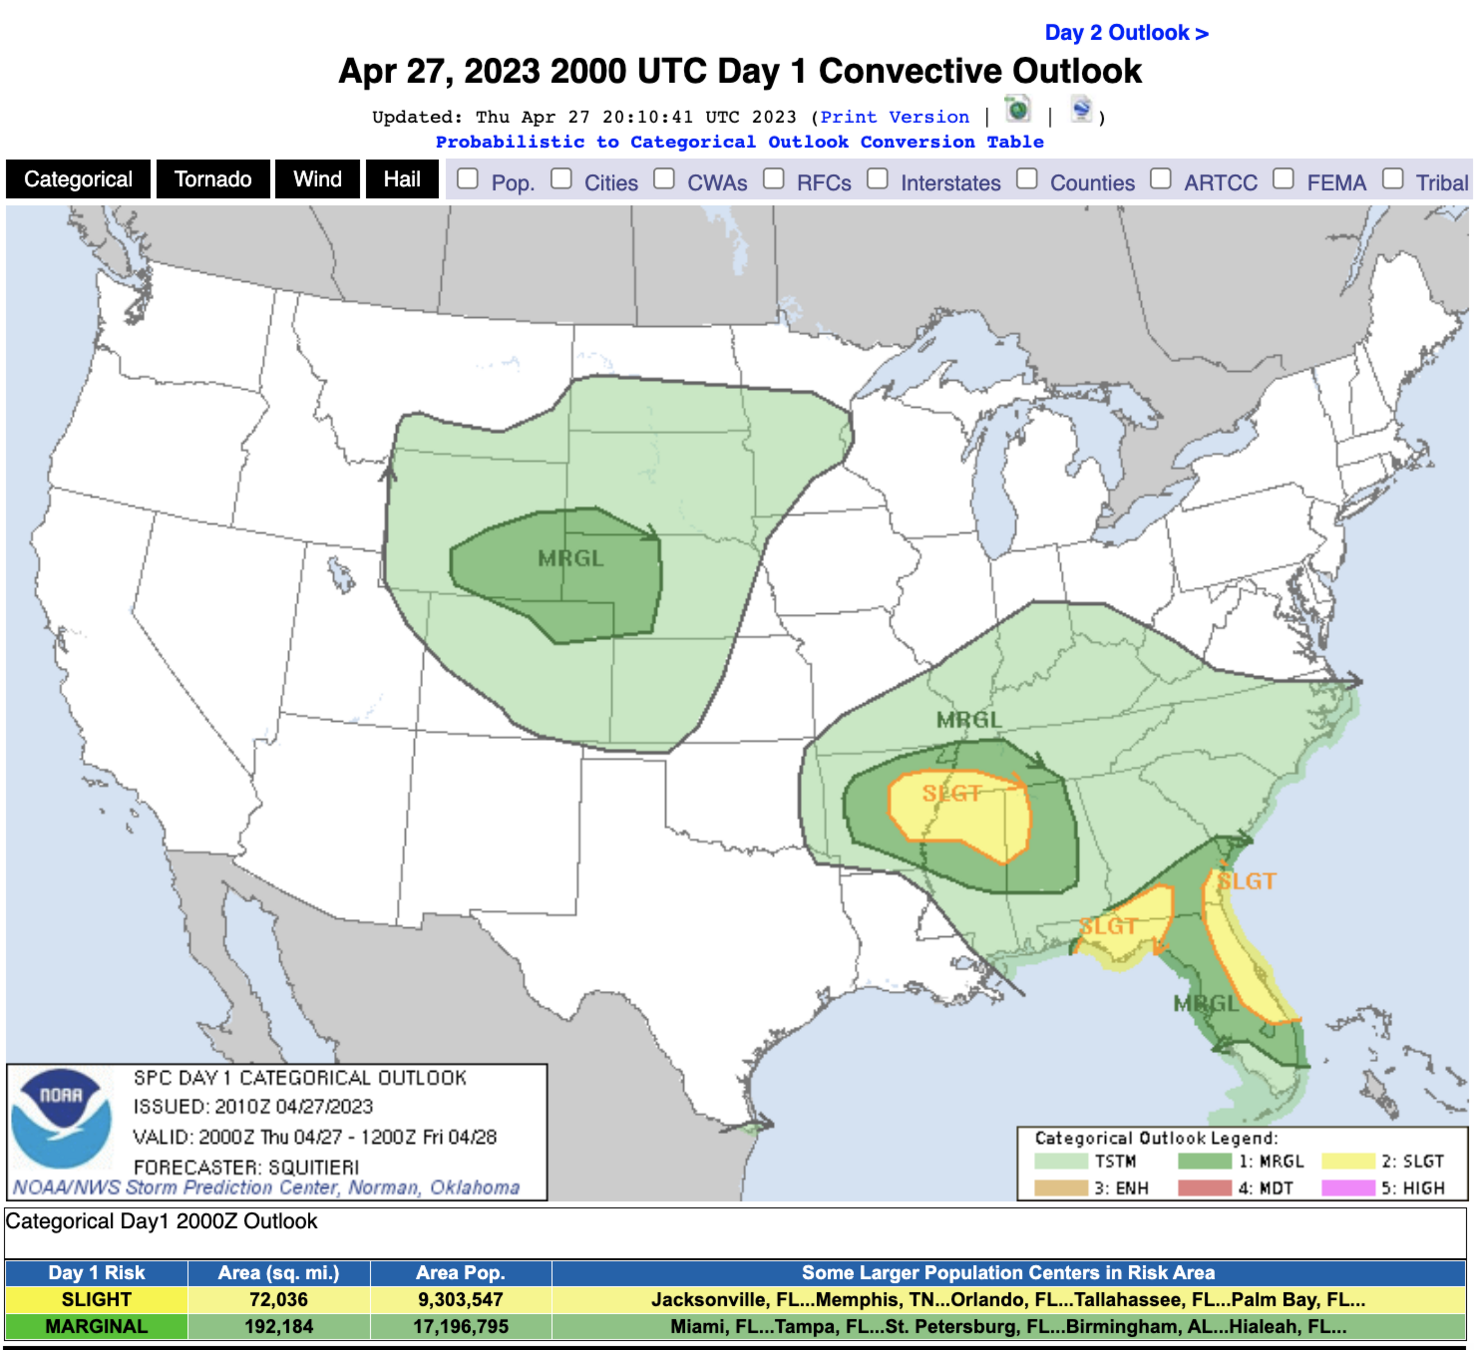
Convective Outlook Chart
- The convective outlook chart provide thunderstorm activity and intensity for the next 3 days.
- The Day 1 convective outlook is first issued at 0600Z and reissued at 1300Z, 1630Z, 2000Z, and 0100Z.
- The Day 2 chart is first issued at 0830Z standard time (0730Z daylight time) and reissued at 1730Z.
- The Day 3 forecast is issued at 1100Z.
- When facing the directions of the arrows, thunderstorms are to the right
- There are abbreviations on the chart that indicate the probability of severe thunderstorms.
- SLGT (slight risk) and MRGL (marginal risk) mean there is a low coverage during the forecast period, while MDT (moderate), ENH (enhanced), and HIGH (high) are a higher risk area.
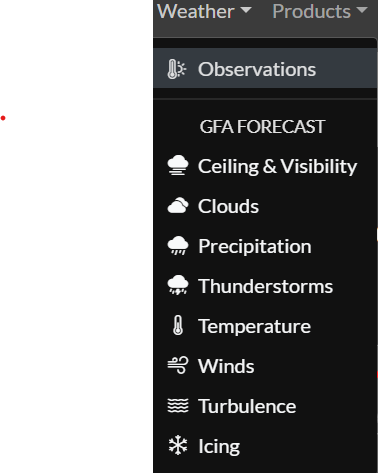
Graphical Forecast for Aviation (GFA) Tool
The GFA is a web-based tool that provides comprehensive aviation weather information for flight planning. It covers the CONUS, Gulf of Mexico, Caribbean, Atlantic, Pacific, Hawaii, and Alaska, offering a complete picture of weather conditions that may impact flights.
On the GFA Forecast, you can choose from a variety of customizable weather graphics, including:
- Ceiling and visibility
- Temperature
- Winds
- Turbulence
- Thunderstorms
- Icing
Sources of Weather Information
- As pre-flight action, gathering detailed weather information is important before conducting or planning the route.
- However, updated weather information can be used by using different in-flight sources to be aware of weather ahead of the route.
Preflight Weather Sources
-
Flight Service Station
-
Preflight Weather Briefing
- Standard Weather Briefing
- Abbreviated Briefing.
- Outlook Briefing.
- The Internet
-
Preflight Weather Briefing
Flight Service
- FSS is your primary source of preflight weather
- You can obtain a preflight weather briefing from an FSS, or a newer automated FSS (AFSS), 24 hours a day by calling the number 1-800-WX BRIEF
-
Preflight Weather Briefing:
When you contact a weather briefer, identify yourself as a pilot flying VFR and provide the briefer with your aircraft number or your name, type of aircraft, intended route, destination, and other relevant background data for the flight.
- Standard Briefing - This is the most complete weather briefing
Type of Weather Briefing
- Abbreviated Briefing - When you need only one or two specific items or would like to update weather information from a previous briefing or other weather sources, you should request an abbreviated briefing
- Outlook Briefing - If your proposed departure time is six or more hours away you should request an outlook briefing.
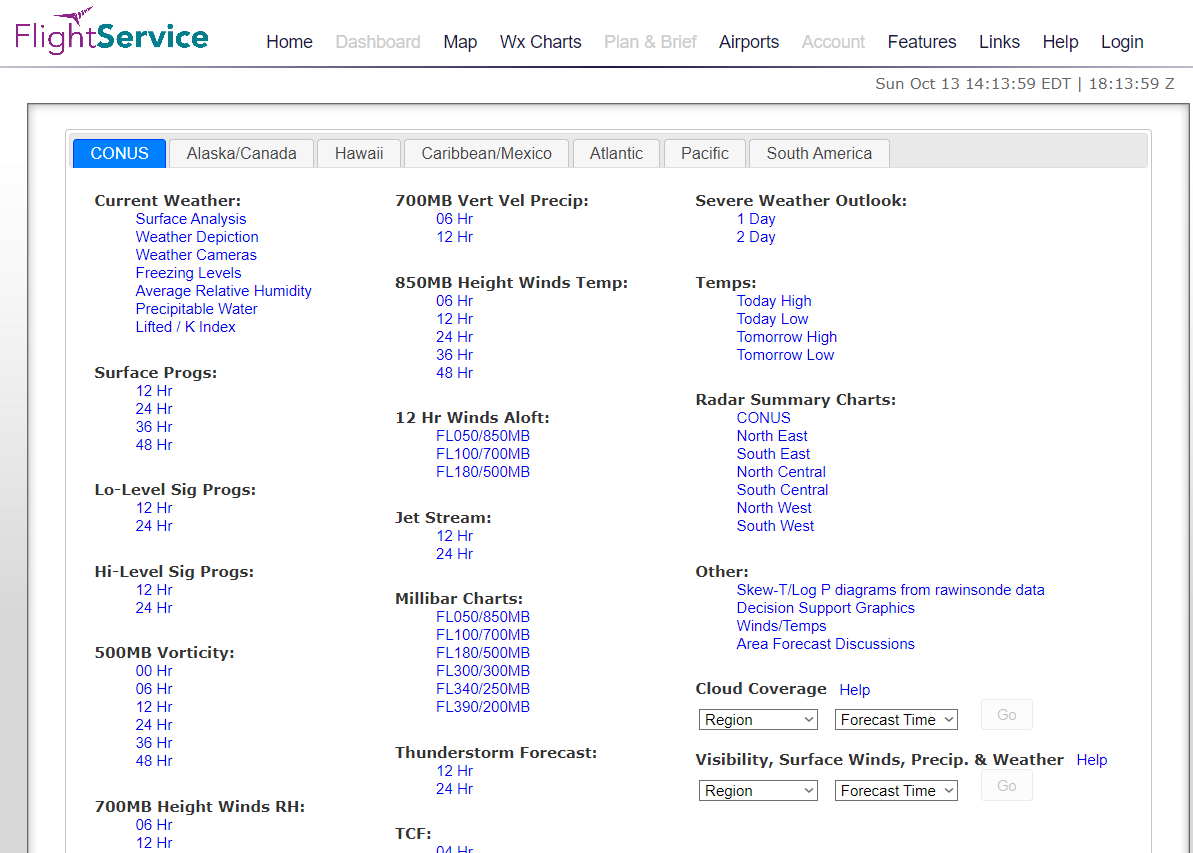
The Internet
Weather information is available on the Internet, and a number of these sites are directed towards aviation such aviationweather.gov and 1800wxbrief.com. Also, EFBs such as ForeFlight can be used for weather information.
National Weather Service
The National Weather Service (NWS) provides weather information and forecasts for aviation through a variety of services, including:
-
Aviation Weather Center (AWC)
A component of the NWS that provides weather forecasts and information for flights in the United States and some global traffic. The AWC is staffed 24/7 by meteorologists who analyze atmospheric conditions and issue forecasts and warnings. -
Terminal Aerodrome Forecasts (TAFs)
Issued by NWS Weather Forecast Offices (WFOs) for airports within their area of responsibility. TAFs are valid for 24 or 30 hours and are updated as needed. -
Center Weather Service Units (CWSUs)
NWS meteorologists are assigned to CWSUs, which are co-located with FAA Air Route Traffic Control Centers (ARTCCs). CWSUs issue products like the Center Weather Advisory (CWA), which is valid for up to two hours for conditions that meet or approach national in-flight advisory criteria.
In-flight Weather Sources
- Weather can change quickly and unexpected along the planned route.
-
You can obtain weather updates from:
- Flight Service Station
- Air Route Traffic Control Centers (ARTCC)
- Automated Weather Systems.
- FSSs are facilities that provide services to pilots like:
- Relay clearance
- VFR search and rescue services
- File flight plans
- Enroute communication
- Weather briefings
- Airspace information
- NOTAMS
- You can always call Flight service stations while in the air or over the ground via telephone.
Flight service stations (FSSs)
Flight Service Station
Hazardous in-flight weather advisory service
A program for broadcasting hazardous weather information on a continuous basis over selected VORs is called hazardous in-flight weather advisory service (HIWAS). The broadcasts include advisories such as AIRMETs, SIGMETs, convective SIGMETs, and urgent PIREPs.
Weather Radar Service
Weather radar can detect the coverage, intensity, and movement of precipitation that flight service specialists provide to pilots on their route.
Center Weather Advisory (CWA)
- Center weather advisory (CWA) is an unscheduled weather for the next 2 hours advisory issued by ARTCC.
- ARTCC will broadcast CWA, SIGMET, convective SIGMENT, and forecast weather within 150 miles of its airspace, and 50 miles in terminal areas.
- The broadcast will have information of the affected areas and weather activities.
Automated Weather Report Systems
- The FAA operates automated weather observing systems and automated weather sensor system
- The NWS operates the automated surface observing systems.
- The AWOS uses various sensors, a voice synthesizer, and a radio transmitter to provide real-time weather data.
- There are four types of AWOS.
- An AWOS-A only reports an altimeter setting while an AWOS-1 also measures and reports wind speed, direction and gusts, temperature, and dew point.
- AWOS-2 provides visibility information in addition to everything reported by an AWOS-1.
- The AWOS-3 includes cloud and ceiling data. The transmissions can usually be received within 25 NM of the site, up to 10,000 feet AGL.
Automated Weather Observation System (AWOS)
- ASOS provides continuous minute-by-minute observations.
- The ASOS measures and reports the same elements as an AWOS-3 and variable cloud height, variable visibility, rapid pressure changes, precipitation type, intensity, accumulation, and beginning and ending times.
- The ASOS is also capable of measuring wind shifts and peak winds.
- Some ASOS stations can determine the difference between liquid precipitation and frozen or freezing precipitation. If the station has this capability, it is designated as an AO2.
- Designed to be receivable up to 25 n.m. from the site and to a maximum of 10,000 feet AGL.
Automated Surface Observation System (ASOS)
Data Link Weather
- Data link weather services are included with GPS and EFB cockpits or displays, and they can be received if ADS-B is installed and has the proper transceiver.
- Data link weather services provide weather broadcasts such as METAR, TAFs, PIREPs, winds and temperature aloft, AIRMETs, SIGMETs, TFRs, and special use airspace.
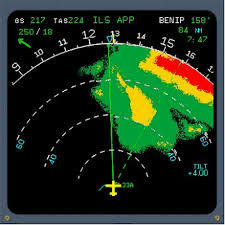
Airborne Weather Radar
- Airborne weather radar is used to provide an indication to pilots of the intensity of convective weather.
- Modern weather radars are mostly doppler radars, capable of detecting the motion of rain droplets in addition to the intensity of the precipitation.
- Typically, the radar antenna is located in the nose of the aircraft.
- A computer processes signals from the antenna and presented on a screen which may be viewed by the pilots.
- Droplet size is a good indicator of strong updrafts within cumulonimbus clouds, and associated turbulence, and is indicated on the screen by patterns, color-coded for intensity.