GL 9 Airplane Performance

Rev 12/2024
Disclaimer
Students should use their textbooks, syllabus, and Airman Certification Standards (ACS) as their primary sources of information. EcFlight is an online training tool designed to simplify and enhance your ground school learning experience. However, it is not a substitute for FAA- or school-approved study materials. Before using these slides for study, always refer to your officially approved resources, such as the Jeppesen physical or electronic book and other FAA-approved materials.
Reference Books
- Pilot's Handbook of Aeronautical Knowledge(FAA-H-8083-25B). (2016). Oklahoma City, OK: United States Department of Transportation, Federal Aviation Administration, Airman Testing Standards Branch.
- Private Pilot Syllabus (10001292-002). (2012). Englewood, CO: Jeppesen.
- Cessna. (1976). Pilot's Operating Handbook(D1057-13). Wichita, KA: Cessna.
Reference Multimedia
- https://uploads-cdn.omnicalculator.com/images/wind_correc_angle1.jpg?width=850&enlarge=0&format=webp
- https://aerocorner.com/wp-content/uploads/2019/10/sportys-e6-b-electronic-flight-computer-730x502.jpeg
- (N.d.-b). Retrieved from https://michaelsoroka.com/2014/09/23/mastering-the-mechanical-e6b-in-20-minutes/.
Index

Predicting Performance
What is Performance?
- Used to describe the effectiveness of an aircraft in its characteristic for which it was designed to perform.
- You must be able to predict the performance of your aircraft!
Aircraft Performance and Design
The primary factors most affected by performance are the takeoff and landing distance, the rate of climb, ceiling, payload, range, speed, maneuverability, stability, and fuel economy.
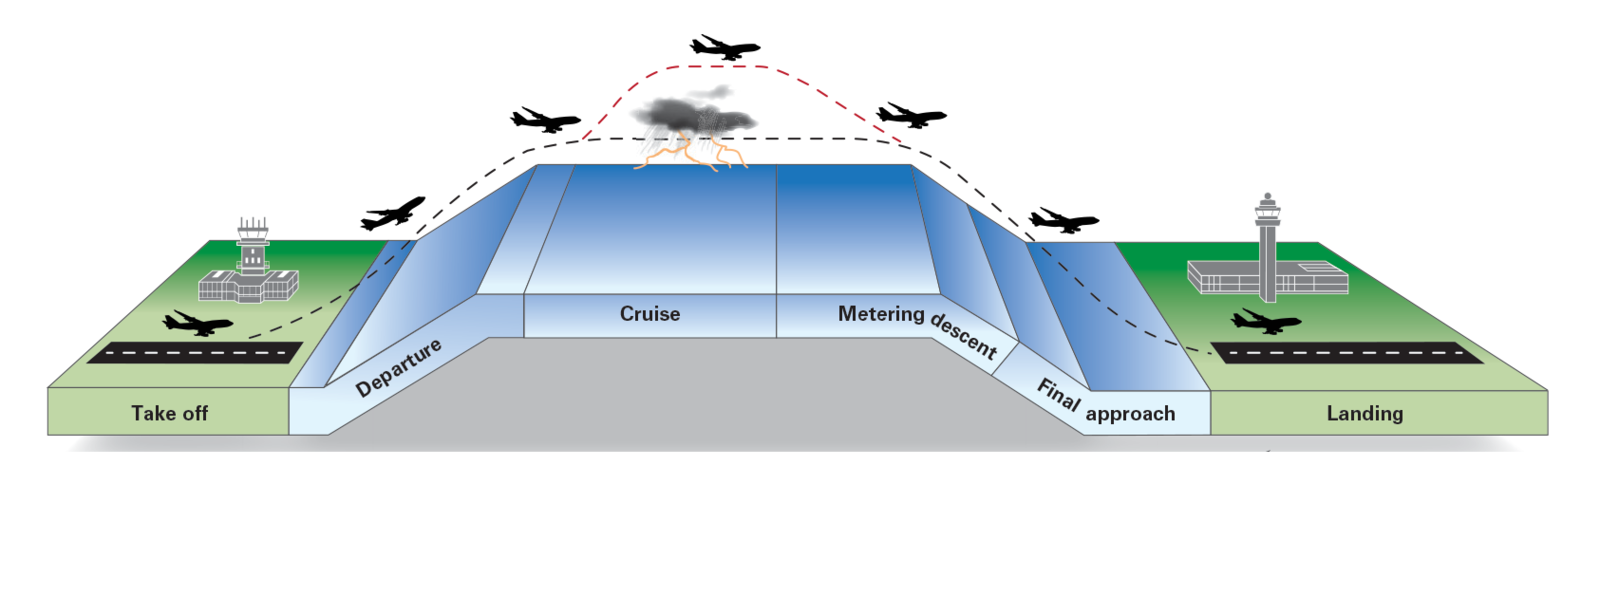
Chart Presentations
- Part of being a pilot is knowing your aircraft's limitations, and the best way to find out is through performance charts.
- Performance charts can vary significantly between different models; generally, they present their information in either table or graph format.
Table Format
-
Find the row and column that most closely match the conditions, and read the appropriate values.
- The table only provides data for a series of specified values, but you can determine values for conditions that are not shown directly by interpolation.
Interpolation is the process of finding an unknown value between two known values.
Graph Format
Since a graphic chart has more variables built into it, you must use extra care when determining performance values.
Factor Affecting Aircraft Performance
- Aircraft weight
- Atmospheric conditions
- Runway environment
- Physical laws governing the forces acting on an aircraft.
Weight
-
As weight increases:
-
Takeoff distances
- Increase
-
Cruise speeds
- Decrease
-
Fuel Economy
- Is reduced
-
Landing distance
- Increase
-
Takeoff distances
Remember
- Any increase in weight results in a needed increase in lift, thus less thrust available
Winds
-
Increase takeoff/landing performance
-
Shorter ground roll
-
Increase performance
-
Decrease Range
Headwind
Tailwind
-
Decrease Takeoff/landing performance
-
Longer ground roll
- Decrease PerformanceIncrease Range
Aircraft performance diminishes with altitude, it follows that decreases in air density.
Also:
- Temperature
- Pressure
- Humidity
Will affect the performance.
For example, when the air is less dense, wings must move through the air faster to develop enough lift for takeoff, resulting in a longer takeoff roll. Lower air density also reduces engine power, since the engine must take in a larger volume of air to get enough air molecules for combustion.
Air Density
-
Air Density can be affected in three ways
-
Change in Pressure (Pressure Altitude)
-
Change in Temperature (Density Altitude)
-
Change in Humidity
-
-
As Air Density decreases (the result of climbing)
- The engine cannot take in as much air for combustion
- The propeller cannot grab as much air for thrust
- Airfoils are less effective and must be accelerated to higher True Airspeed’s (TAS)

Density Altitude
-
The density of the air influences the performance of the airplane, lift, as well as the ability of the engine to produce power.
-
Density altitude is pressure altitude corrected for nonstandard temperature.
-
As density altitude decreases, aircraft performance increases.
- The aerodynamic performance in a nonstandard atmosphere is affected by density altitude.
-
To calculate Density Altitude, use the following
- E-6B
- Performance Charts
- Electronic Flight Computer
Calculating Pressure and Density Altitude
Runway Conditions
Runway Gradient and surface
- The runway gradient, or slope, refers to the amount of change in runway height over its length. The gradient is usually expressed as a percentage.
- For example, a gradient of 2% means the runway height changes 2 feet for each 100 feet of runway length (100 × 2% = 2).
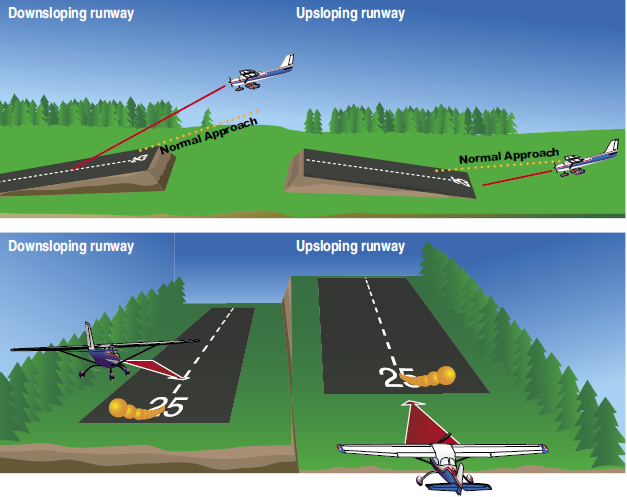
Runway Slope
-
Up-sloping Runway
- Increase takeoff distance
- Decrease landing distance
-
Down-sloping Runway
- Decrease takeoff distance
- Increase landing distance
-
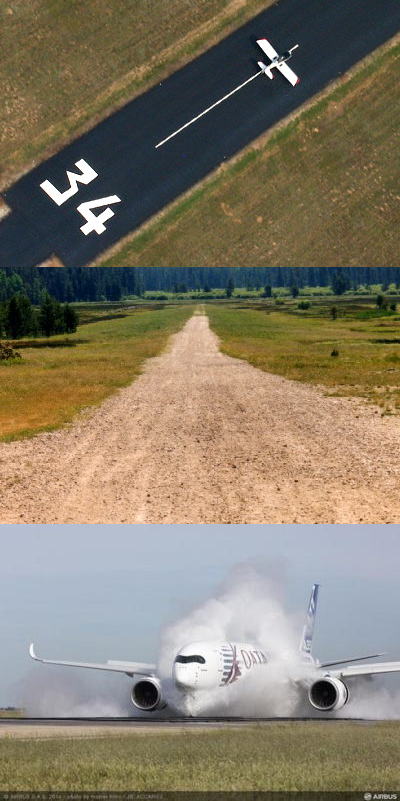
Dry, Paved Runway – Standard for Performance Determination
-
Grass Runways
-
Increase takeoff distance
-
Increase landing distance
-
-
Gravel Runways
- No effect on takeoff distance
- Increase landing distance
-
Wet Runways
- No effect on takeoff distance
- Increase landing distance
- Hydroplane hazard
Aircraft Weight and Configuation
- To generate sufficient lift for flight, a heavily loaded airplane must accelerate to a higher speed than the same airplane with a light load.
- Stall speed is also affected by weight, approach and landing speeds will be higher in a heavily loaded airplane.
Surface Winds
- Takeoff and landing distances are influenced by both the speed and direction of surface winds.
- Headwind component - Portion of the wind which acts straight down the runway toward the airplane.
- Crosswind component - Portion of the wind which acts perpendicular to the runway.
- Tailwind component - is the portion of the wind which acts directly on the tail of the airplane.
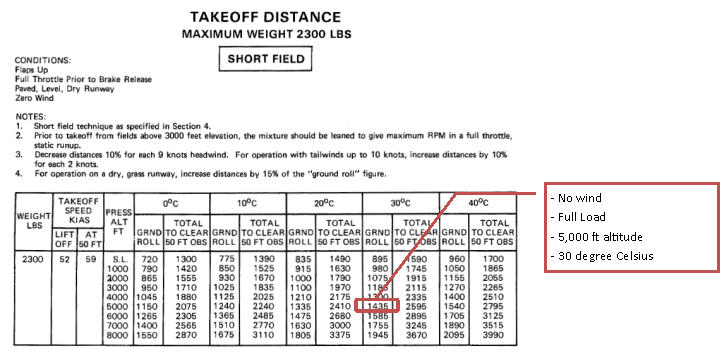
Takeoff and Landing Performance
Takeoff Charts
- Depends on several factors you can measure or calculate in advance, such as aircraft weight, wind, and runway conditions.
- High-density altitude will reduce aircraft takeoff performance.
Move horizontally to the reference line, then diagonally to the line for total weight.
1
2
Enter the graph at the correct ourtside air temperature.
Go up to the diagonal line for the pressure altitude
3
Follow the horizontal line to the next reference line and apply the correction for wind.
Go horizontally to the line for the take off distance.
4
5
Graph Method
Landing Distance Charts
Landing performance charts show the total distance required to clear a 50-foot obstacle. In addition, some provide estimates of ground roll distance prior to liftoff.
This takeoff distance chart suggests a 45% increase in the ground roll for takeoff from a dry, grass runway.
Calculating Takeoff and Landing Distance
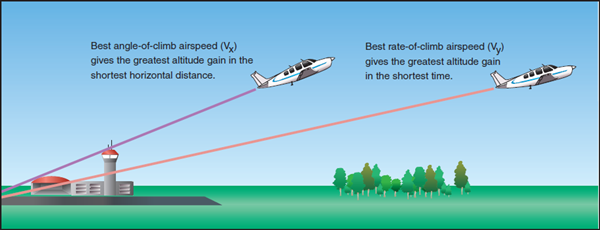
Climb Performance
-
Best Angle of Climb (VX):
- It provides the greatest gain in altitude in the shortest distance during climb after takeoff.
-
Best Rate of Climb (VY)
- It provides the greatest gain in altitude over a period of time.
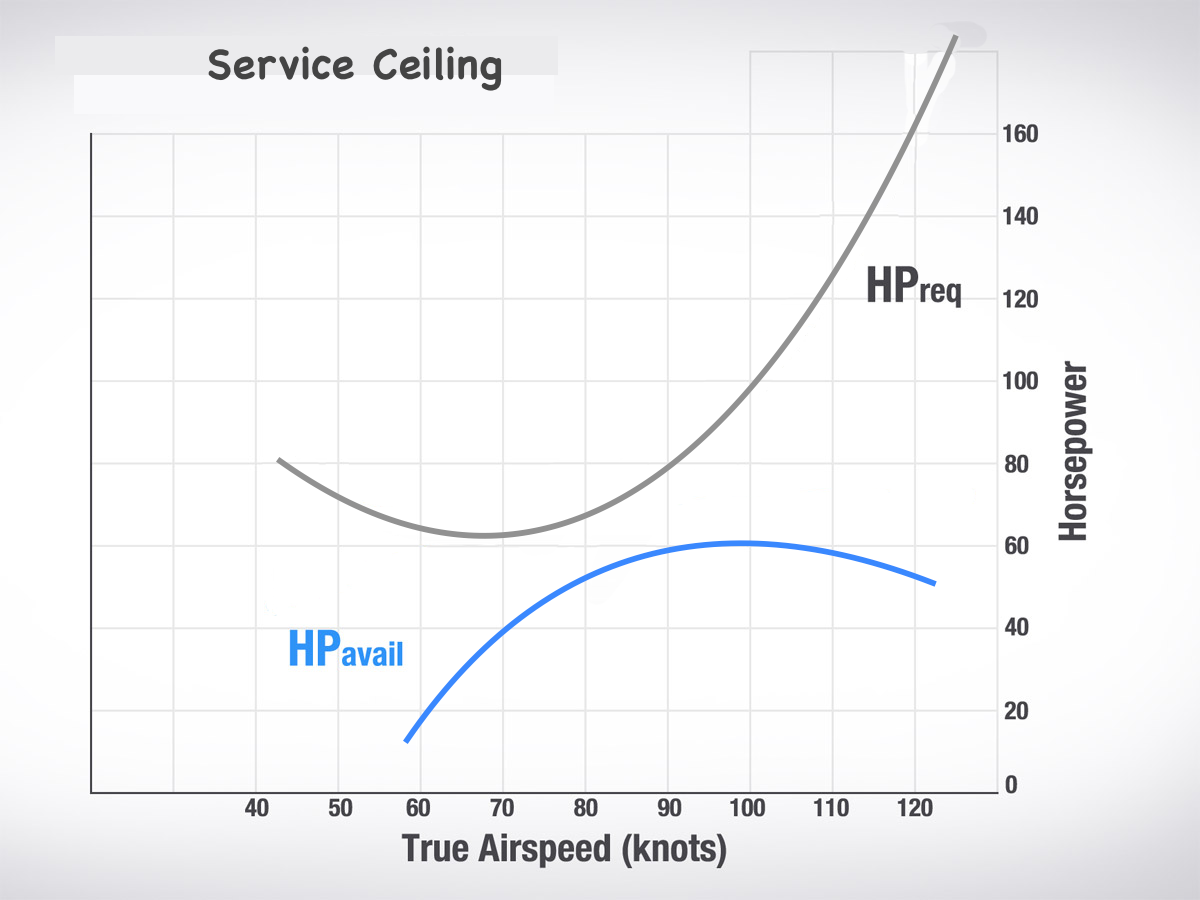
- Service Ceiling - Refers to the altitude where a single-engine airplane is able to maintain a maximum climb of only 100 feet per minute.
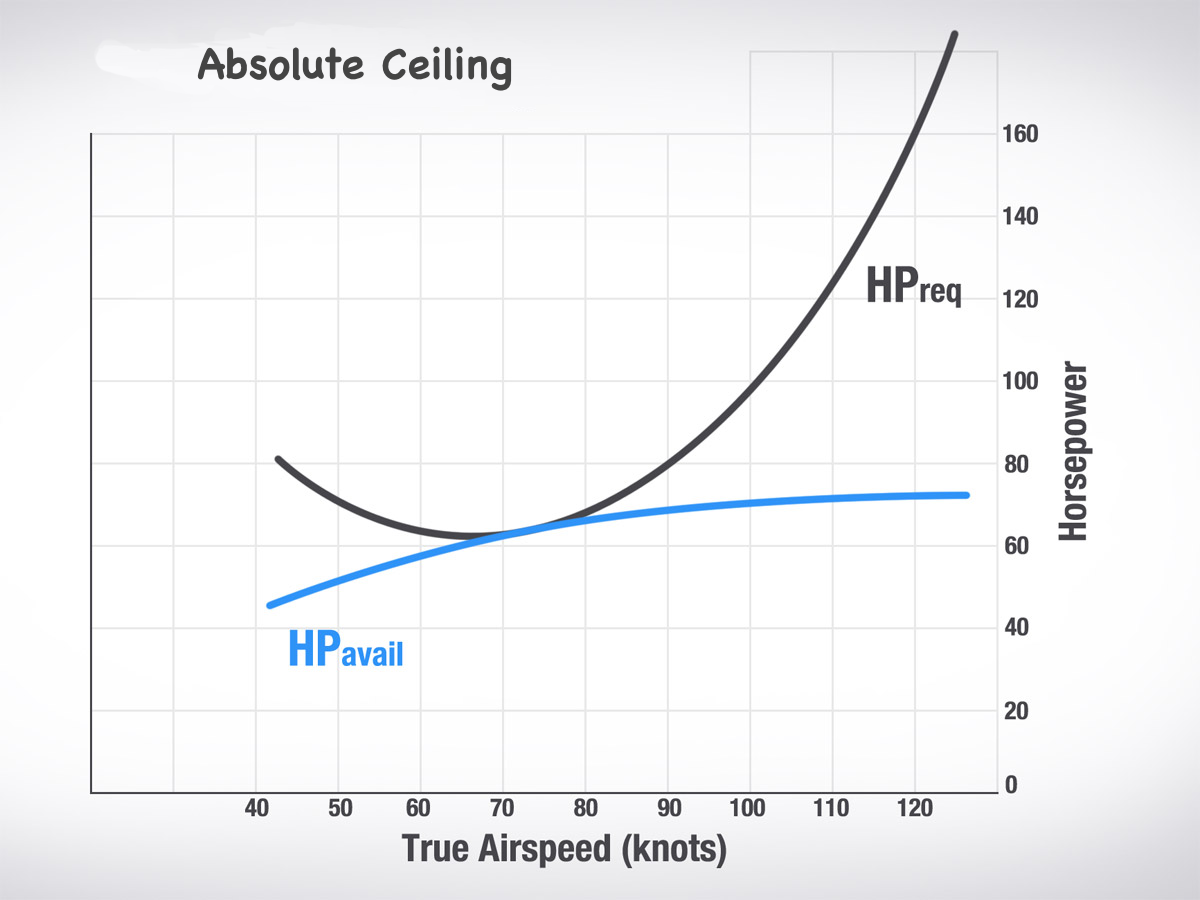
- Absolute Ceiling - When the airplane is unable to climb any further.
A high density altitude decreases engine performance, aerodynamic lift, and propeller efficiency with a resulting reduction in climb performance.
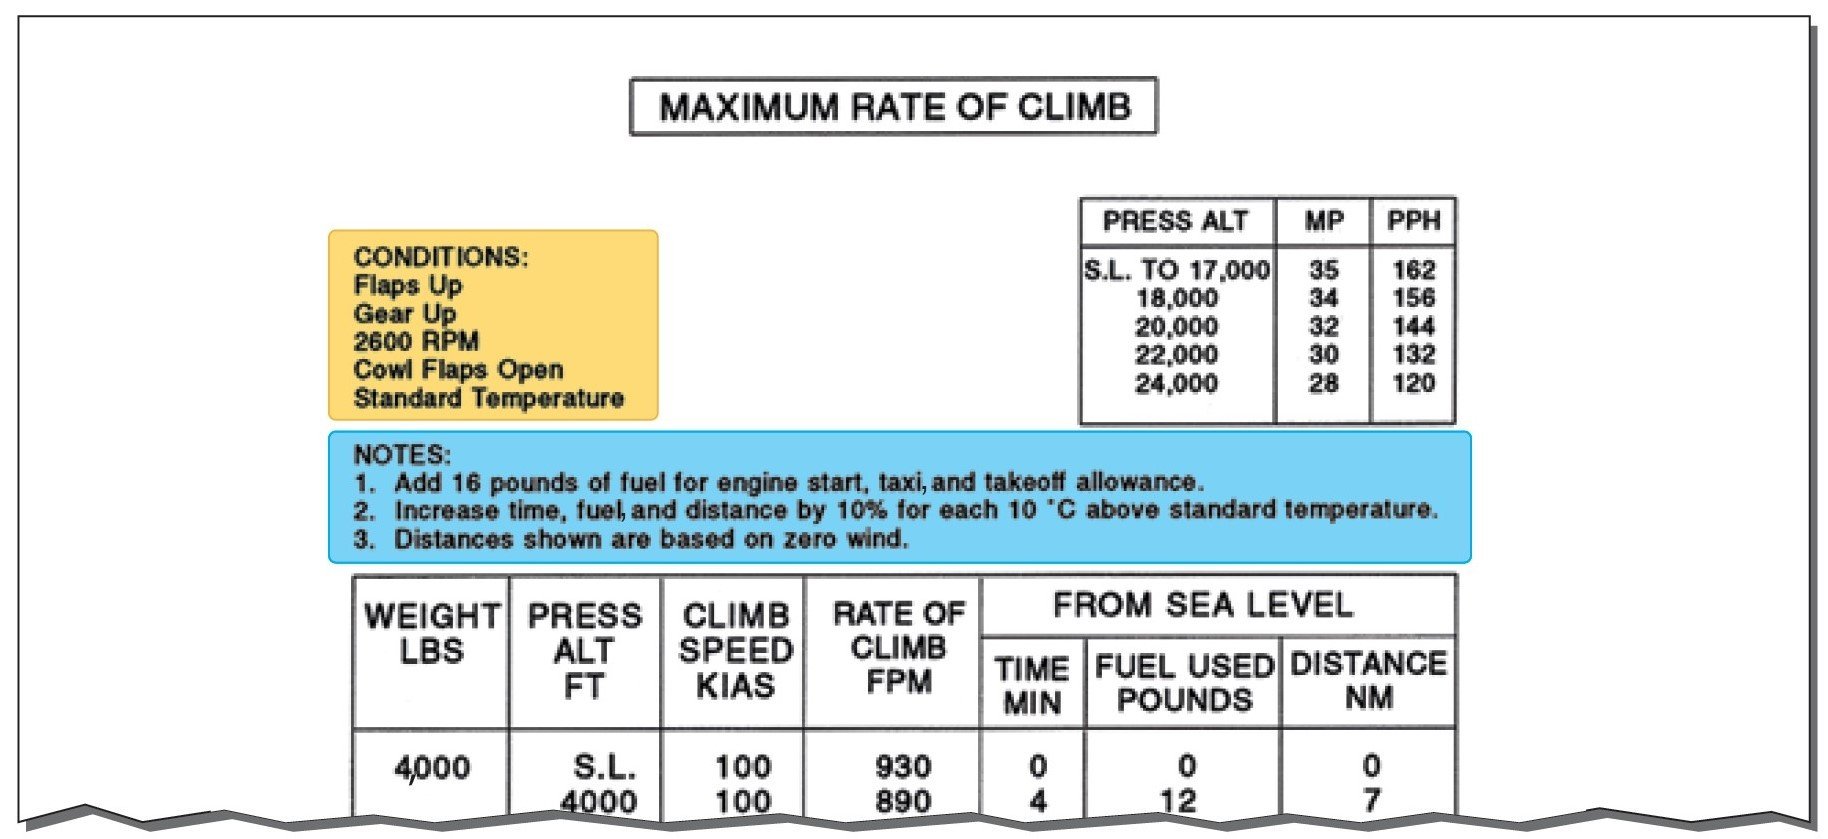
Graph Method
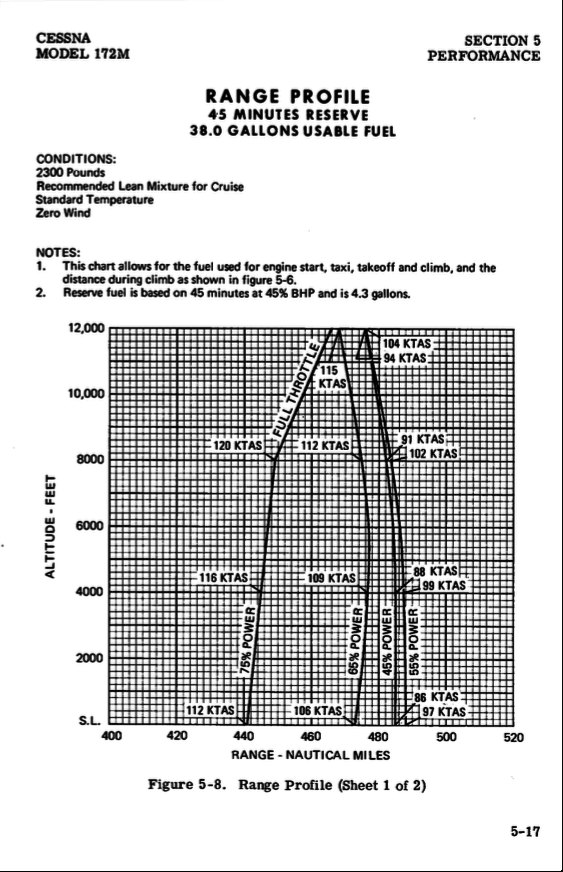
Cruise Performance
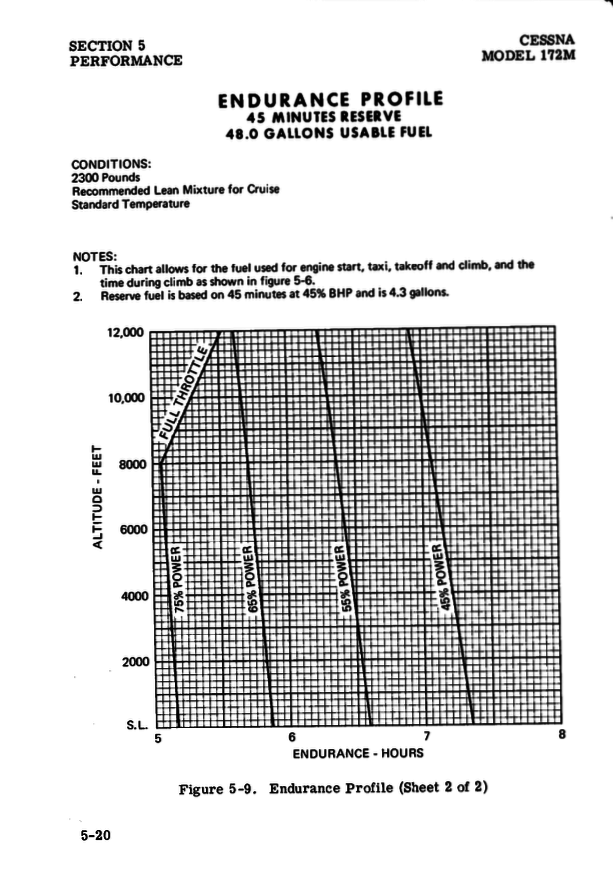
- Cruise performance charts to indicate the rate of fuel consumption, true airspeed, range, and endurance.
- They will give you a close approximation of the performance you can expect at different altitudes and power settings.
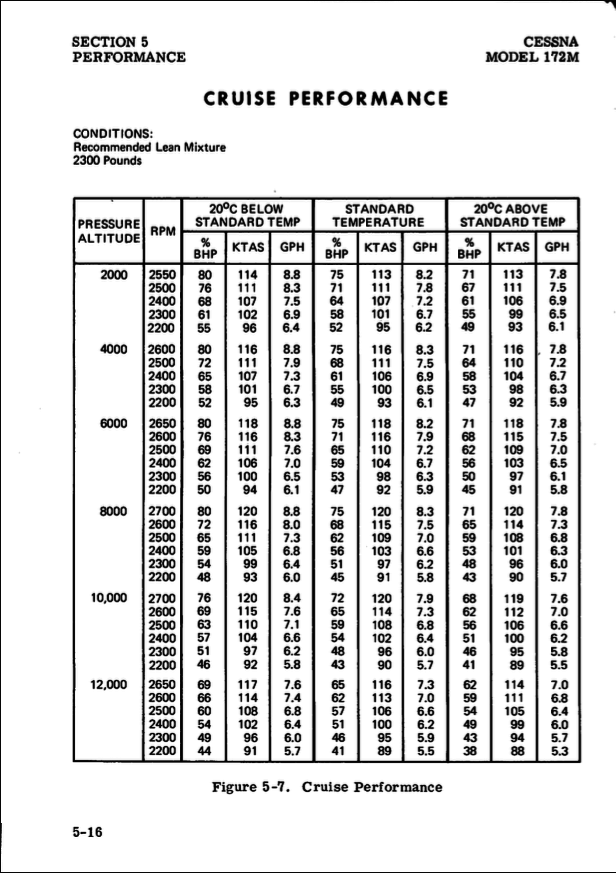
- Cruise performance tables are also used to calculate manifold pressure, fuel flow, fuel consumption, and true airspeed.
- In selecting your cruising speed, you usually want to cover the distance to be traveled in the shortest period of time
Performance Speeds
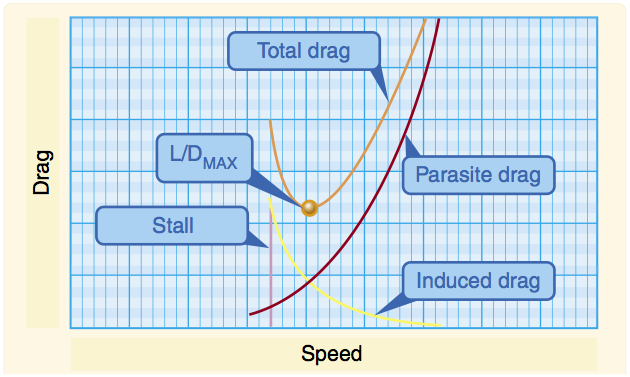
- When the force of total drag equals the force of full thrust, the airplane is flying at its maximum level flight speed.
- The maximum range speed lets you travel the greatest distance for a given amount of fuel.
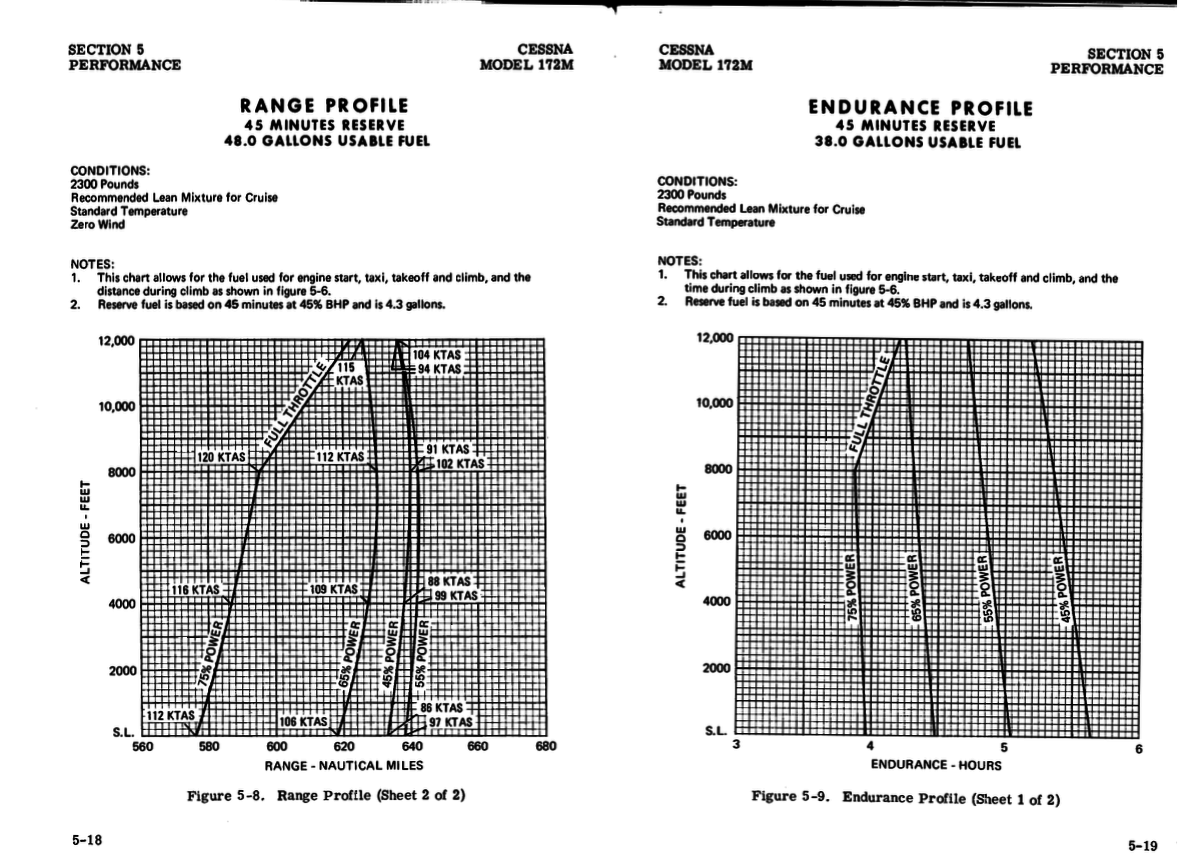
- The speed and power setting which allows the airplane to remain aloft for the longest possible time is called the maximum endurance speed.
Cruise Performance Charts
Cruise performance tables are used to calculate manifold pressure, fuel flow, fuel consumption, and true airspeed.
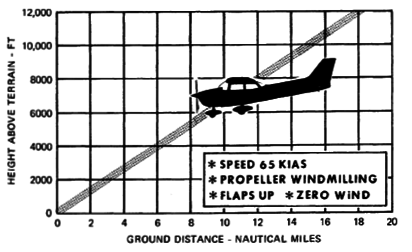
Glide Distance
- In the event of an engine failure, the pilot will fly at the minimum glide angle so he/she can travel the maximum distance for the altitude available.
- The best glide performance is at the maximum lift-to-drag ratio, or L/Dmax.
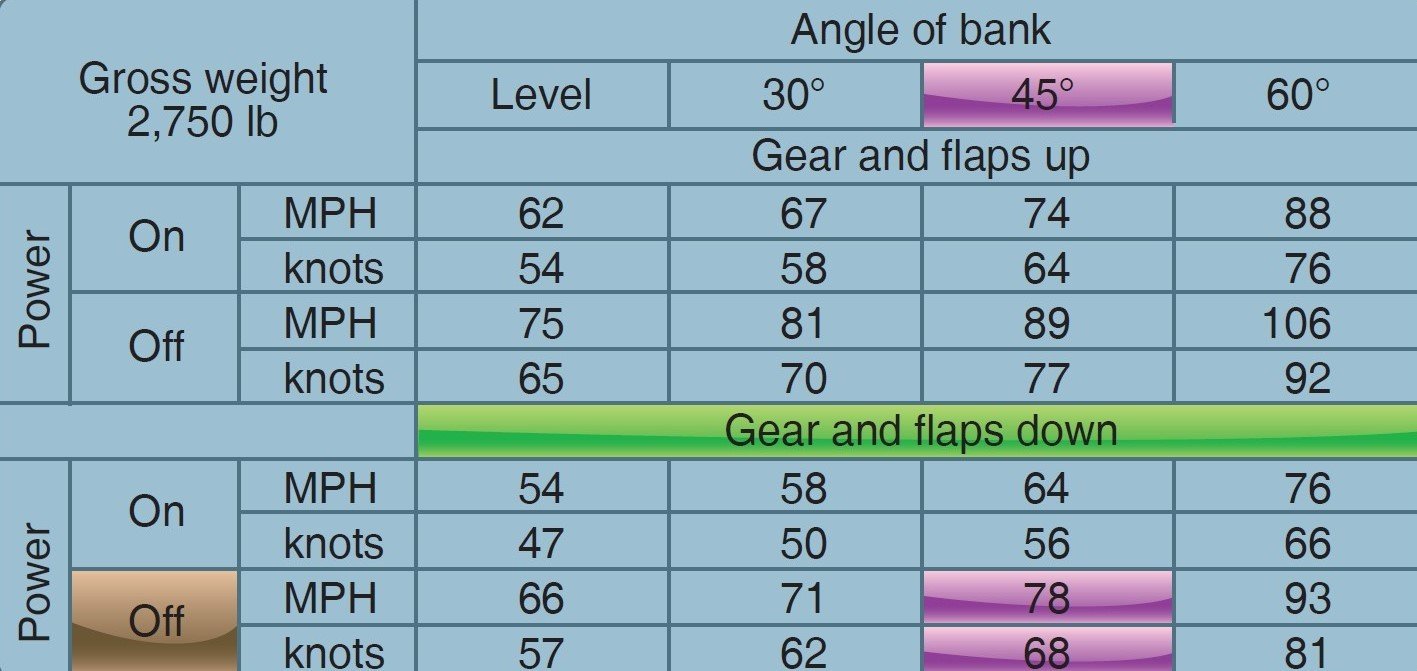
Stall Speeds
- Stall speed performance charts are designed to give an understanding of the speed at which the aircraft stalls in a given configuration.
- This type of chart takes into account the angle of bank, the position of the gear and flaps, and the throttle position.
Sample Problem
Power........................... OFF
Flaps......................... Down
Gear.......................... Down
Angle of Bank..................45°
1
3
2
Locate the correct flap and gear configuration.
Choose the row corresponding to a power-off situation.
Find the correct angle of bank column, which is 45°. The stall speed is 78 mph, and the stall speed in knots would be 68 knots.
1
2
3
3
Importance of Weight
Almost every aspect of performance is influenced by weight.
An overweight aircraft has:
- Longer takeoff run
- Longer landing roll
- Reduced angle and rate of climb
- Reduced cruising speed
- Shorter range
- Higher stall speed
Importance of Balance
-
It’s not just a matter of how much you put into the plane, but where you put it.
- You can check the balance condition locating its center of gravity (CG), which is the imaginary point where the aircraft would balance if suspended.
Weight and Balance Terms
The pilot should be familiar with terms used in working problems related to weight and balance.

-
Arm - The horizontal distance in inches from the reference datum line to where a load is placed (stations).
-
Basic empty weight - The standard empty weight plus the weight of equipment that has been installed.
- Standard empty weight - Aircraft weight that consists of the airframe, engines, and all items of operating equipment, hydraulic fluid, unusable fuel, and full engine oil.
-
Licensed empty weight - The empty weight that consists of the airframe, engine(s), unusable fuel, and undrainable oil, plus standard and optional equipment as specified in the equipment list.
-
Center of gravity (CG) - The point about which an aircraft would balance if it were possible to suspend it at that point.
-
Moment - the product of the weight of an item multiplied by its arm.
-
Datum - An imaginary vertical plane or line from which all measurements of arm are taken.
-
Maximum landing weight - the greatest weight that an aircraft normally is allowed to have at landing.
- Maximum takeoff weight -the maximum allowable weight for takeoff.
-
Maximum weight - The maximum authorized weight of the aircraft.
-
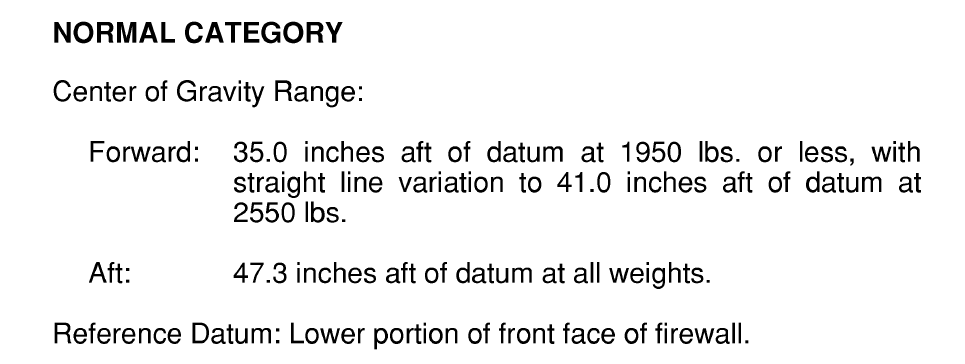
CG limits - The specified forward and aft points within which the CG must be located during flight.
- CG range - The distance between the forward and aft CG limits indicated on pertinent aircraft specifications.
-
Payload - The weight of occupants, cargo, and baggage.
- Useful load - The weight of the pilot, copilot, passengers, baggage, usable fuel, and drainable oil.
Principles of Weight and Balance
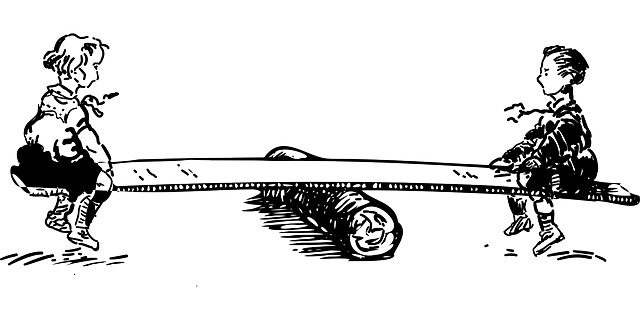
This principle can be demonstrated with a seesaw.
The seesaw is balanced when children who weight the same amount sit an equal distance from the fulcrum.
Weight and Balance Computations
- To determine if the airplane's weight and CG are within allowable limits, there are certain computations that must be made.
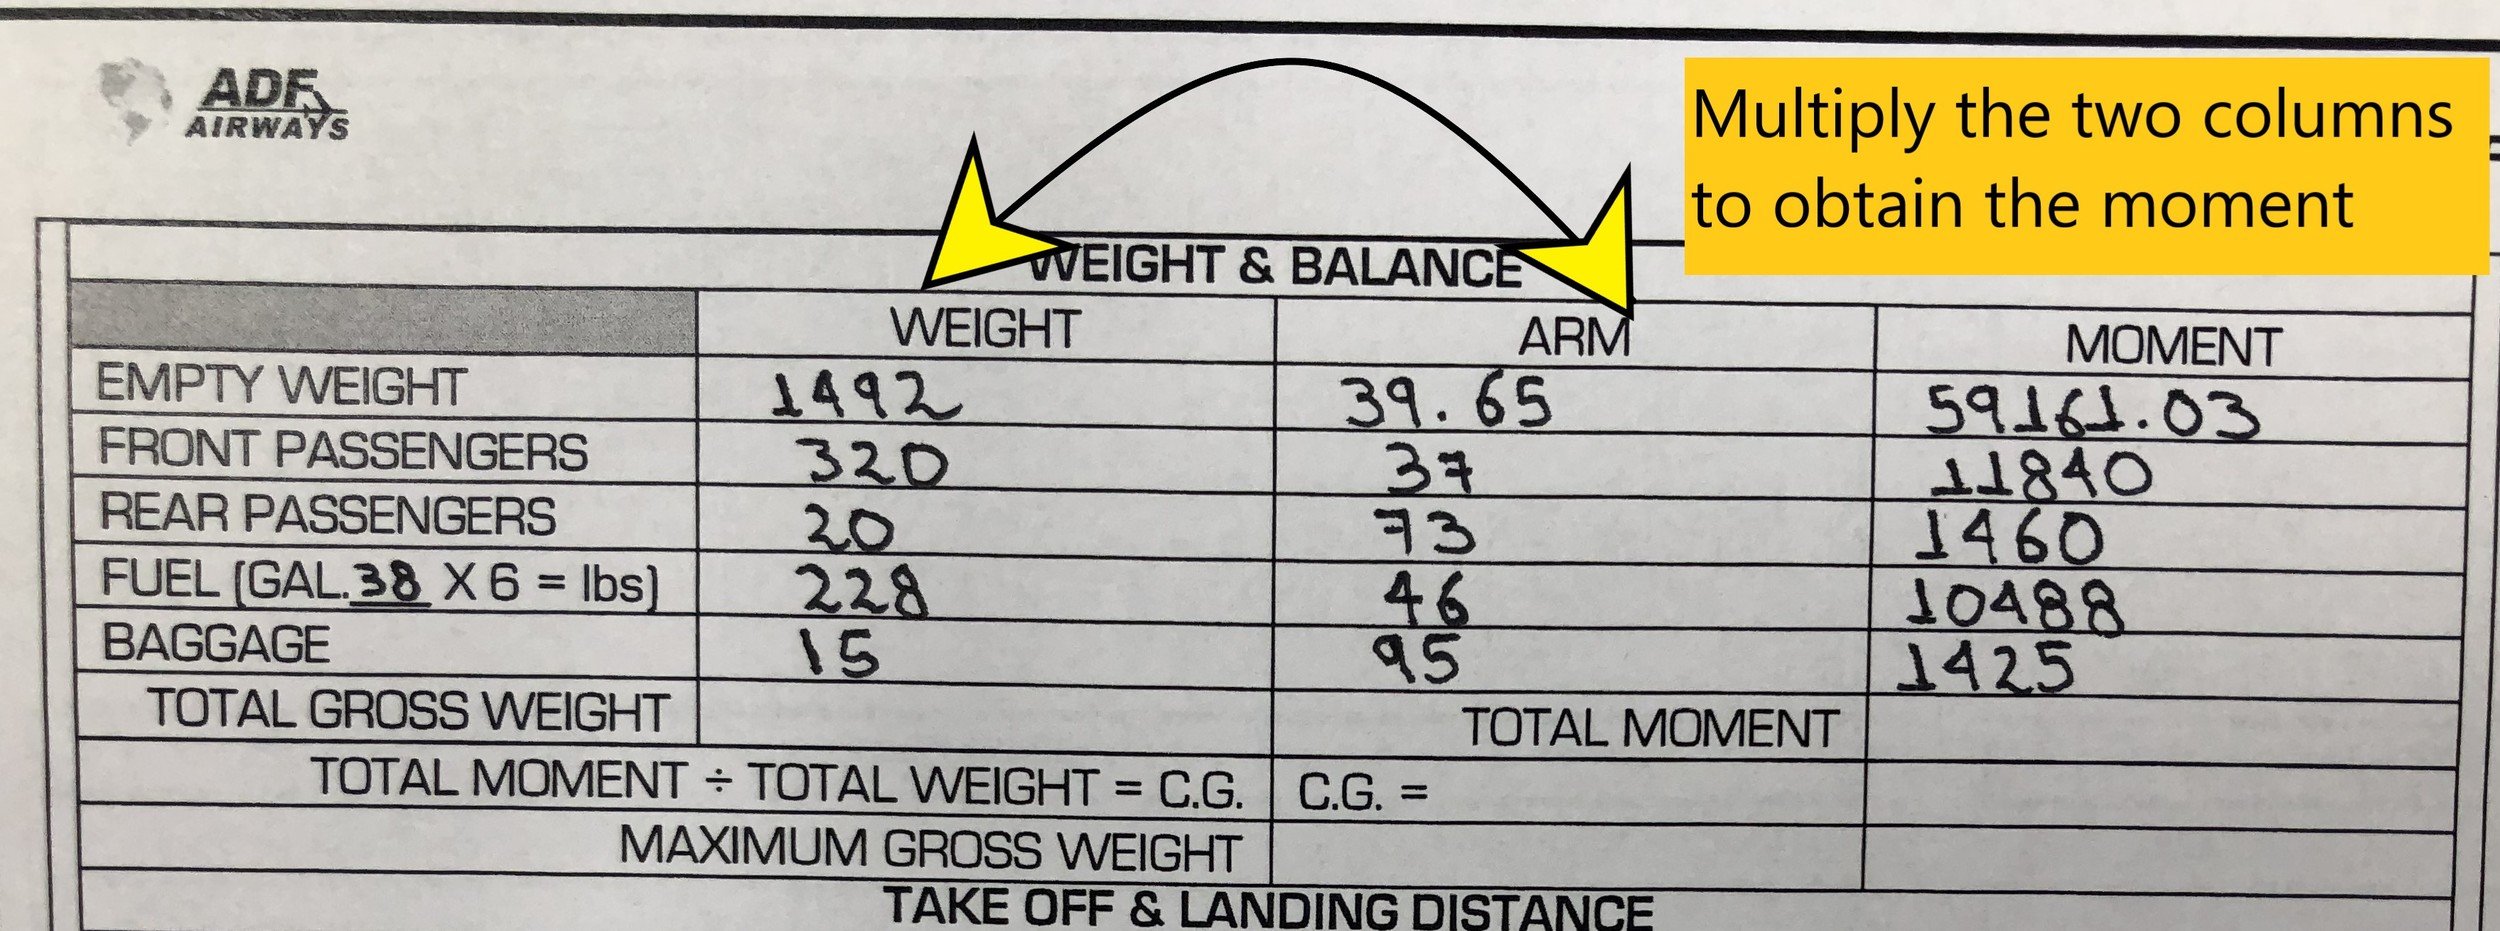
- Moment Computations: To determine the moment produced by each zone in the airplane, multiply its WEIGHT by the ARM
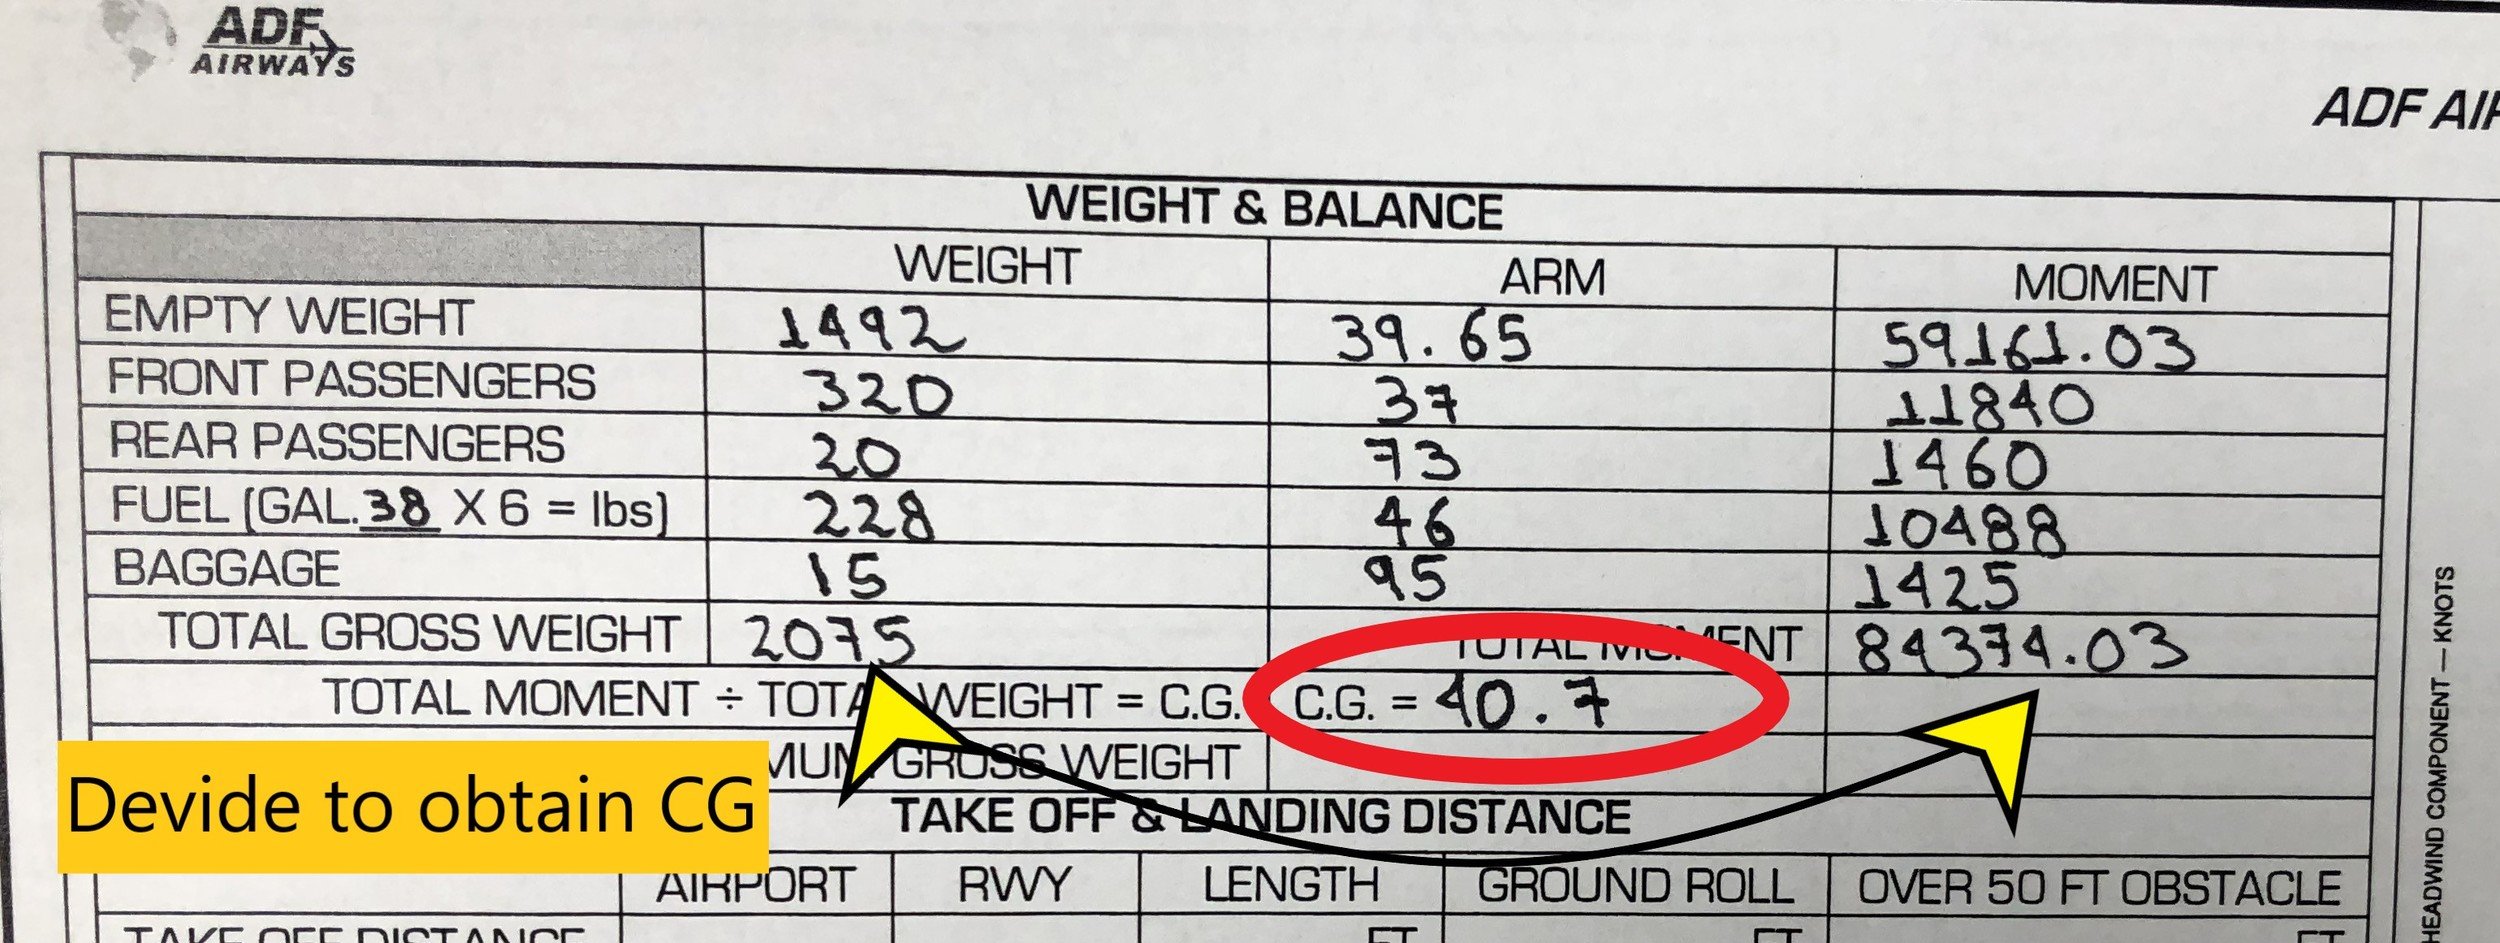
- Center of Gravity Position: To determine the CG of the aircraft, divide the TOTAL MOMENT obtained by the TOTAL GROSS WEIGHT of the airplane.
Determining Total Weight and Center of Gravity
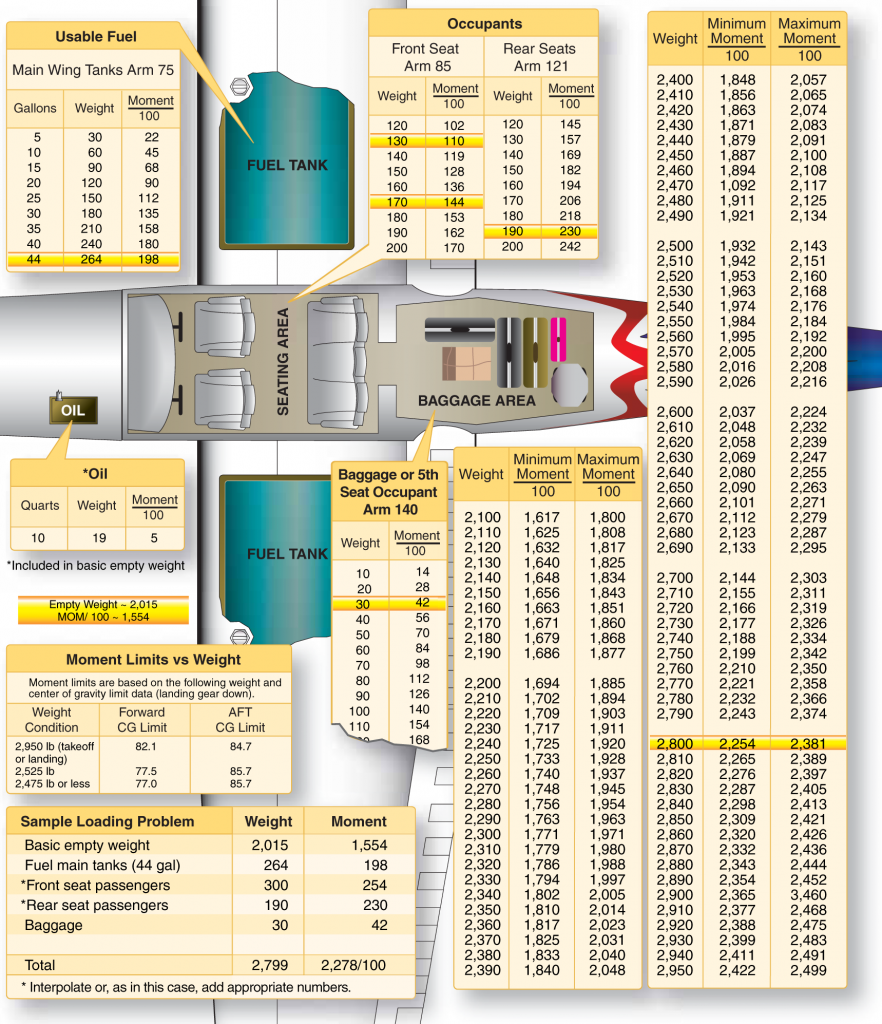
There are various methods for determining the loaded weight and CG of an aircraft. There is the computational method, as well as methods that utilize graphs and tables provided by the aircraft manufacturer.
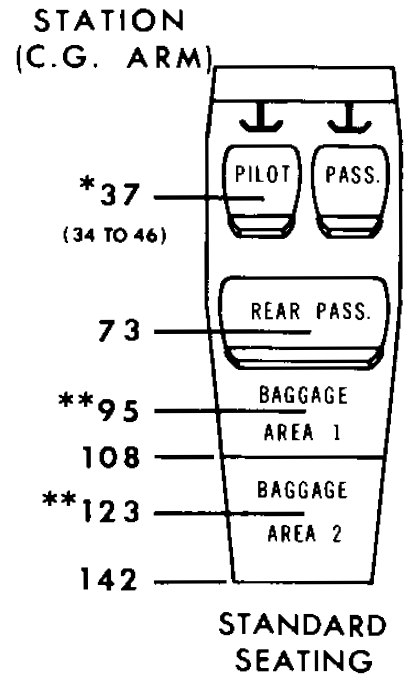
Computation Method
- The computation method requires the pilot to become familiar with the weights that will be loaded in the airplane. He will also need to figure out the arms to the respective station as shown in the images below.
Step 1
C 172 SP
C 172 M
Step Two
- The weights should be entered in the left column of the respective chart and multiplied by the arms to obtain the moment in each of the stations.
C 172 M and SP
Step Three
- Divide the total moment by the total weight to obtain the airplane's CG location. (The CG represents the distance in inches to the REFERENCE DATUM).
C 172 M and SP
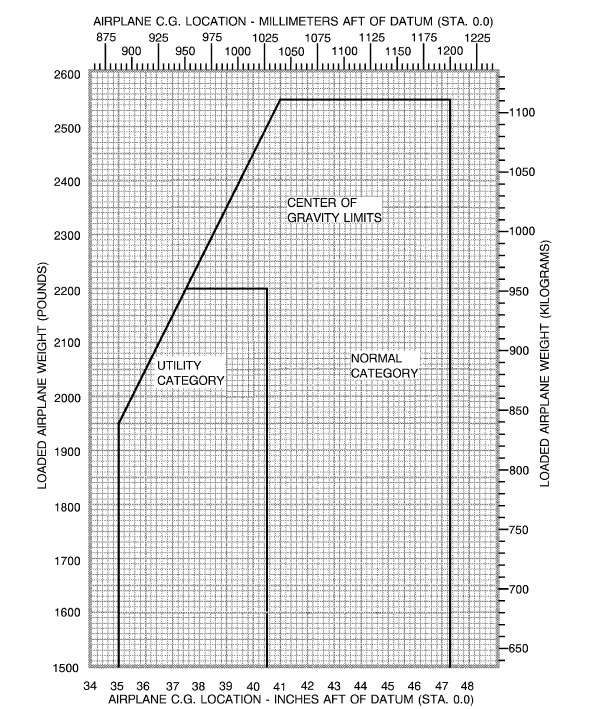
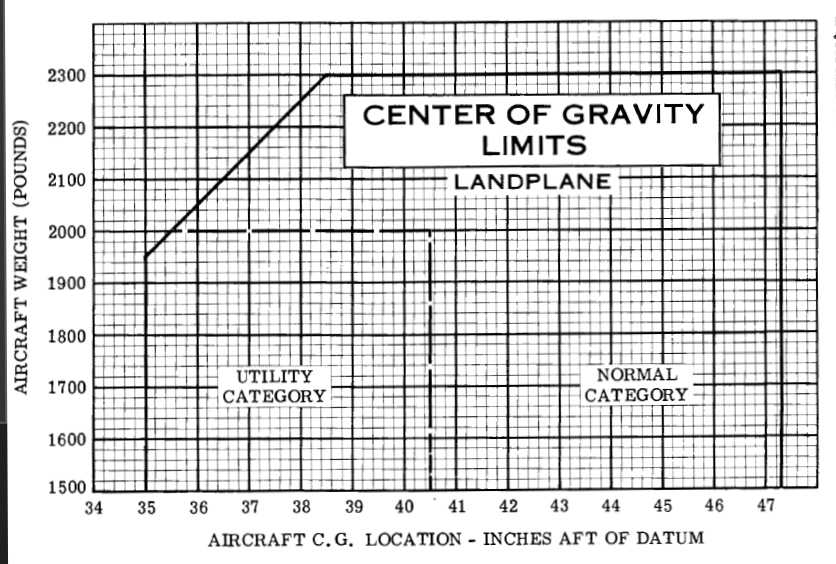
Step Four
- Verify the CG is within allowable limits using the corresponding chart on the POH.
C 172 M
C 172 SP
Review
Table Method
- The table method applies the same principles as the computational and graph methods. The information and limitations are contained in tables provided by the manufacturer.
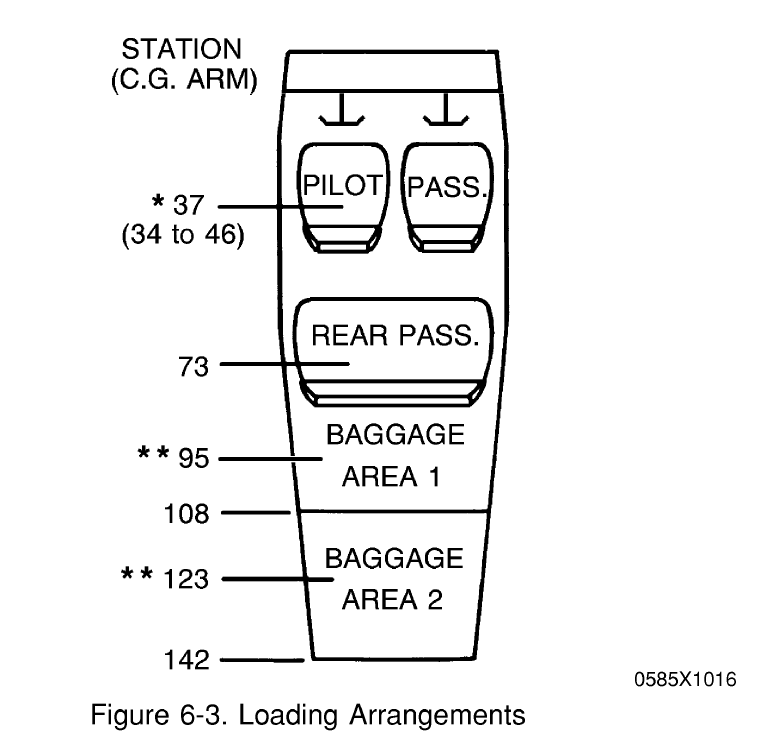
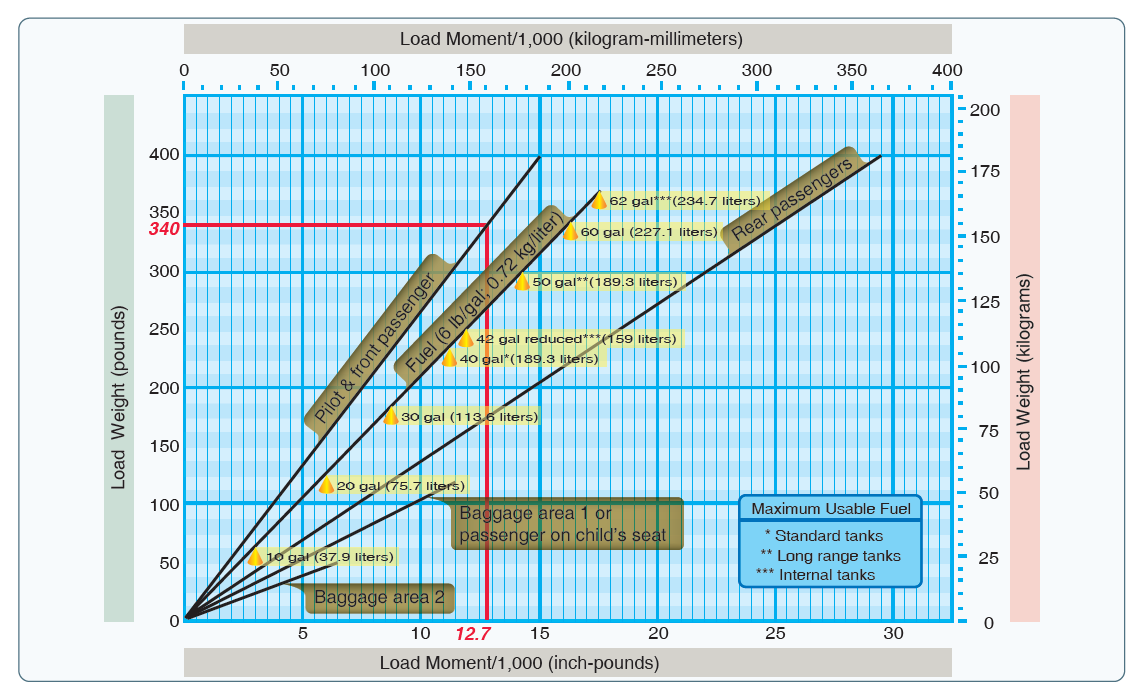
Graph Method
- To reduce the need to perform arithmetic operations. Most POH's include tables that can be used to determine moments automatically. Refer to the appropriate POH to find the charts.
Loading Graph
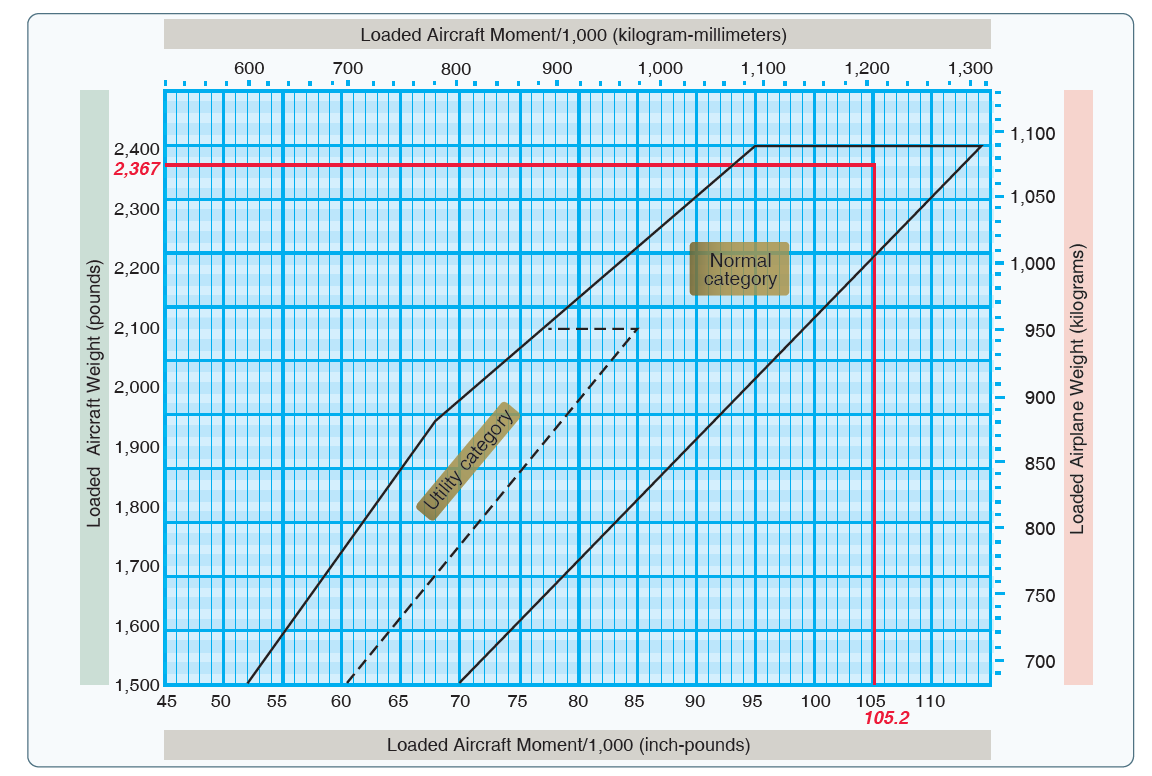
CG Moment Envelope
Weight Shift Formula
The FAA provides two formulas for weight change and one formula for weight shift. The following formula is much simpler and appealing. It is adapted from a class handout developed by Dr. Melville R. Byington at Embrry - Riddle Aeronautical University.
Basic Theory
At any time, the CG is simply the sum of all moments divided by the sum of all weights:
CG = ( Σ M) / ( Σ W)
- Since CG was known at some previous (#1) loading condition (with moment = M1 and Weight = W1), it is logical that the previous CG becomes the point of departure.
- Due to weight addition, removal, or shift the moment has changed by some amount, ΔM. The total weight has also changed if, and only if, the weight has been added or removed. Therefore, the current CG is merely the current total moment divided by the current total weight in equation format.
CG = Current Moment / Current Weight
CG =
This UNIVERSAL FORMULA will accommodate any weight change and/or CG shift problem. Before proceeding, certain points deserve a review:
1
3
2
Any weight added causes a + moment change (weight removed is - )
Weight shifted rearward causes a + moment change (forward is - )
A weight shift changes only the moment (ΔW = 0)
Examples
a. An airplane takes off at 6,230 lb. with a CG location at station 79.0. What is the location of the CG after 50 gal. (300lb) of fuel has been consumed from station 87.0?
CG Answer
b. An airplane takes off at 3,000 lb. with CG at station 60. Since takeoff, 25gal. (150lb.) of fuel has been consumed. Fuel cell CG is station 65. After takeoff, a 200 lb passenger moved from station 50 to station 90. Find the resulting CG.
CG Answer
Effects of Operating at High Total Weights
All the following are directly Tied to the Total Weight of the airplane
- Maximum Airspeed
- Stall Speed
- Takeoff / Landing Distance
- Rate of Climb
- Maneuvering Speed
Flight at Various CG Positions
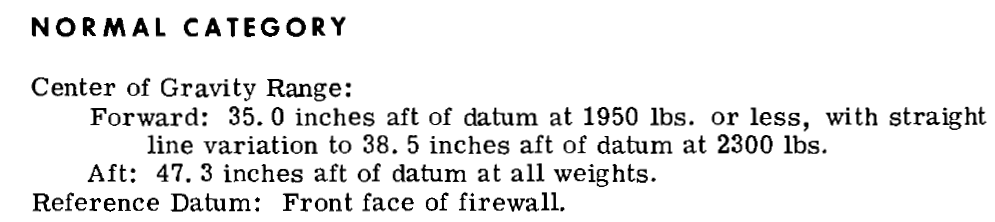
Center of Gravity Limits
All airplanes have a maximum forward and aft CG limits that can be found on the POH of the respective aircraft. As long as you load your plane within the CG range, and given normal flight conditions, longitudinal stability and control of the airplane will be achieved.
C 172 M
C 172 SP
Forward CG Effects
- Increased Elevator Control: The arm between the CG and the elevator is greater (greater moment obtained).
- Increased Stall Speeds: The increased tail downforce is translated into additional weight the wings must support. Therefore, the airplane will fly at a higher AOA for any given speed.
- Decreased Cruising Speed: A greater angle of attack for any given speed means greater drag is produced.
- Decreased Elevator Control: The arm between the CG and the elevator is shorter (less moment obtained).
- Decreased Stall Speeds: The decrease in tail downforce is translated into additional weight that the wings will support. Therefore, the airplane will fly at a lower angle of attack for any given speed.
- Increased Cruising Speed: A lower angle of attack for any given speed means lower drag produced.
Aft CG Effects
Forward CG
- Increased longitudinal stability
- Higher stall speed
- Lower cruise speed
- Nose heaviness
- Difficult or impossible to flare for landing.
Aft CG
- Poor stall recovery
- Less stable at all airspeed
- Decrease longitudinal stability
- Higher cruise speed
- Lower stall speed
The actual location of the CG can be altered by many variable factors and is usually controlled by the pilot. The placement of baggage and cargo items determines the CG location. The assignment of seats to passengers can also be used as a means of obtaining a favorable balance.
Fuel burn can also affect the CG based on the location of the fuel tanks.
Review
Flight Computers
Flight Planning Concepts
For flight planning, you must understand how the winds affect your performance.
Effect of the wind
- During flight, the air is in motion, which influences the airplane's speed and path over the ground.
- Adding the vector for the aircraft's airspeed to the wind vector gives a resultant vector that shows the speed and direction affected by the wind.
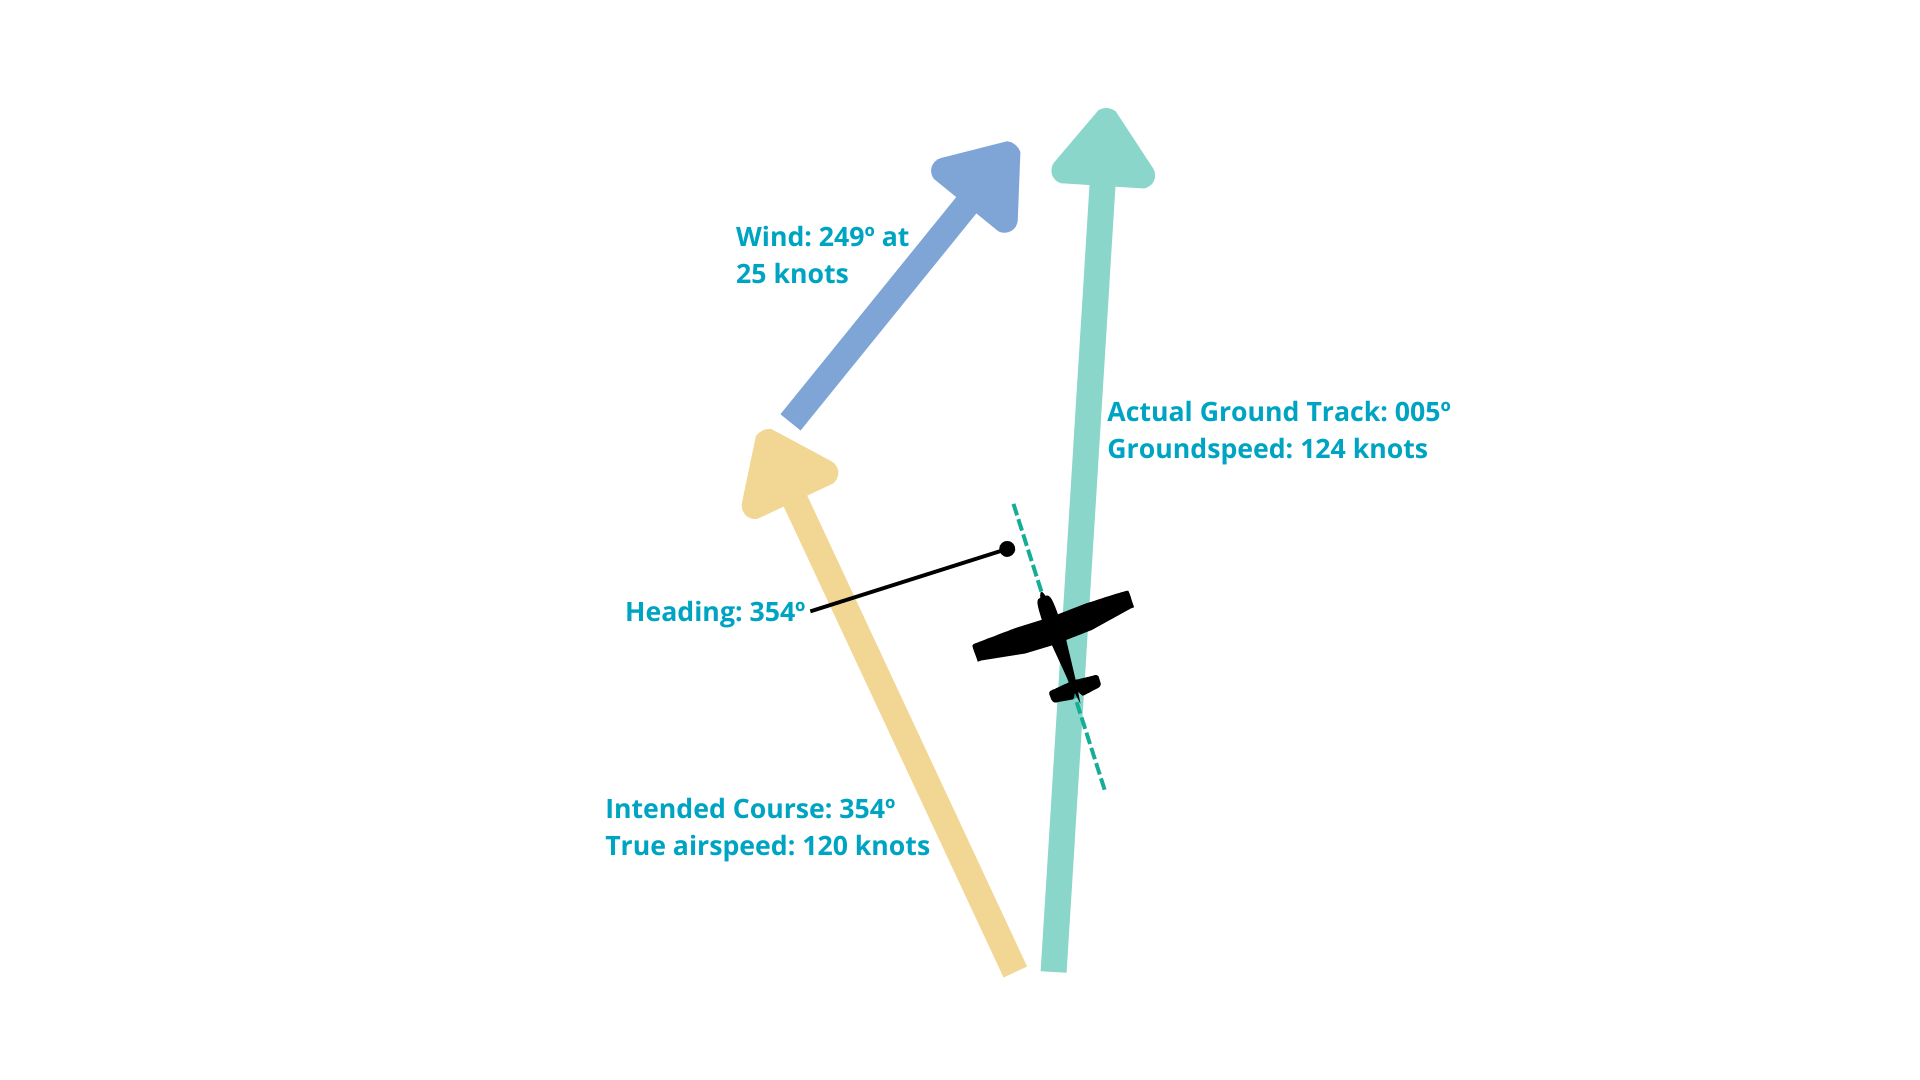
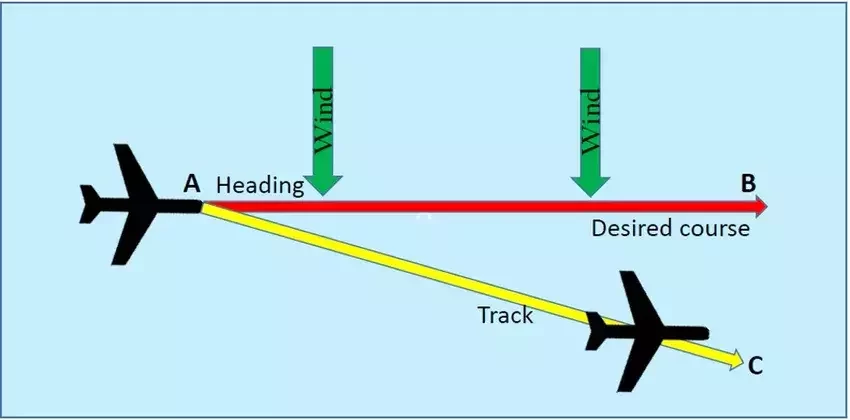
- Wind will affect the airplane's course during its flight, and wind correction is needed.
-
This is called Wind Correction Angle (WCA)
- The angle between the heading and the desired course.
- Headwind: decreasing the ground speed
- Tailwind: increasing the ground speed
- Crosswind: drift the airplance from its course
Factors Affecting the Flight Course
Electronic Flight Computers
- E6B electronically uses the same procedures to solve problems such as finding ground speed, wind correction angle, fuel burn, etc.
- However, pilots should understand how to use it because you still need to input the correct information to find the answers.
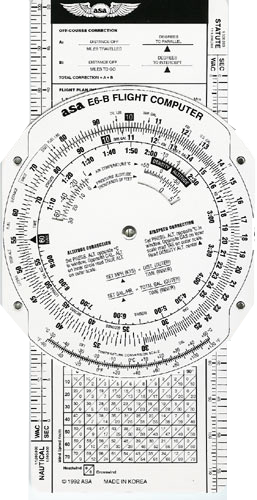
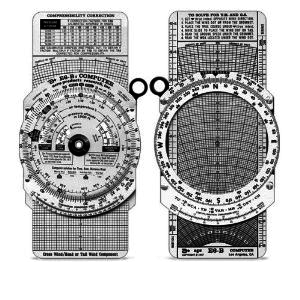
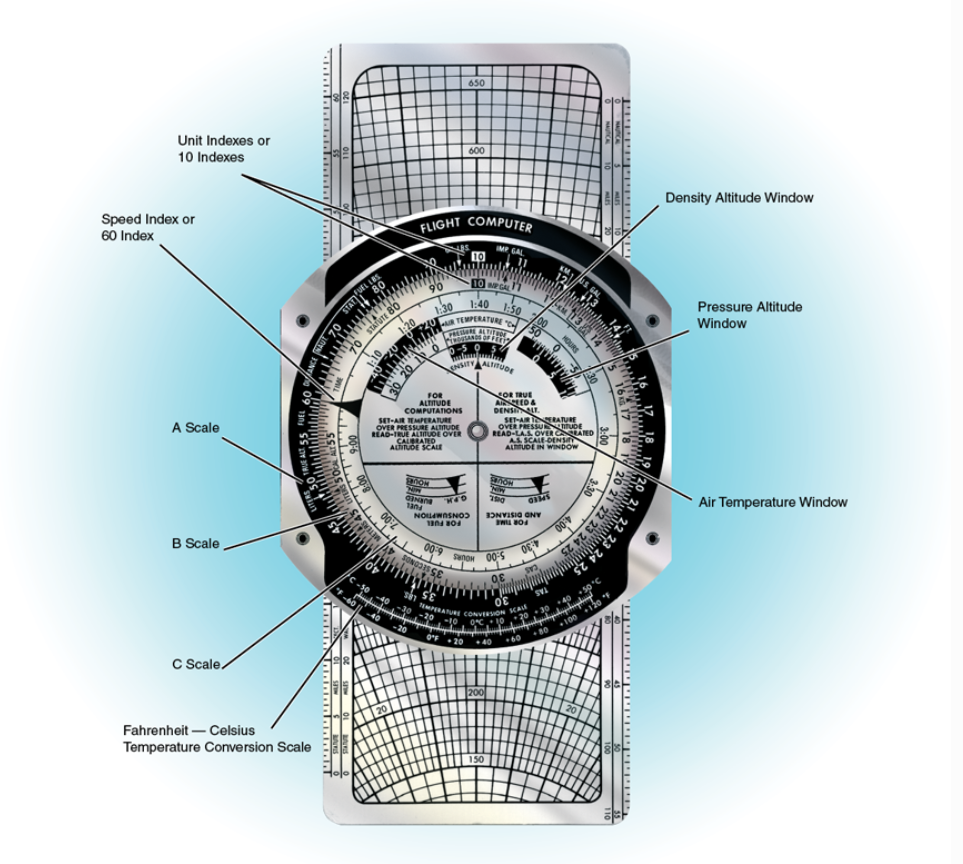
Mechanical Flight Computers
-
At first may look complicated, but with a little practice, it becomes familiar an useful. The computer has two sides:
-
Computer side - used for solving problems such as time, fuel, distance, fuel consumption and various conversion.
- Wind side - is for the different winds calculation.
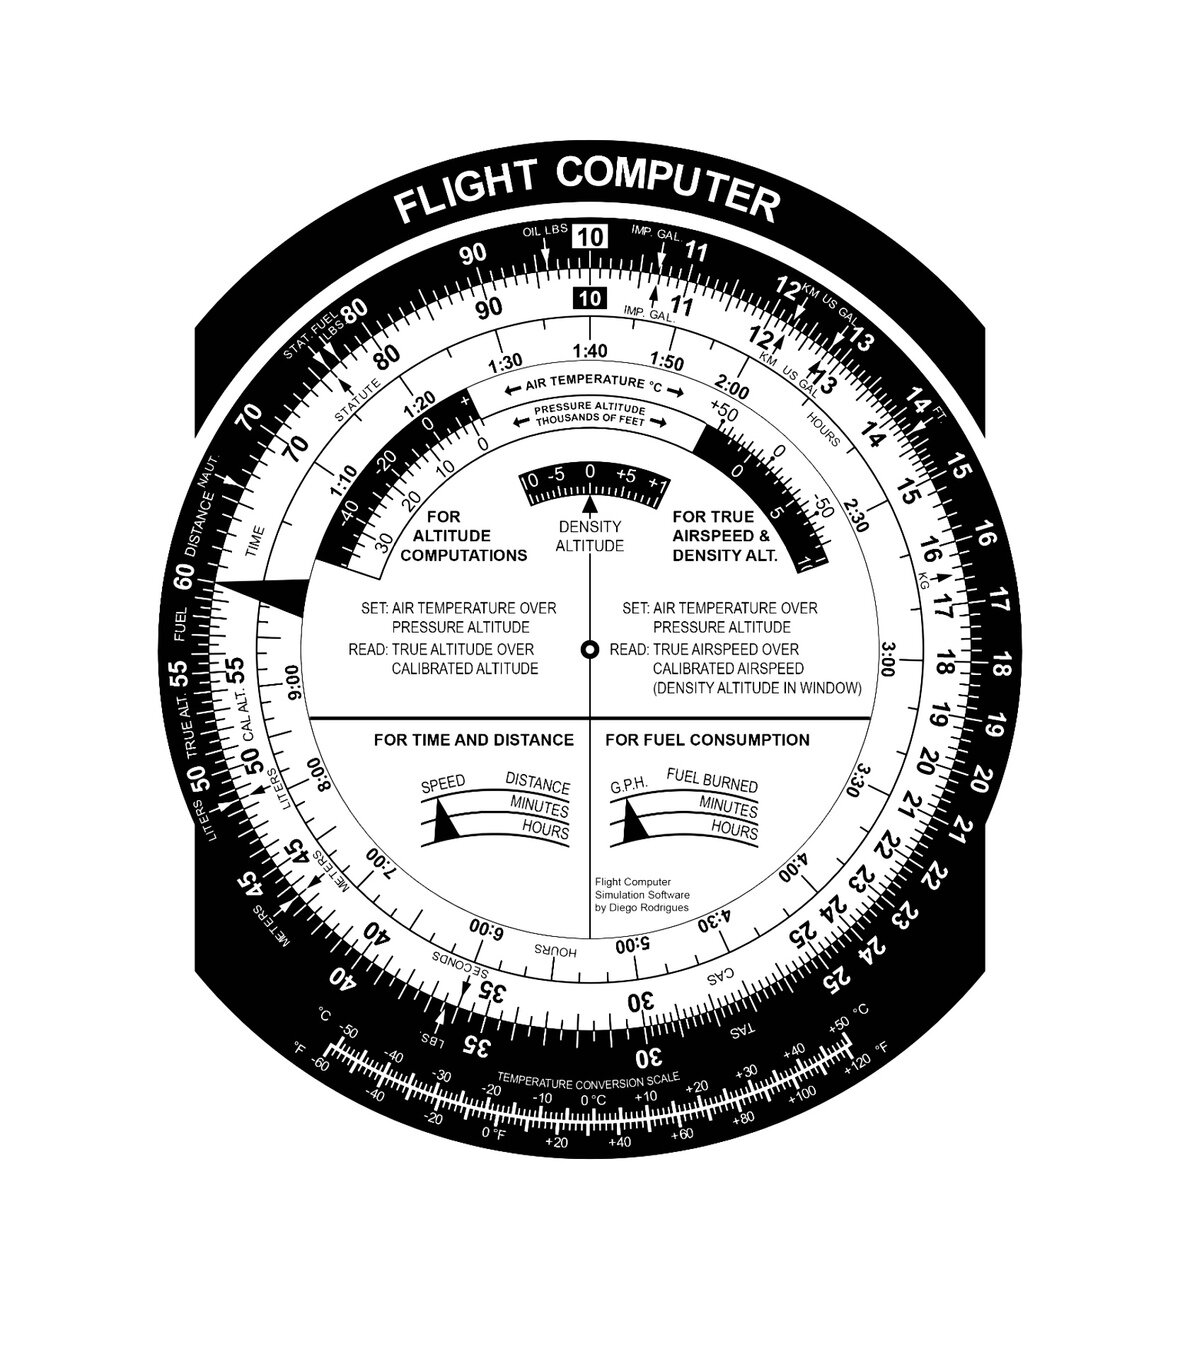
Using the computer side
Groundspeed
During flight planning, you must determine your groundspeed based on:
- True course
- True airspeed
- The winds aloft
Using the azimuth plate, true index, and a wind dot, you can determine how the wind will affect your airplane in flight.
Ground Speed and True Heading
By: Flight Tutor
Time, speed and distance
Time, speed and distance are the most common calculations on your flight computer (E6B)
There is a scale for:
- Distance (outside)
- Time (inside)
- Speed (outer)
Time, Speed and Distance
BY: asa2fly
Flight Time
During flight planning, you calculate time, speed, and distance to determine the duration of each flight leg and the total trip time.
Flight Time = Total Distance / Speed
How to calculate flight time?
Fuel Consumption
The speed index will represent the gallons per hour, and the outside scale is then used to represent the gallons of fuel consumed. The time traveled will be representing in the inside scale.
- Gallon Per Hour (speed index)
- Time (inside)
- Gallons consumed (outer)
Endurance is the amount of time you can fly, but is an approximation, not an actual value.
Fuel Consumption
By: Flight Tutor
Airspeed and Density Altitude Calculations
There are two different sets of scales and windows for air temperature and pressure altitude.
- Set temperature over pressure altitude in the pressure altitude window (do no change the "wheel" afterwards.
-
Check POH conversion table indicated airspeed to calibrated airspeed.
- Read the TAS over CAS
- Read density altitude
Conversions
Temperature conversion scale located at the bottom
Fahrenheit/Celsius
Nautical Miles/Statute Miles
Fuel Pounds/ Gallons