MERCS
Multi-directional Ensembles of
Regression and Classification Trees
Outline
- Introduction
- MERCS
- Anomaly Detection
- Outlook
Outline
- Introduction
- MERCS
- Anomaly Detection
- Outlook
Introduction
What is the relationship of
Machine Learning to other sciences?
Standard problem of ML
Given:
Derive:
Standard problem of ML
N.b.:
Some of the red entries have to be known in order to achieve this!
Different flavours of ML
This encompasses many kinds of ML
- Function approximation
(cf. optimization) - Probabilistic learning
- Explicit modeling
Correspond to various kinds of f
Different flavours of ML
This encompasses many kinds of ML
- Predictive models
- Generative models
Correspond to various X, Y
Different flavours of ML
This encompasses many kinds of ML
- Supervised learning
- Semi-supervised learning
- Unsupervised learning
Correspond to
feedback available to the algorithm
while learning f
How does this relate to the rest?
Machine Learning is just another kind of mathematical tool, that can be used to address questions in science and engineering
We start from data and rely on algorithms, rather than searching for a reasonable f ourselves.
4 ways of doing science
- By developing theories
- By performing experiments
- By performing simulations
- By looking at the data
Where does anomaly detection fit in?
Nowhere?
Anomaly detection is hard,
precisely because
f is not easily defined
Where does anomaly detection fit in?
Many approaches exist,
2 key ideas:
- Learn a model of the normal data (~generative approach), flag things that do not correspond to this as anomalies
- Convert to the canonical form,
learn to
detect known anomalies explicitly
Outline
- Introduction
- MERCS
- Anomaly Detection
- Outlook
MERCS
Motivation
``Flexibility matters.
Any truly intelligent system must not only possess the ability to solve a task, but must also exhibit considerable flexibility with regard to the task itself.''
Research Goal
But, now:
- \(X\) is not given at training time
- \(Y\) is not given at training time
This is what we call a versatile model
Motivation
Can we lift an ensemble of predictive models to reveal the general structure of a given dataset?
Motivation
Discovering general structure is typically the domain of probabilistic methods,
i.e. Bayesian Networks.
Bayesian Network

Motivation
Can it be done differently?
Can it be done by methods that are more suitable for big data?
The model
The model
Some properties
+
-
- Interpretable
- Scalable
- Numeric and nominal attributes
- Exponential: Including every possible f (~tree) is impossible
- Predictive: Decision trees do not offer actual probabilistic reasoning (\(\leftrightarrow\) Bayesian Networks)
Main challenge
Including every possible f is infeasible
1. We include a sample of possible trees in our ensemble
2. When presented with a prediction task,
we combine those trees appropriately
1. Make a selection of lego blocks
2. Build what you need with those lego blocks
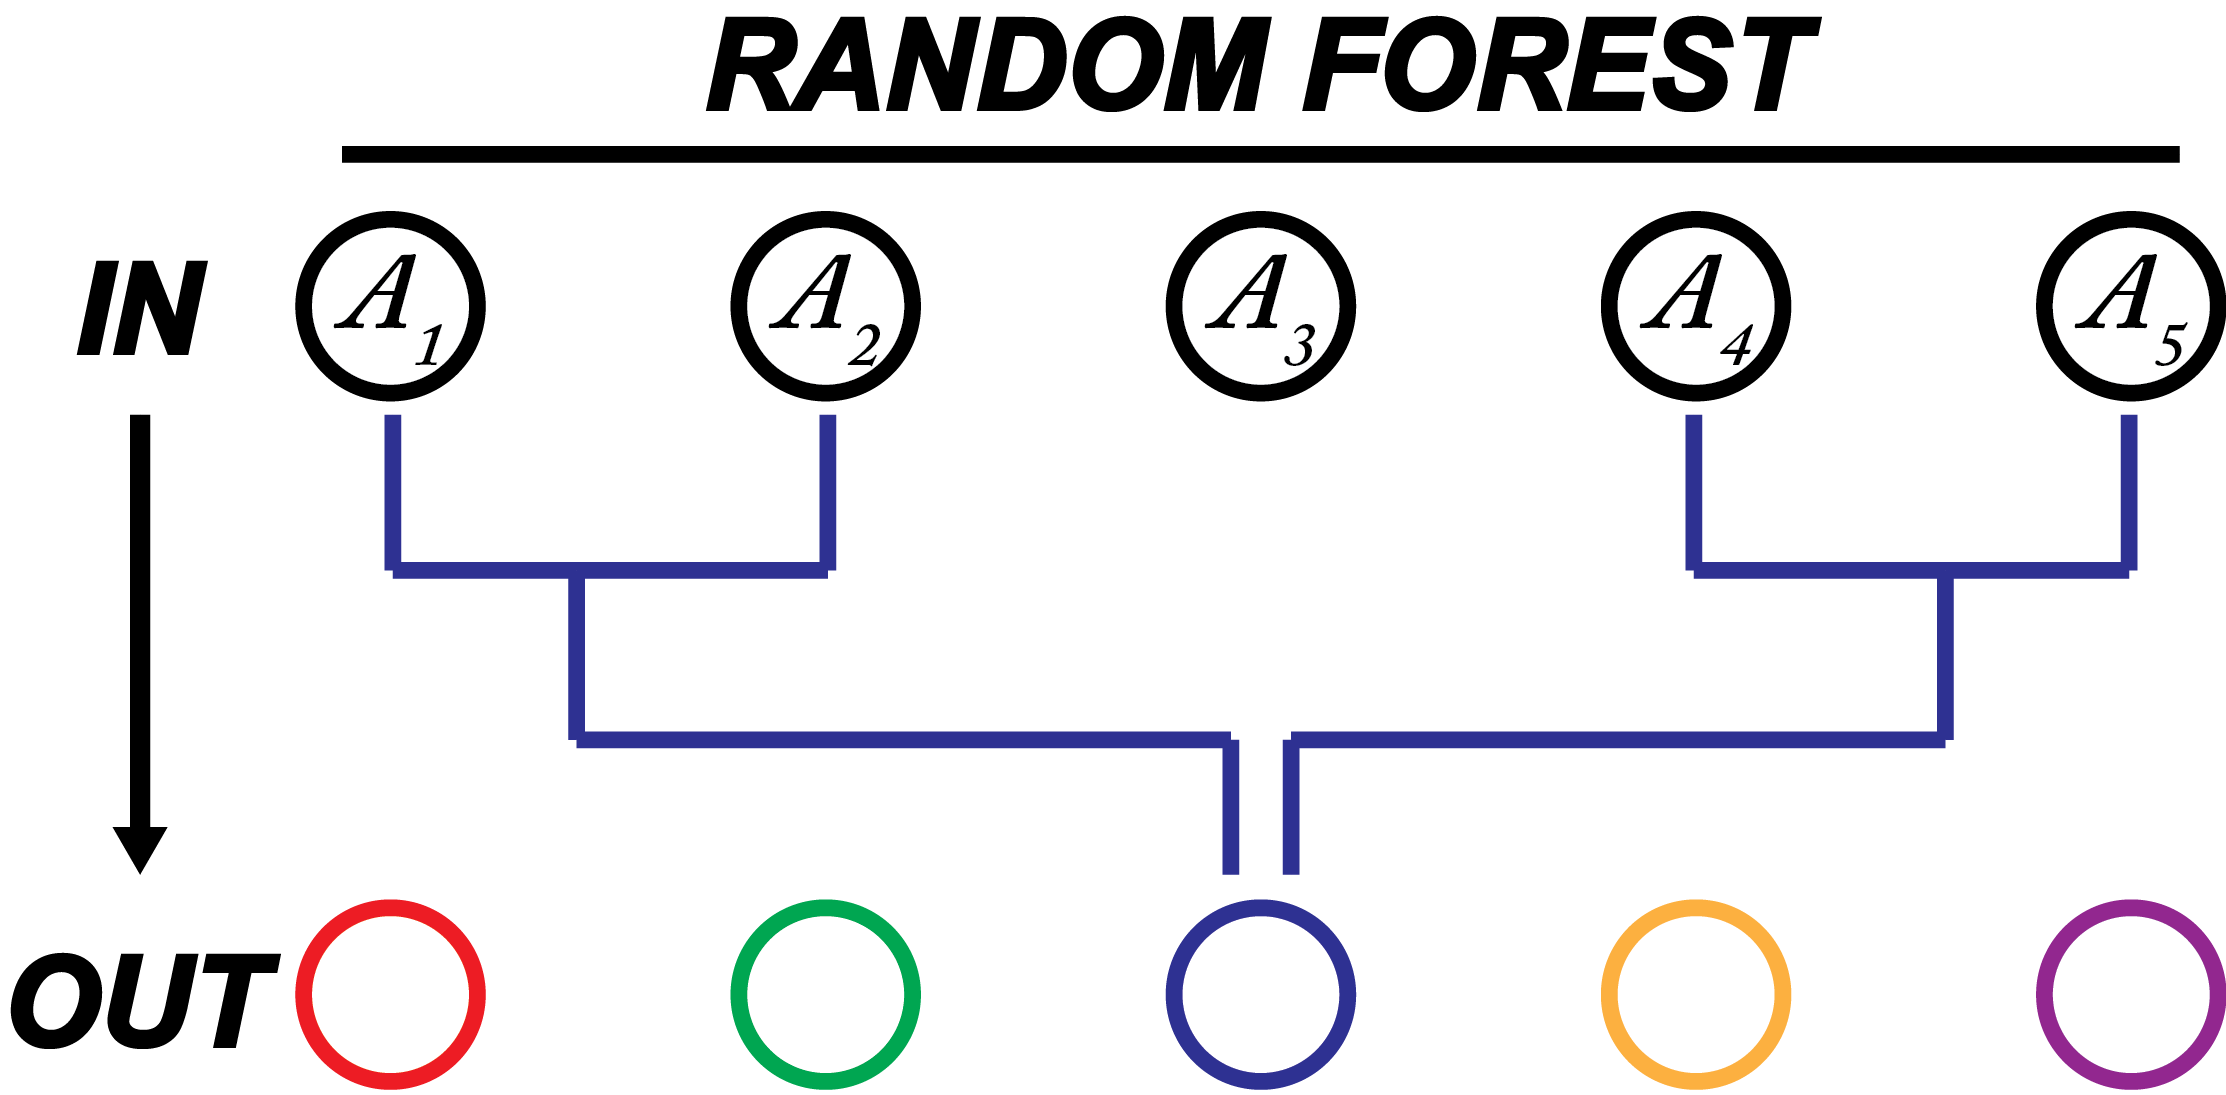
Predictions in MERCS
There are 2 ways of building:
- Build ensembles of trees
- Build chains of trees
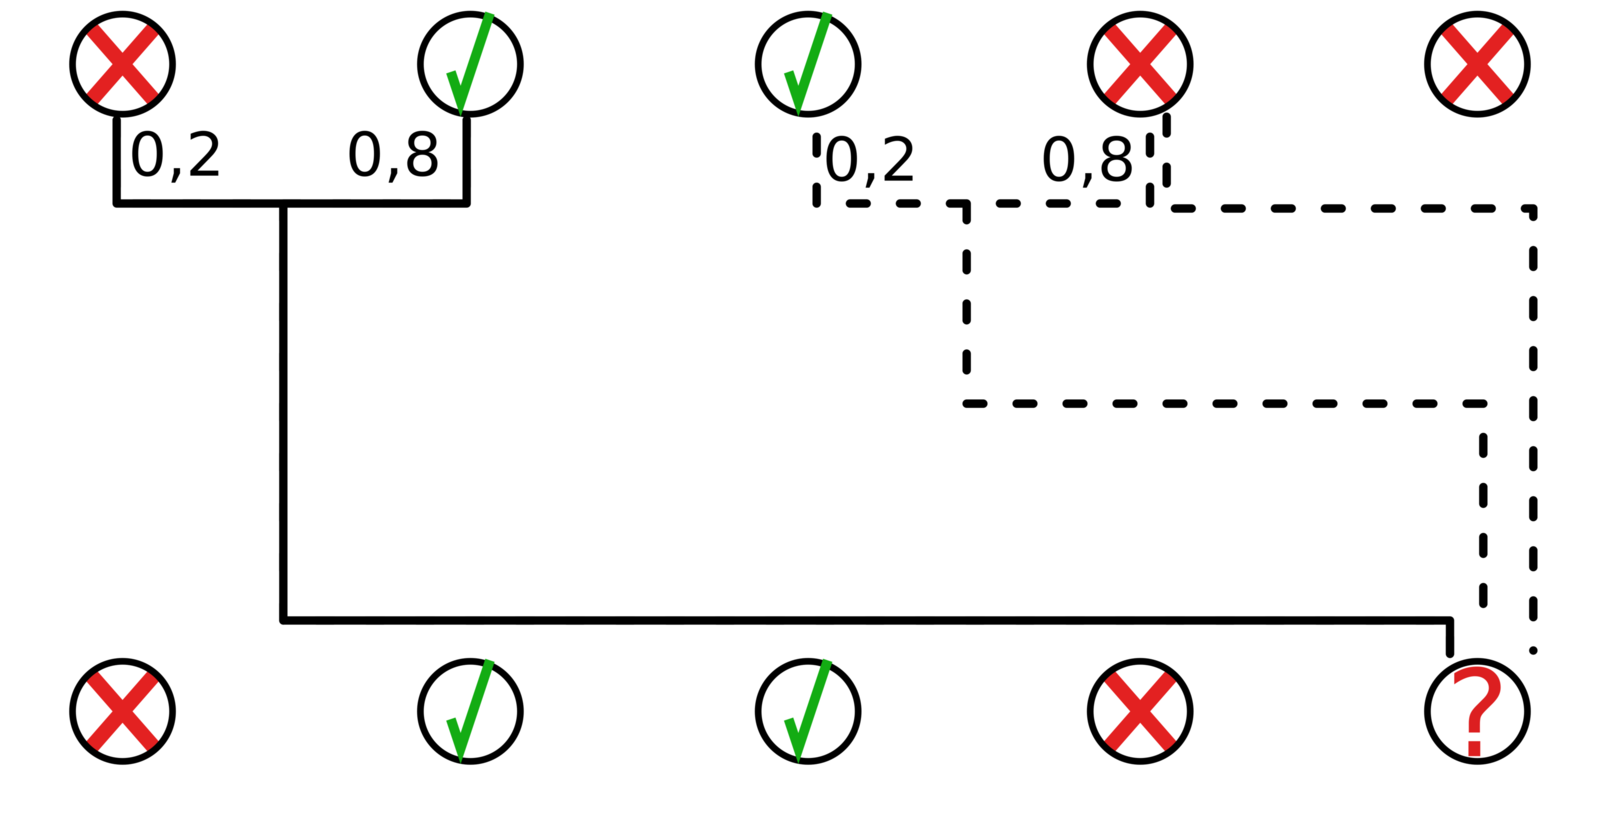
Example:
MAFI prediction strategy
Select most appropriate trees, based on feature importance
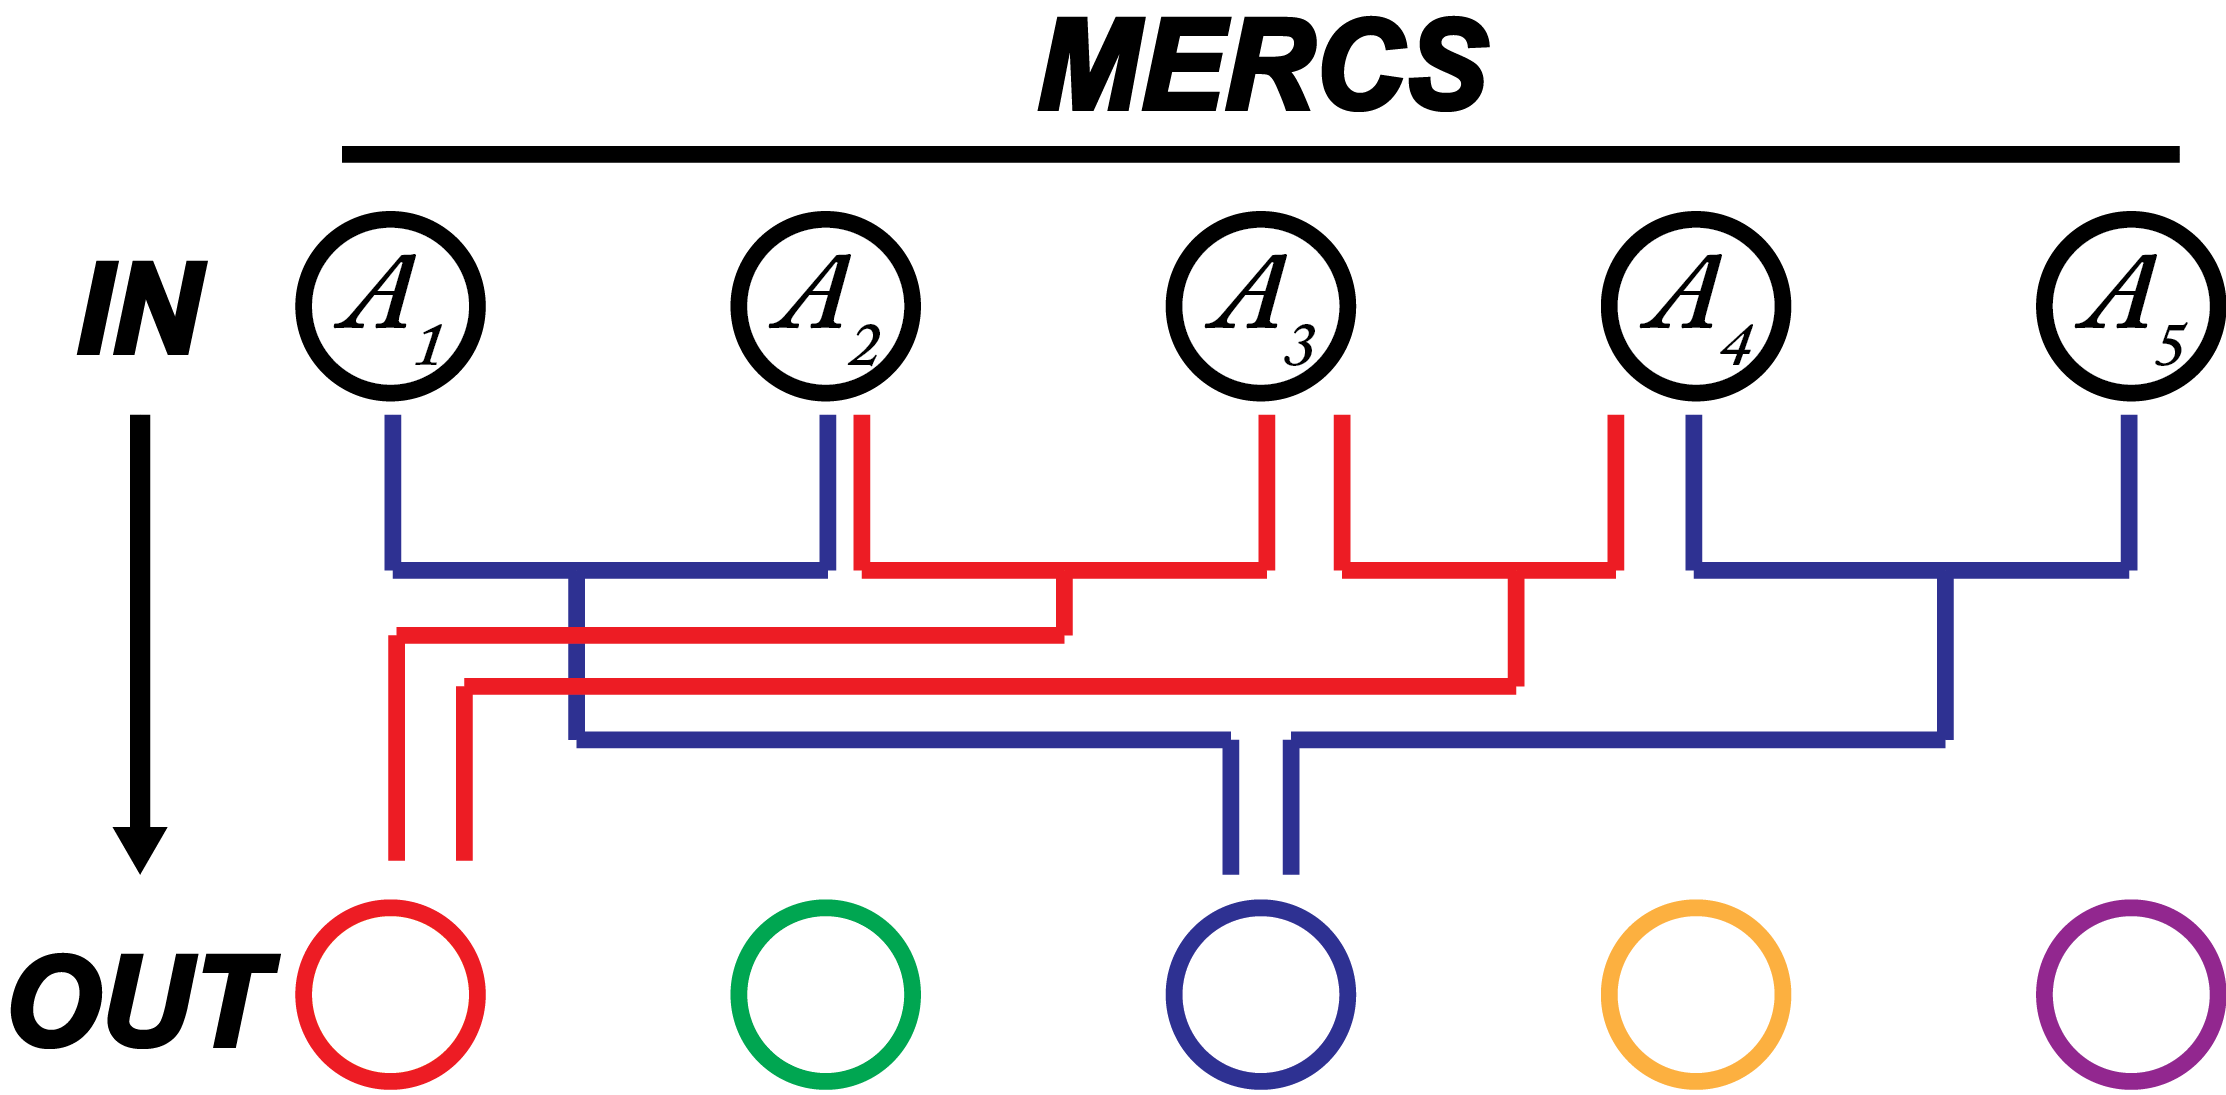
Example:
MAFI prediction strategy
Select most appropriate trees, based on feature importance
Example:
MAFI prediction strategy
Select most appropriate trees, based on feature importance
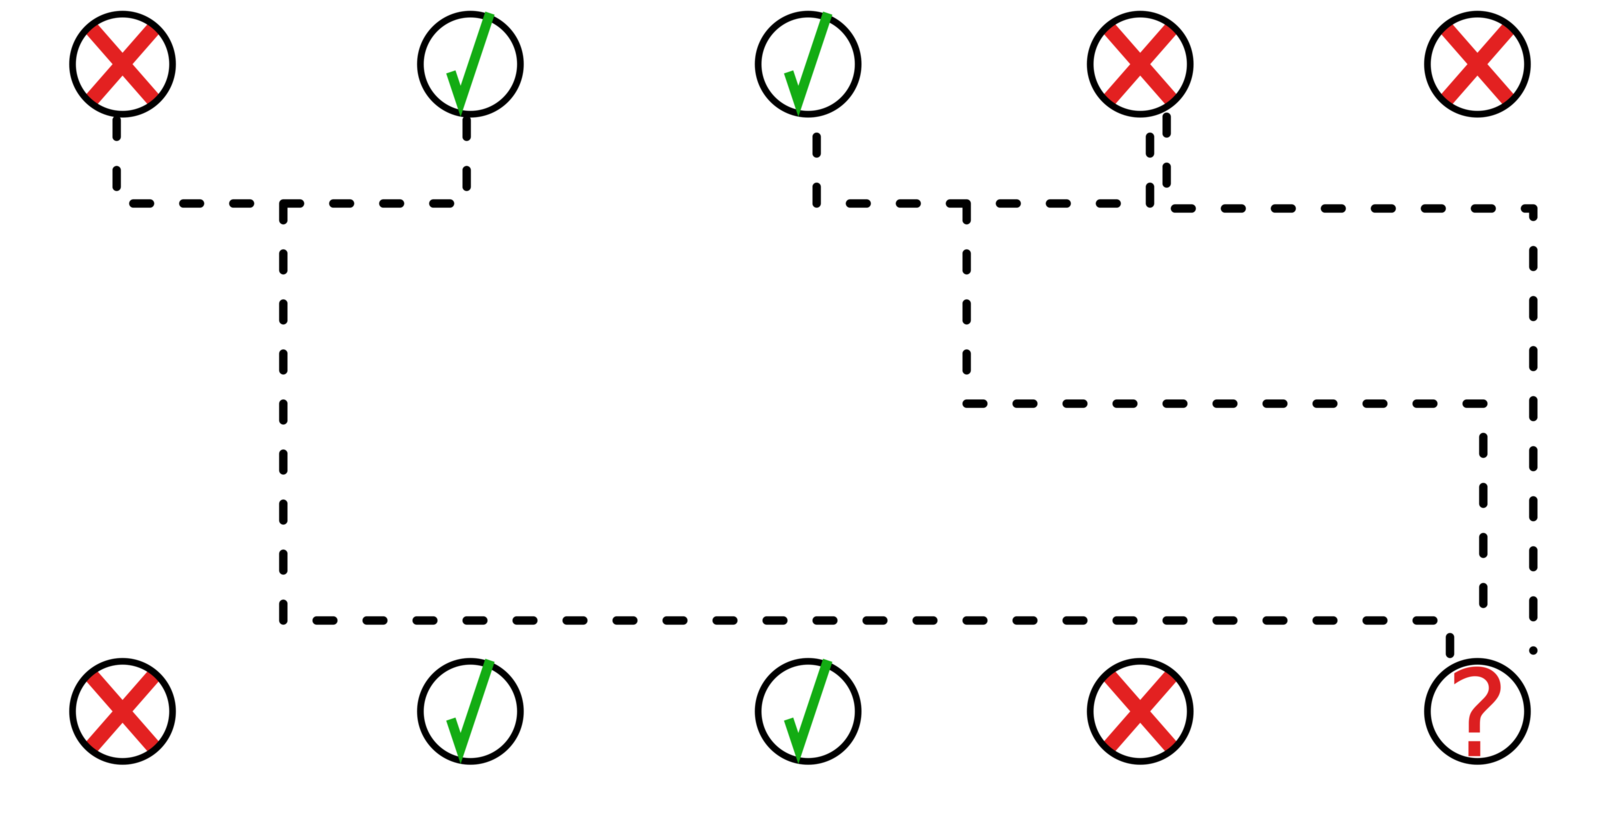
Example:
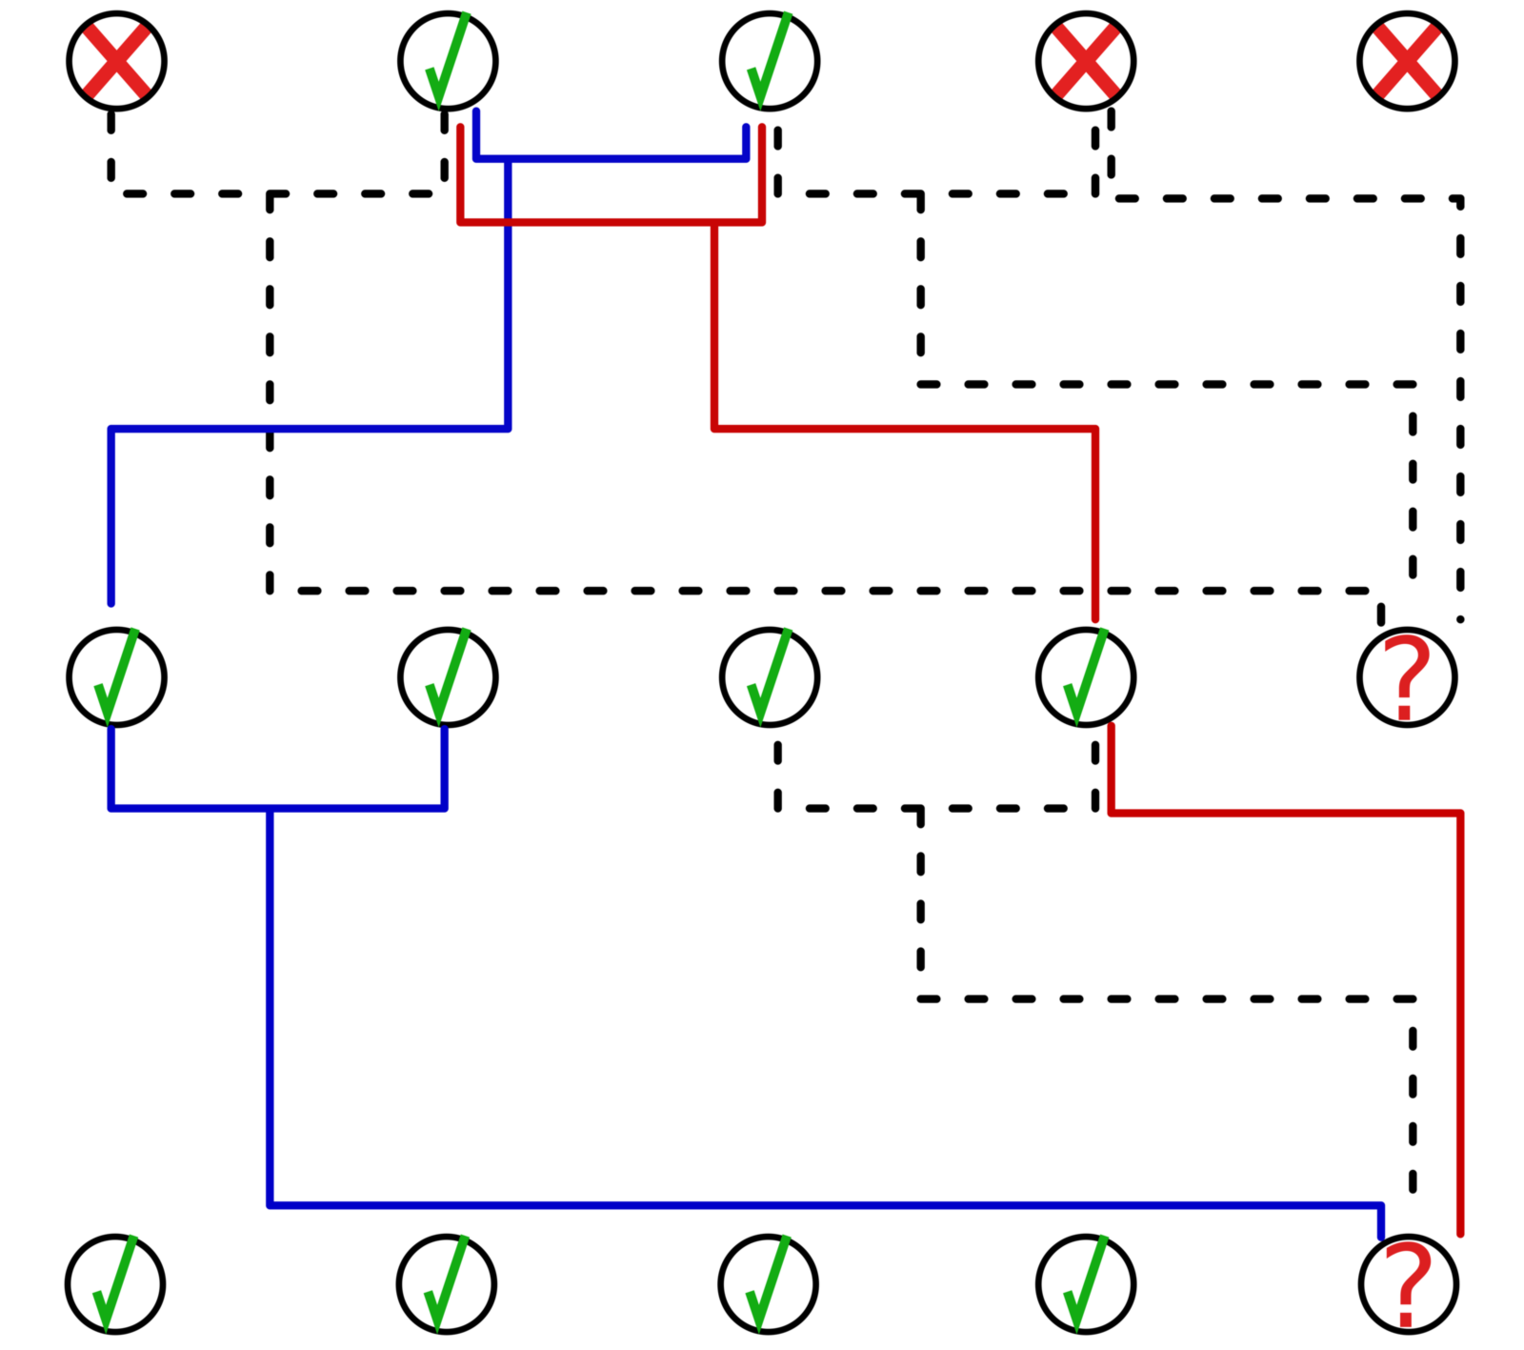
RW prediction strategy
Do Random Walks in the MERCS model
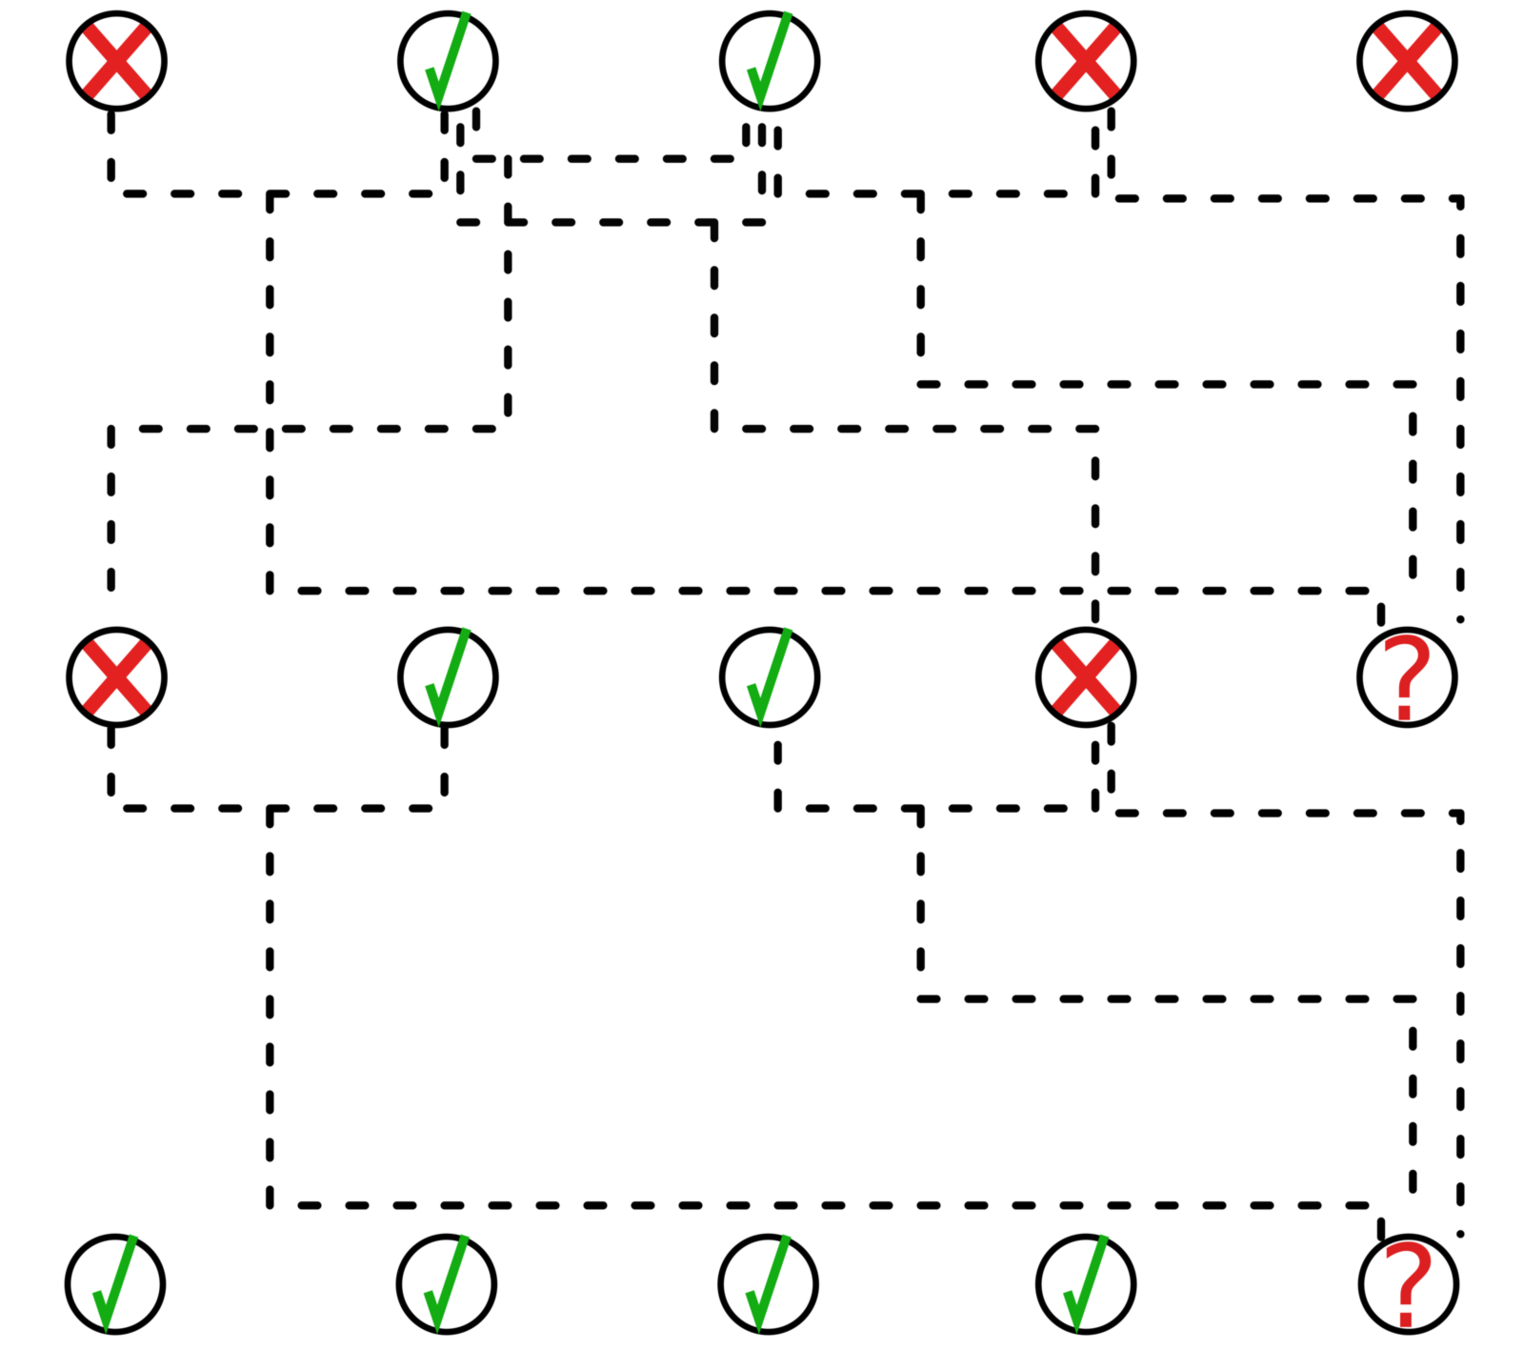
Example:
RW prediction strategy
Do Random Walks in the MERCS model
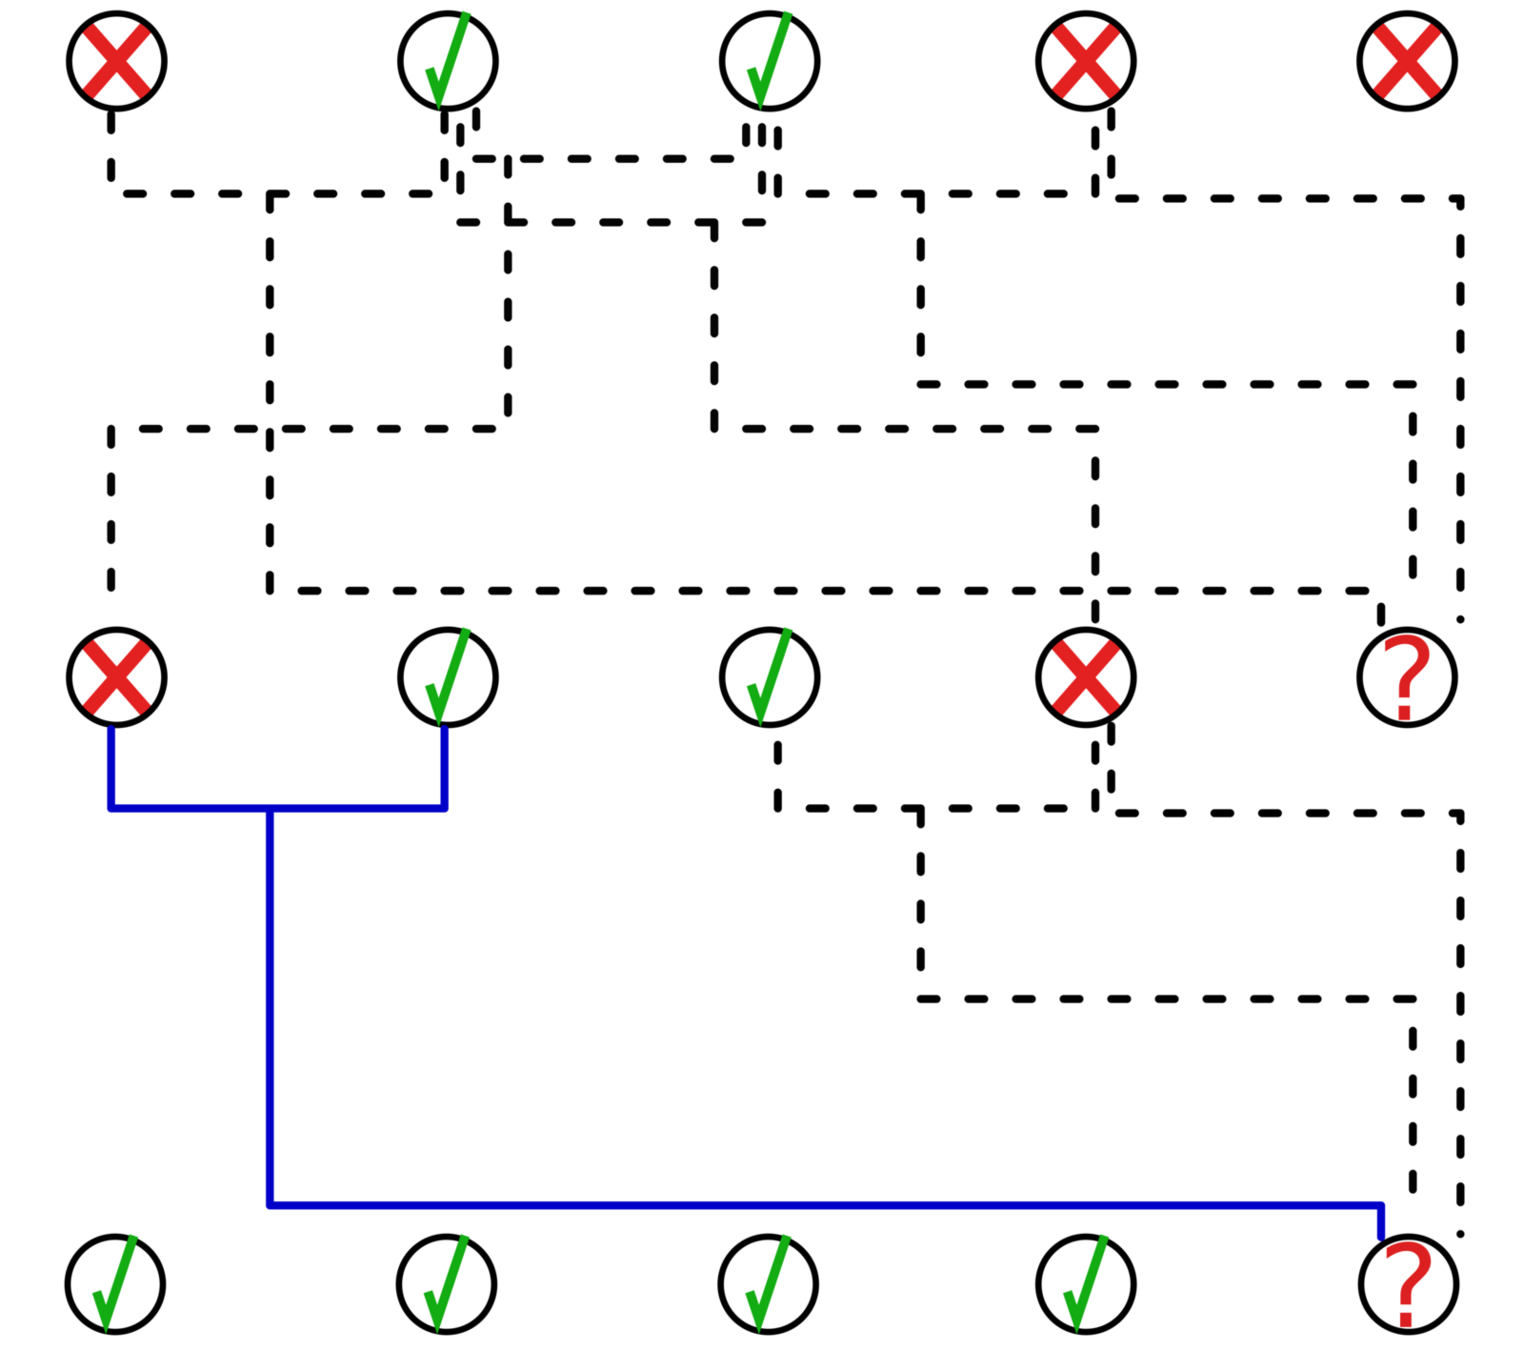
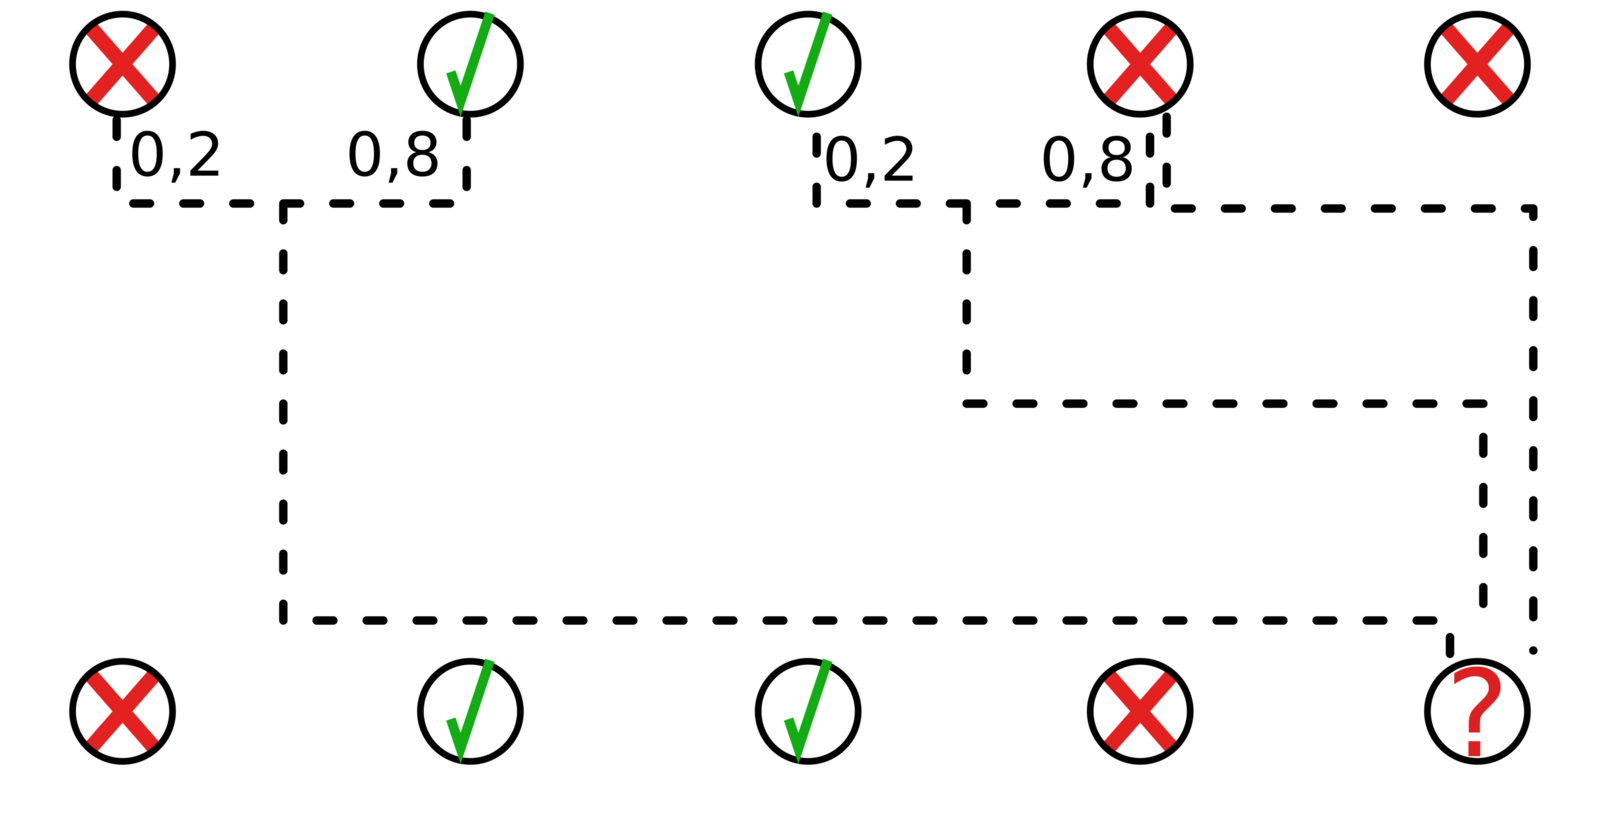
Example:
RW prediction strategy
Do Random Walks in the MERCS model

Example:
RW prediction strategy
Do Random Walks in the MERCS model
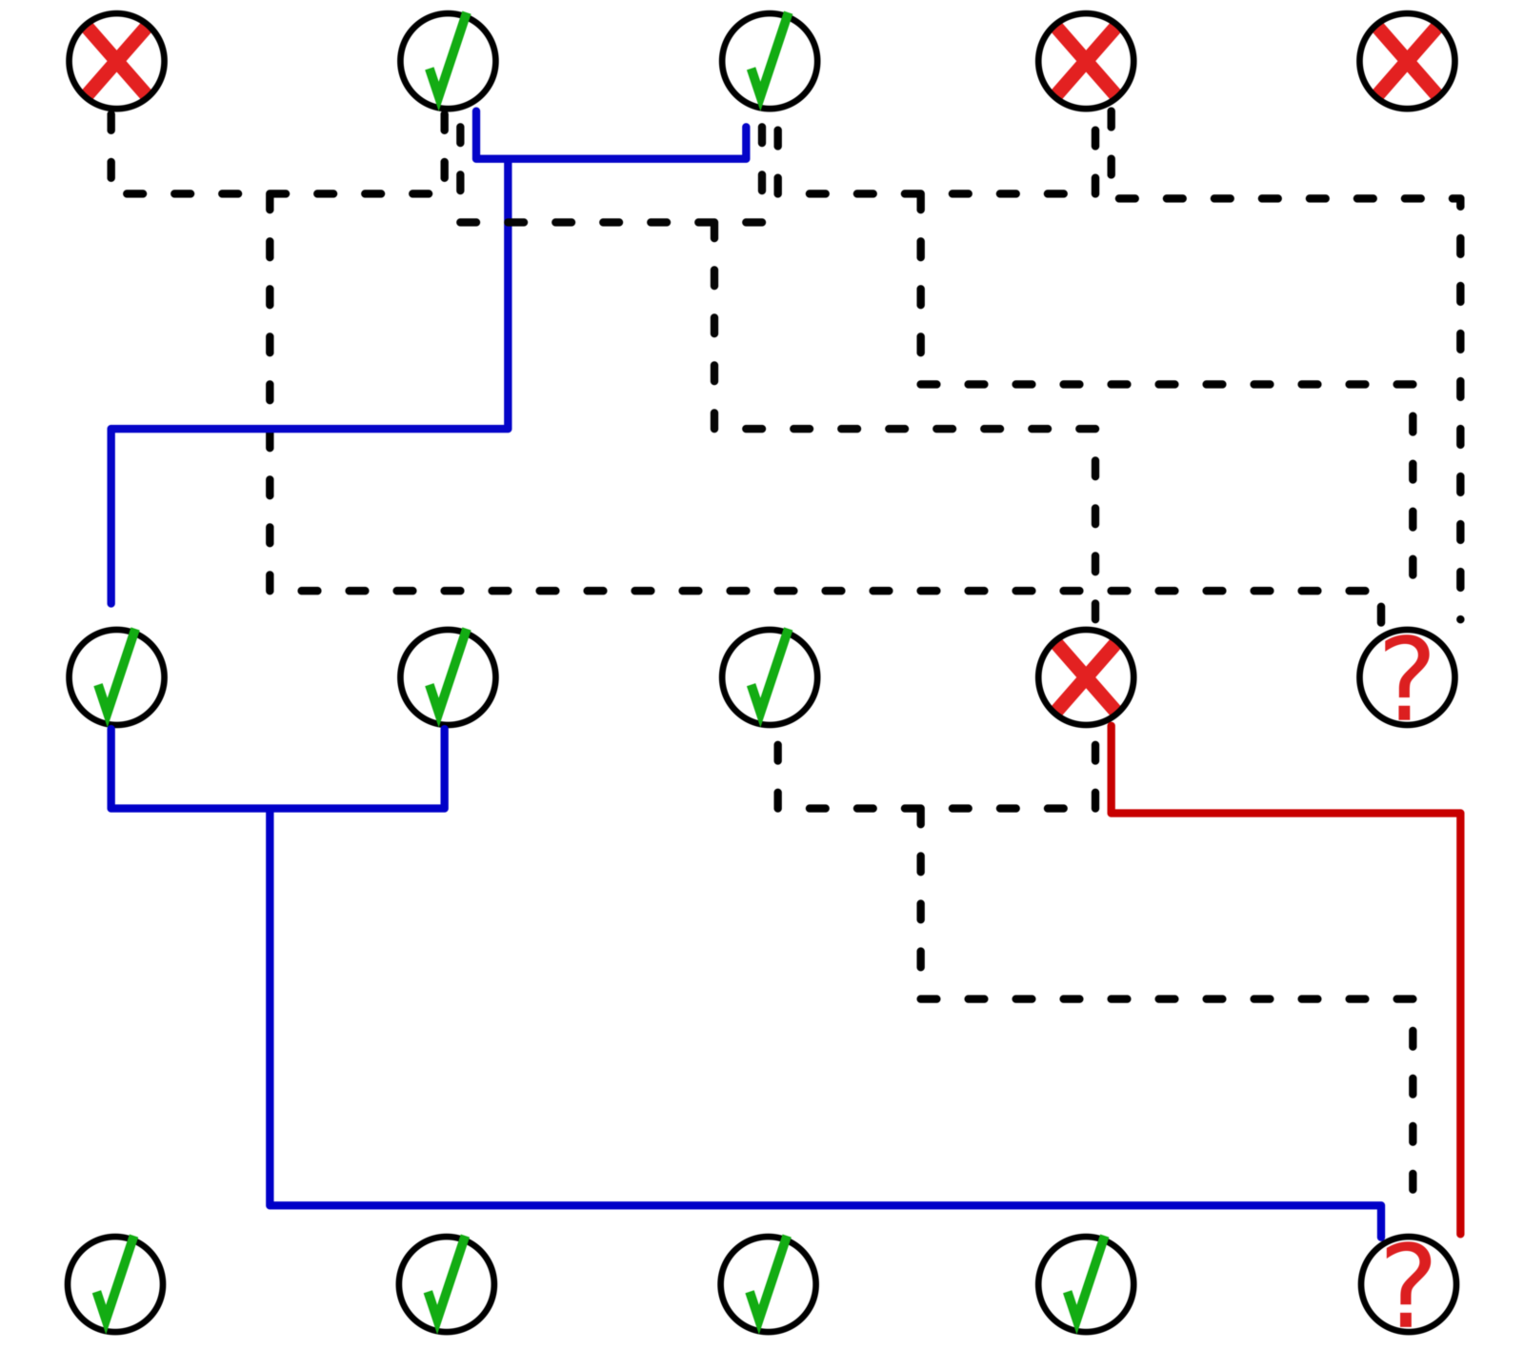
Example:
RW prediction strategy
Do Random Walks in the MERCS model
Conclusions
on prediction strategies
- Appropriateness is a very important criterion to compose an ensemble
- Chaining is pretty powerful to introduce more flexibility
- Time - Performance tradeoff
Application areas (1)
Machine Learning in spreadsheets
The task is to predict entries in a particular column from data present in the rest of the spreadsheet.
Missing data (i.e., empty cells) requires some degree of flexibility on the prediction algorithm to cope with changes in the available information (i.e., changing \(X\))
Application areas (2)
Anomaly detection for industrial applications.
Ideally, an algorithm designed to detect anomalies in this context needs to exhibit some degree of robustness against this kind of small, but common malfunctions.
Here, complex machines are monitored by many sensors and not every data source may function properly all the time.
Outline
- Introduction
- MERCS
- Anomaly Detection
- Outlook
MERCS
for
Anomaly Detection
MERCS for anomaly detection
- Residual analysis
- Clustering approach
MERCS for anomaly detection
Residual analysis
Using the flexible predictions that MERCS allows to detect anomalies:
- Predict every attribute from all the other available ones
- Verify whether observations deviate from predictions
- If the deviation (i.e. the residual) exceeds a certain threshold, flag as anomaly
MERCS for anomaly detection
Residual analysis
When we cannot predict something correctly,
this indicates an anomaly
MERCS for anomaly detection
Clustering analysis
A decision tree implicitly defines a hierarchical clustering
- Every node in a decision tree
splits the parent node - Those two new parts can be regarded as two new clusters of data points
- If an observed value is very atypical in its clusters, flag as anomaly
MERCS for anomaly detection
Clustering analysis
Use the structure as represented by the several clusters to detect anomalies
Outline
- Introduction
- MERCS
- Anomaly Detection
- Outlook
Outlook
Low-hanging fruit
- Root cause analysis
- Try more off-the-shelf algorithms
- Smarter feature selection
- Why was one year
so much easier than the other?
Interesting possibilities
- See if MERCS can mean something
- More attention to temporal component
- Semi-supervised approaches (user-feedback)