Creating Dashboard Visualizations
Elisabeth Engel
0%
99%


Easy, RiGHt?
Raw Big Data
Which
data?
Which representation?
Icon made by freepik from www.flaticon.com
time
$$$
Chart Sketch
Variant B
Variant A
For a/B Testing
time
$$$
Chart ResuLT
Variant A
Variant B
After A/B Testing
Clearly Variant B
Readability
IS NOT about the Font size
?


What's the better variant?
Dimensions
Encoding
Interaction
Integrity
Icon made by freepik from www.flaticon.com
Dimensions
Key InfluencErs
Time
Location
Sucess / Failure
Type
Target Group
EnCoding
Spot Information at a glance
ColoRs
Semantics
Color blindness
ColoR scHeme
colorbrewer2.org
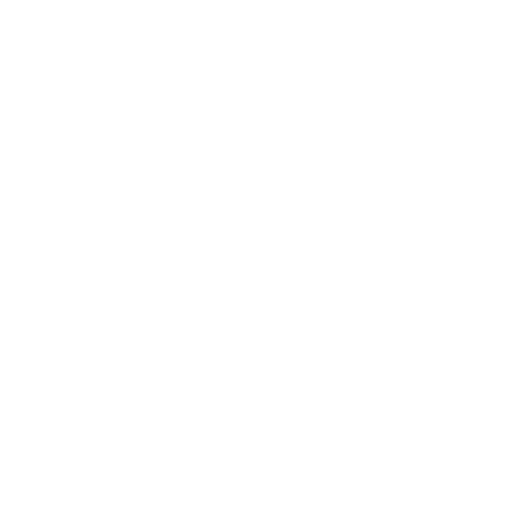
Get Inspiration
Pinterest • informationisbeautiful.net • behance.net • dailyinfographics.com
coolinfographics.com • visualcomplexity.com • flowingdata.com
improving-visualisations.org/visuals
Interaction
Zoom

Drag
Filter
Sort
Link
Highlight
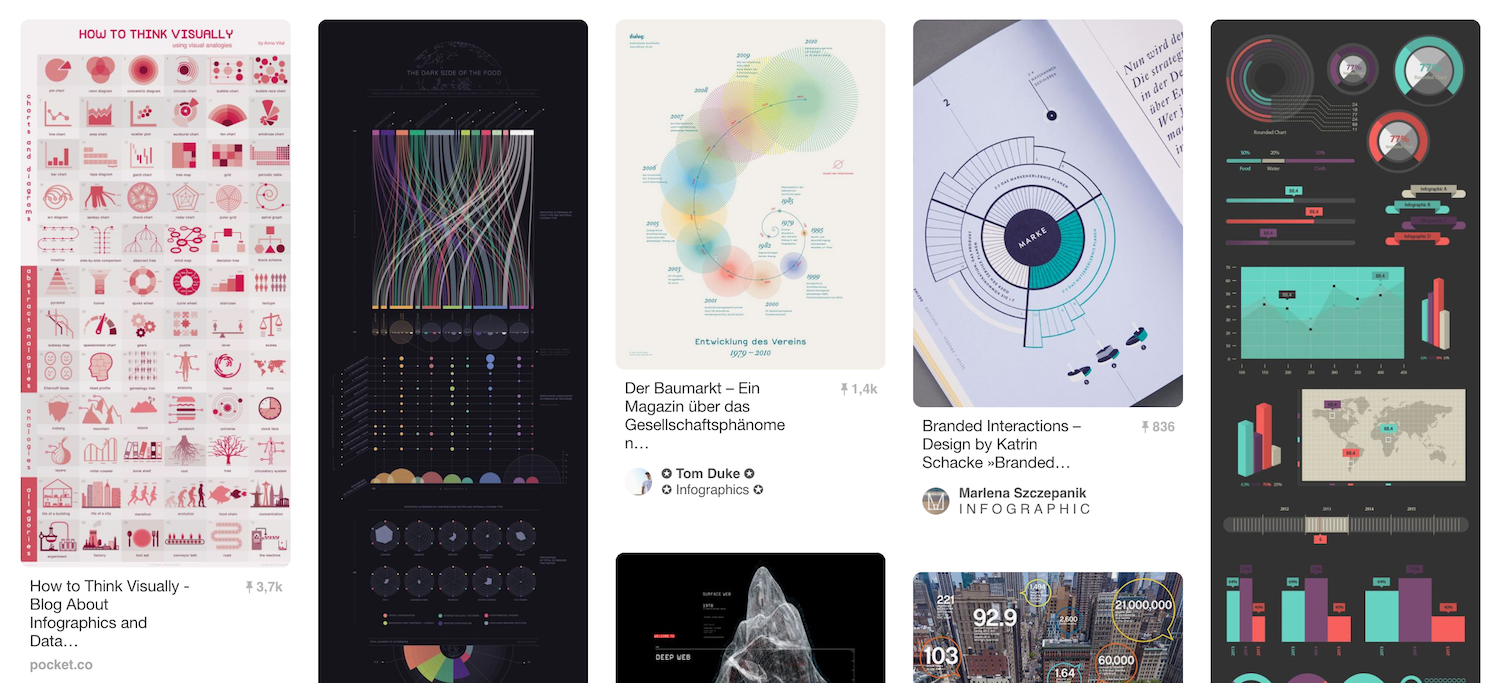
Dashboard
10 Second Rule
Image taken from http://www.dashboardinsight.com/CMS/3f7edc6b-609f-4b54-9e81-8ac7629a2798/Healthcare-performance-dashboard.png
Dashboard
So what...
?
10 Second Rule
Dashboard
Sketch
25
Orders
99
Fails
25
15
70 k
30
k
Calls
Sales / Week
Revenue
Dashboard
Action!
Sketch
Get STARTED

LET OTHERS INVENT THE WHEEL
blackrockdigital.github.io/startbootstrap-sb-admin-2
FRAMEWorkS?
What do we need?
So test therefore, who join forever
Who will use it?
What do we want to spend?

JS FRAMEWorks
ENGINEERING FLOWCHART
Special requirements?
Spend
Money?
Completely crazy new stuff?
Fusion Chart
Highcharts
Zing Charts
...
NO
YES
NO
YES
Google Charts
Flotcharts
Morris.js
ChartJS
...
NO
YES
D3.js
Library based on D3.js

JS FRAMEWorks
HOW TO CHOOSE THE RIGHT ONE
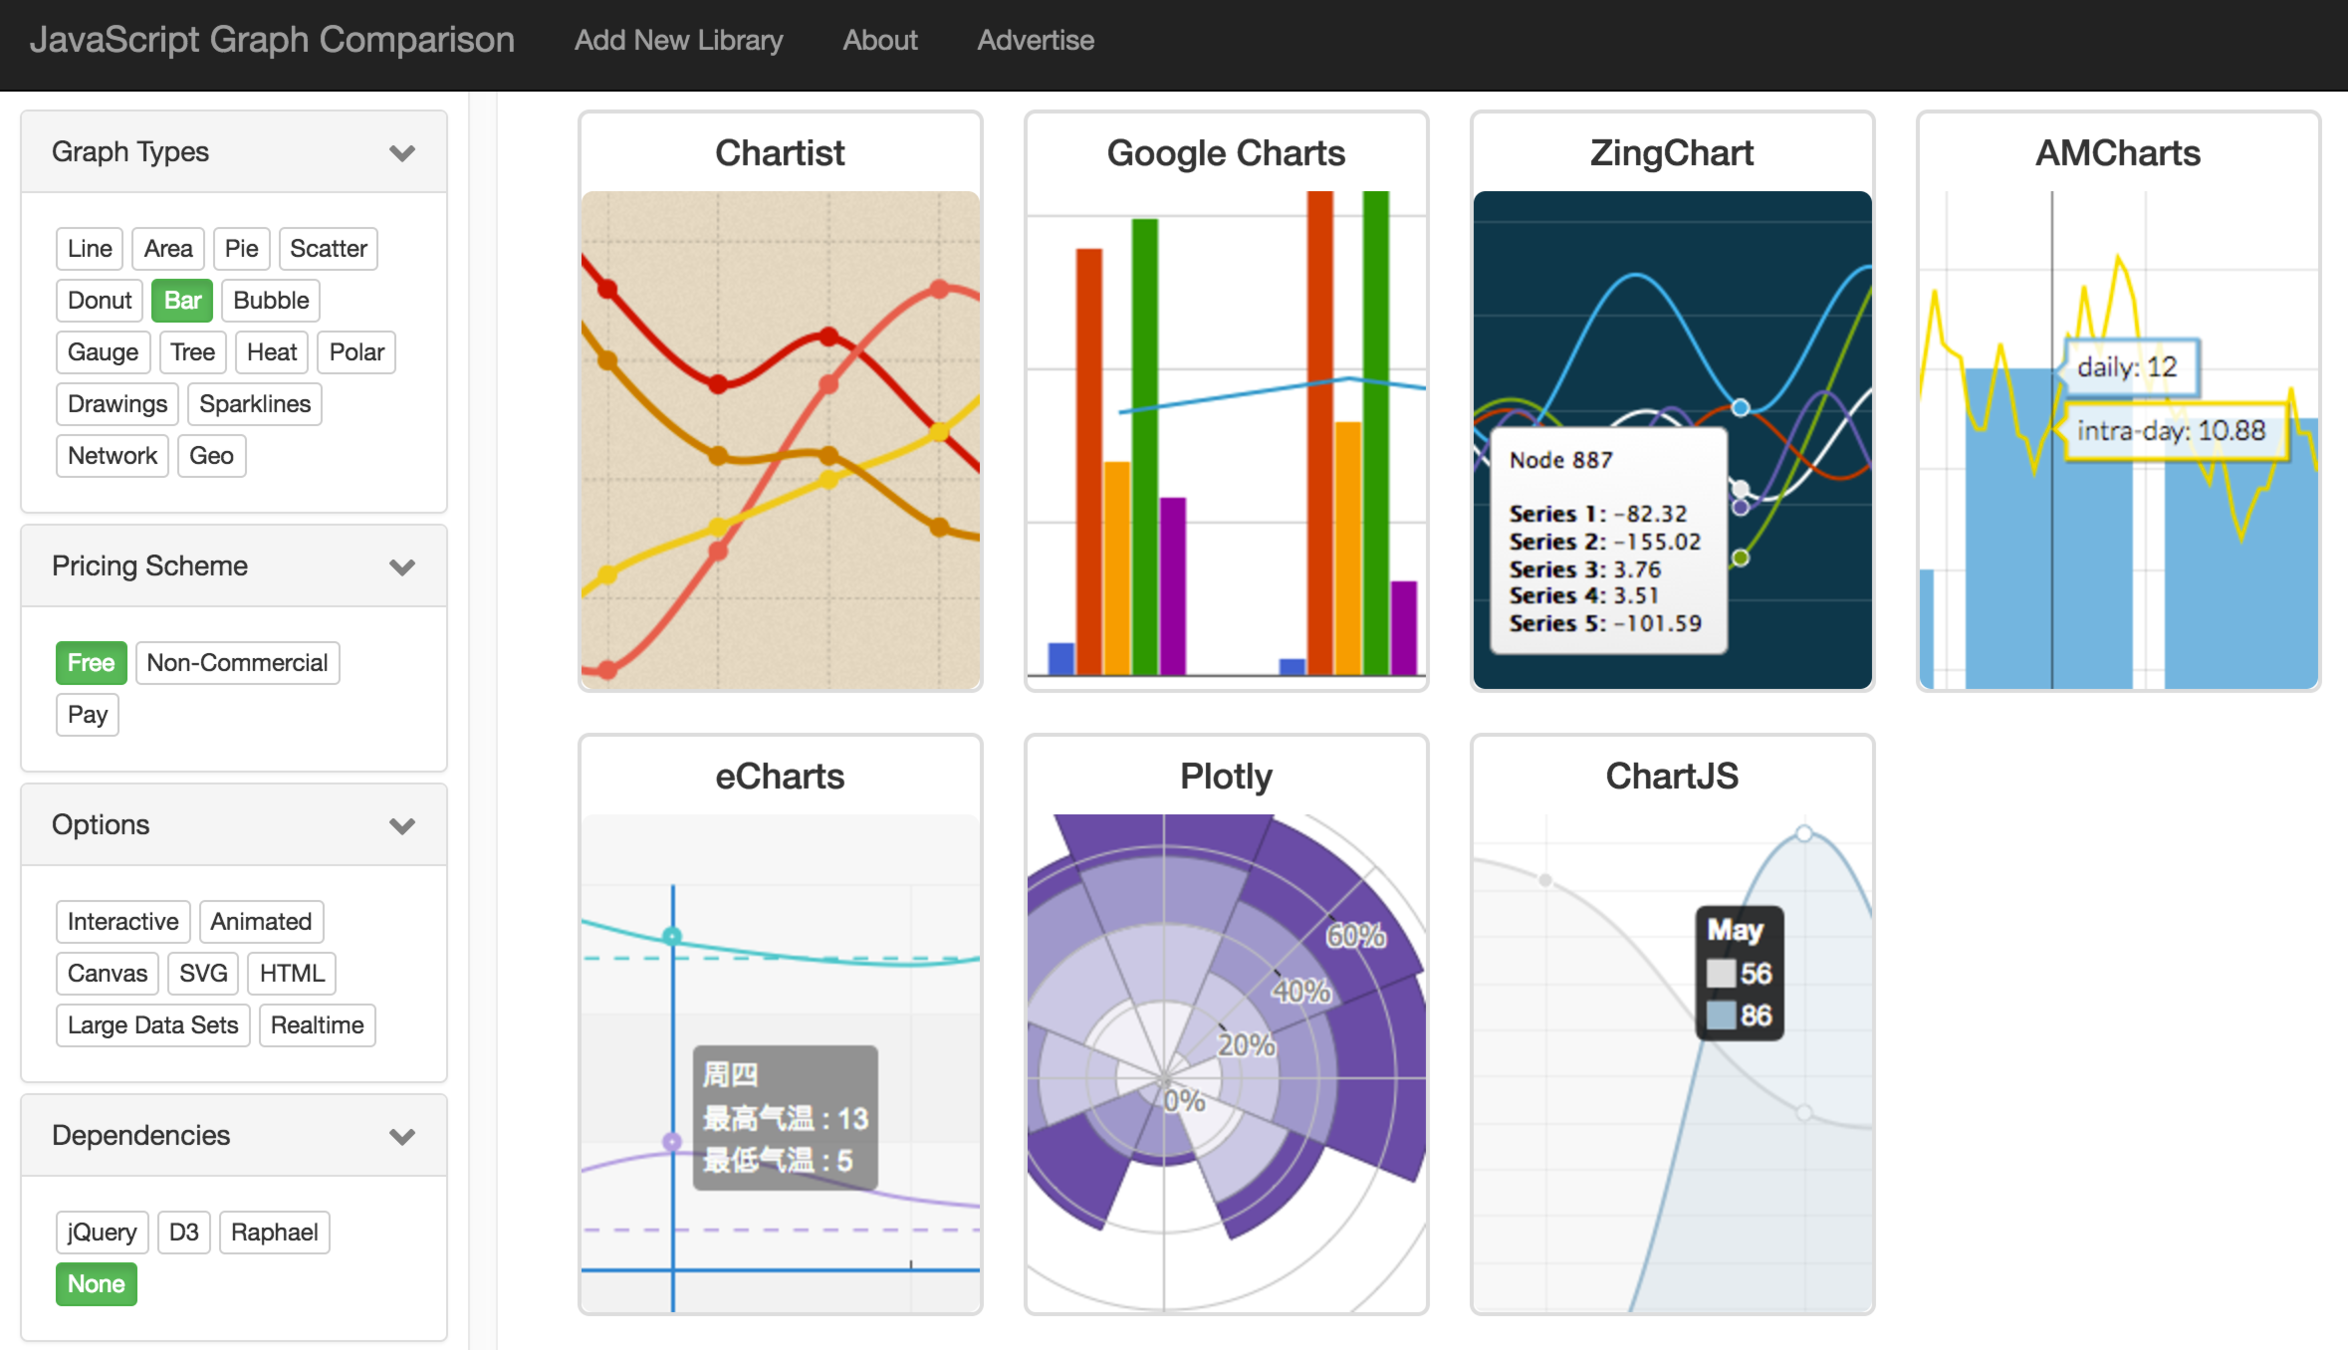
jsgraphs.com
Currently offline :(
Main Difference
Most Libraries
<script>

 d3.select('#content')
    .append('svg')

       .selectAll('rect')

       .data([...])

       .enter()
       .append('rect')
           .attr('x', xValue)
           .attr('y', yValue)

           .attr('height', height)
           .attr('width', width);

</script>
<script>
new Chart({
type: 'bar-chart',
target: '#content',
settings: {
width: '400',
height: '300',
caption: "A / B Testing",
xAxis: "Time",
yAxis: "$$$"
},
data: [...]
}).render();
</script>VS.
D3.js
Let's explore

ScalableVectorGraphics
<rect>
height
width
(x, y)
<circle>
(cx, cy)
r
<line>
(x1, y1)
(x2, y2)
<text>
Description
(x, y)
text
Group
<g>
D3.js Example
<html>
   <head>
      <script src="http://d3js.org/d3.v4.min.js"></script>
   </head>
   <body>
      <div id="content"></div>

      <script>
       d3.select('#content')
            .append('svg')
             .selectAll('rect')

             .data([100, 200, 150, 60, 50])

             .enter()
             .append('rect')
                .attr('x', 0)
                .attr('y', (data, index) => index * 25)

                .attr('height', 20)
                .attr('width', (data, index) => data);
Visible Result

Browser Result
<html>
    <head>
        <script src="http://d3js.org/d3.v4.min.js"></script>
    </head>
    <body>

        <div id="content">
            <svg>
                <rect x="0" y="0" height="20" width="100"></rect>
                <rect x="0" y="25" height="20" width="200"></rect>
                <rect x="0" y="50" height="20" width="150"></rect>
                <rect x="0" y="75" height="20" width="60"></rect>
                <rect x="0" y="100" height="20" width="50"></rect>
            </svg>
        </div>

        <script>[...]</script>

    </body>
</html>
Next STeps
const X_SCALE = (data) =>

    d3.scaleLinear()
        .range([0, 500])
        .domain([0, d3.max(data)]);
Scales
Next STeps
AXIS
chart.append('g')
        .attr('transform', 'translate(0, 100)')
        .call(d3.axisBottom(X_SCALE(data)));
0
200
100
50
150
Next STeps
bar.on('click', () =>

    bars.selectAll('rect')
            .sort((a, b) => d3.ascending(a, b));
);
Interaction: Sort on Click
COMMON MISTAKES
d3.select('#content')

    .append('svg')
    .selectAll('g')
    .data(data)
    .enter()

    .append('g')
    .append('text')
           .attr('x', 0)
           .attr('y', (d, i) => {i * 37})
           .text((d, i) => d.title)

    .append('rect')
           .attr('height', 25)
           .attr('width', (d, i) => d.value * 25)
           .attr('x', 152)
           .attr('y', (d, i) => {i * 37});
Missing Return
Wrong Nesting
Duplicate Functions
Magic Numbers
Done Better
const MARGIN = 12;
const HEIGHT = 25;
const WIDTH_TEXT = 140;

const Y_SCALE = (d, i) => i * (HEIGHT + MARGIN);
const WIDTH_BAR = (d, i) => X_SCALE(data)(d.value);
const TITLE = (d, i) => d.title;

let svg = d3.select('#content').append('svg');

let chart = svg.selectAll('g').data(data).enter().append('g');

chart.append('text')
           .attr('x', 0)
           .attr('y', Y_SCALE)
           .text(TITLE);

chart.append('rect')
           .attr('x', WIDTH_TEXT + MARGIN)
           .attr('y', Y_SCALE)
           .attr('height', HEIGHT)
           .attr('width', WIDTH_BAR);
Lie Factor
Proportion
Scales
10 %
Variant B
20 %
Variant A
50
51
52
100
1000
EARLY Feedback
different data sets & People
Variant A
Variant B
Variant C
Blue Button Test
Red Button Test
Yellow Button Test
- Sun shine
- Some circles
- People sitting around a table
- Strange logo
time
$$$
Better approach
Variant A
Variant B
For A/B Testing
Go 4 Gold!
General
-
policyviz.com/helpmeviz
-
infoactive.co/data-design
-
Information Dashboard Design: The Effective Visual Communication of Data
-
datavizcatalogue.com
-
improving-visualizations.org
-
storytellingwithdata.com
-
blog.tr3dent.com/2016/03/21/top-10-data-visualization-experts-to-follow-on-twitter
-
lisacharlotterost.github.io/2016/04/22/Colors-for-DataVis
GO 4 Gold!
D3
-
github.com/mbostock/d3/wiki
-
bost.ocks.org/mike/
-
bost.ocks.org/mike/chart
-
Getting Started with D3 by Mike Dewar
-
Interactive Data Visualization for the Web by Scott Murray (online for free: alignedleft.com/tutorials/d3/)
-
dashingd3js.com
-
http://techslides.com/over-2000-d3-js-examples-and-demos
-
http://christopheviau.com/d3list/gallery.html
QUESTIONS?
RECOMMENDATIONS?
REMARKS?
What do you think?
!?!
!?!
!?!
!?!
ThankS For
your Attention!
@_lizzelo_
slides.com/elisabethengel/dashboard-visualizations
Credits
comSysto GmbH
GUTEFrage.net GmbH
SKeTCH
Example
IN Depth
SVG
VS.
Canvas
Vector based
Faster on large screens
Events
Browser Inspection
CSS Styling
Import / Export
Accessibility
Pixel based
Faster for many objects
D3.js can
handle both
Updating Data
Document
A
B
C
D
E
NEW DATA
F