Cerebrovascular Reactivity and its impact
on functional activity
PhD defence, November 2, 2021
Stefano Moia
Supervisors:
Dr. César Caballero-Gaudes
Dr. Maite Termenón


1. What is Cerebrovascular Reactivity (CVR)
2. How can we improve CVR estimation?
4. Does CVR have an impact on functional activity?
3. Are there any factors affecting CVR?
Quick recall: BOLD effect


Cerebrovascular Reactivity
Cerebrovascular Reactivity (CVR) is the response of cerebral vessels to a vasoactive stimulus (e.g. CO2) to provide sufficient O2 to cerebral tissues¹

1. Liu et al. 2018 (Neuroimage); 2. Pinto et al. 2021 (Front. Physiol.)
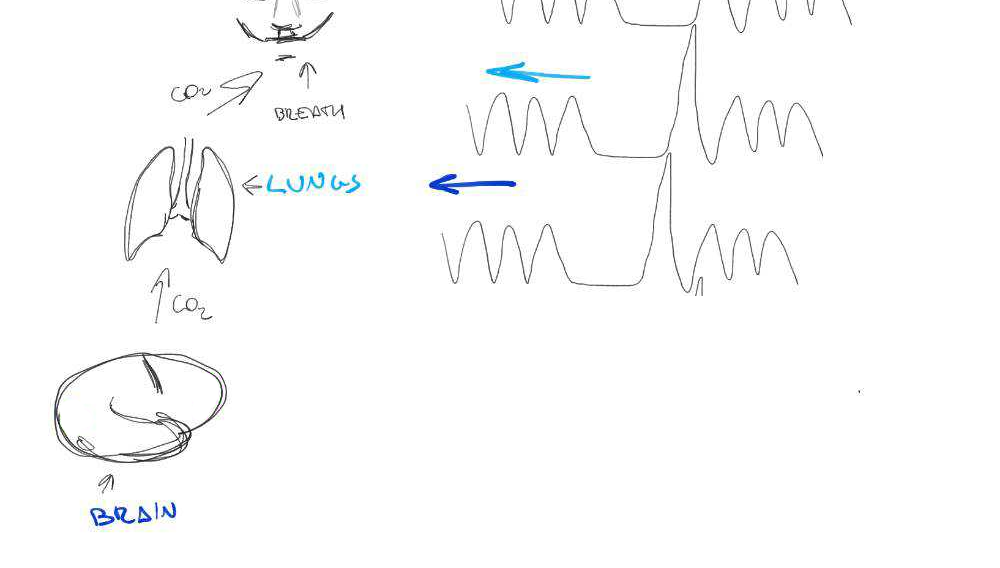
CVR can be measured during BOLD fMRI experiments with Breath-holds (BH), that induce the subject into a state of hypercapnia²
The vessels dilate → Increase of blood flow → Increase of %BOLD signal
CVR mapping [%BOLD/mmHg] can be obtained through a linear regression analysis using the recordings of exhaled CO2 (reliable proxy of CO2 partial pressure in arterial blood)
CVR is a vascular response
to CO2 changes that can be estimated with respiratory tasks and BOLD imaging.
Take home message #1

(but CVR \(\not = \) BOLD)
BH-induced CVR: Issues
Two problems:
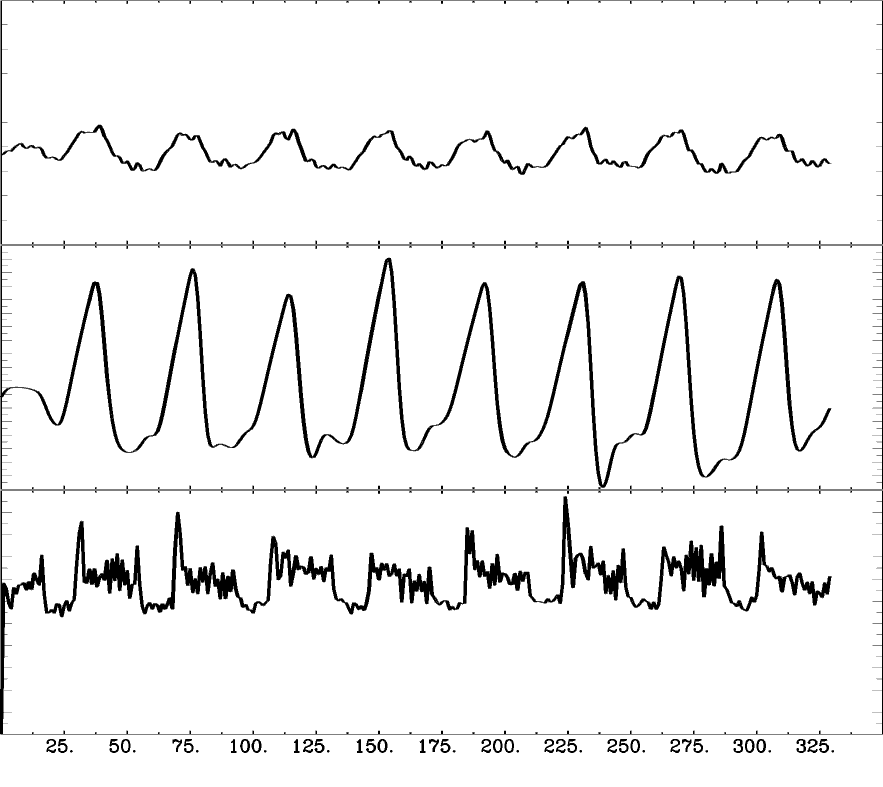
- There's a measurement delay, and regional variations of the physiological delay
- The BH task presents collinear motion to signal of interest



Motion
CO2
BOLD
BH-induced CVR: Issues
Two problems:
- There's a measurement delay, and regional variations of the physiological delay
- The BH task presents collinear motion to signal of interest


Motion
CO2
BOLD

1. What is Cerebrovascular Reactivity (CVR)
2. How can we improve CVR estimation?
4. Does CVR have an impact on functional activity?
3. Are there any factors affecting CVR?
Lag optimisation
Different methods have been proposed to take into account the lag of CVR:
cross-correlation (RIPTiDe)¹,
Lagged GLM (L-GLM)²,
bayesian estimation³, ...

1. Frederick et al. 2012 (NeuroImage); 2. Sousa et al. 2014 (NeuroImage)
3. https://github.com/physimals/quantiphyse-cvr; 4. Moia, Stickland, et al. 2020 (EMBC)

→
→
→
→
→
→
→
→

An important factor to take into account is to set up denoising and CVR estimation simultaneously⁴

[Moia, Stickland, et al. 2020 (EMBC)]

1. Frederick et al. 2012 (NeuroImage); 2. Sousa et al. 2014 (Neuroimage)
CVR estimates optimisation
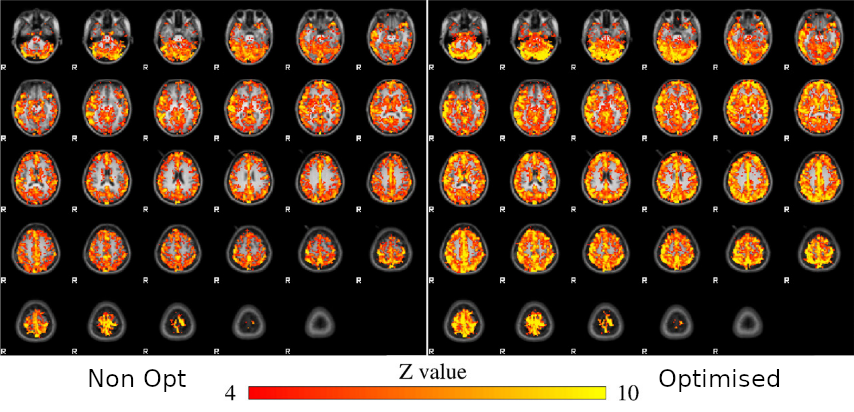
Different methods have been proposed to take into account the lagged CVR:
- RIPTiDe: cross-correlation (X-corr)¹
- Lagged GLM after orthogonalising signal of interest to noise²

Sequential vs Simultaneous denoising
Performing denoising in sequential steps, rather than in parallel, might reintroduce removed artefacts
Lindquist et al. 2019 (Hum. Brain Mapp.)


Methods: CVR and lag maps

CVR and lag maps: L-GLM with each lagged regressor and nuisance regressors (12 motion parameters and low frequency trends), voxelwise selection of the lagged model with highest explained variance (R²), normalisation to MNI152 template (2.5 mm isotropic)
We compared four pipelines:
- L-GLM with motion parameters (see above, SimMot): $$ Y = P_{ET}CO_2{hrf}_{vx} + Mot + Poly + n $$
- Non-optimised CVR map (measurement delay only, Non Opt): $$ Y = P_{ET}CO_2{hrf}_{bulk} +n $$
- L-GLM without motion parameters (NoMot): $$ Y = P_{ET}CO_2{hrf}_{vx} + n $$
- L-GLM without motion parameters, motion regressed out before (SeqMot): $$ [Y \perp (Mot,Poly)] = P_{ET}CO_2{hrf}_{vx} + n $$
Results: lag optimisation
| CNR of lag maps | SimMot | SeqMot | NoMot |
|---|---|---|---|
| GM-WM | 0.52 ±0.21 | 0.46 ±0.26 | 0.49 ±0.25 |
| GM-Putamen | 0.47 ±0.22 | 0.44 ±0.21 | 0.44 ±0.21 |
| GM-Cerebellum | 0.82 ±0.15 | 0.69 ±0.17* | 0.69 ±0.16* |


Non optimising leads to underestimate the CVR, especially in subcortical areas.
Lag maps show anatomical consistency
→
→
→
→
→
→
→
→
Different lag responses, coherent with previous evidence (e.g. Putamen has earlier response than GM)
→
→
→
Area mostly affected by motion! →

Moia, Stickland, et al. 2020 (EMBC)
To improve CVR estimates, compute lagged-regression of signal of interest and noise simultaneously.
Take home message #2

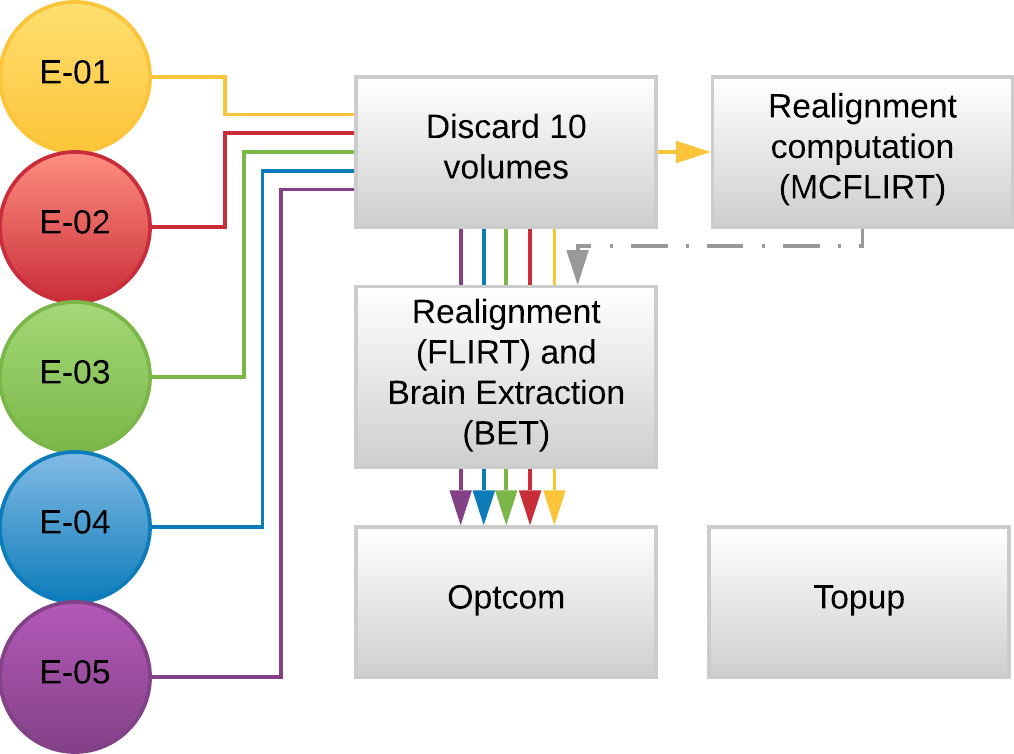
Methods: Preprocessing
- MP2RAGE and T2w skullstripped (AFNI)
- MP2RAGE normalised to MNI152 template (ANTs)
- T2w registered to MP2RAGE and to SBREF (FSL)
- MP2RAGE segmented and GM registered to SBREF (ANTs)
- GM eroded (FSL)
- EPI realigned to SBREF, saved the motion parameters (ANTs)
- EPI skullstripped (FSL)
- EPI distortion corrections (FSL)


Methods: Analysis
- Peaks detection in exhaled CO2 traces
- Amplitude envelope (PETCO2) convolved with HRF
- Find max correlation of PETCO2 and average GM
- PETCO2 signal shifted between -9 and +9 sec
- Shifted regressors interpolated at the TR
- Compute GLM with each lagged regressor and nuisance regression (12 motion parameters and low frequency trends)
- For each voxel, select the lagged model with highest explained variance (R²)

For comparison:
- Computed non-optimised CVR map (measurement delay)
- Computed GLM with each regressor, without motion parameters
- Computed GLM with each regressor, after motion was regressed out
↓
optimised CVR map and lag map
ICA denoising
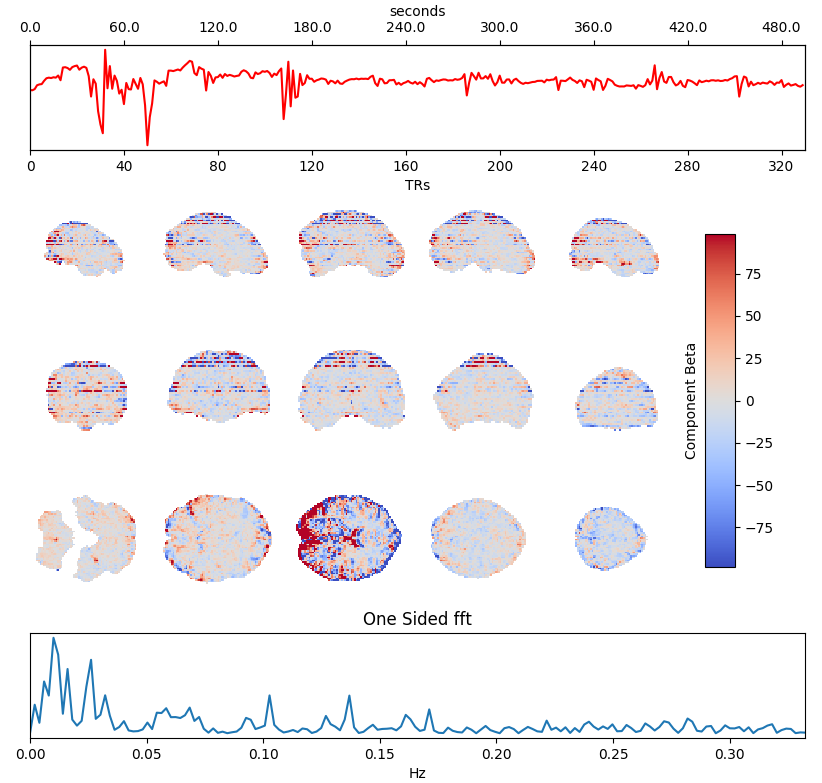
Independent Component Analysis (ICA) is commonly used to remove motion effects and other sources of noise from fMRI data


Motion
Motion + MB artefact
CSF pulsations
Griffanti et al. 2014 (NeuroImage), 2017 (NeuroImage), The tedana Community et al. 2021 (Zenodo)

Multi Echo (ME-fMRI)
- Single Echo (SE): during fMRI acquisition we collect the signal once per TR at a certain TE to obtain one timeseries per voxel
-
Multi Echo (ME): we collect the signal multiple times at different TEs to obtain n timeseries per voxel


TR
BOLD [a.u.]
Multi Echo (ME-fMRI)
- Single Echo (SE): during fMRI acquisition we collect the signal once per TR at a certain TE to obtain one timeseries per voxel
-
Multi Echo (ME): we collect the signal multiple times at different TEs to obtain n timeseries per voxel


TR
BOLD [a.u.]
Optimal combination
For each voxel and TR, we can Optimally Combine the echo volumes with a weighted sum based on their contribution to \( T_2^{\star} \)
In this way, spatial CNR and tSNR are maximised and the signal can be recovered in areas of drop-out


Posse et al. 1999 (Magn Reson Med)
ME-ICA
Assuming monoexponential decay, we can express the
signal percentage change as:
\[ S_{SPC} \approx \Delta\rho - TE \cdot \Delta R_2^{\star} + n \quad where \enspace R_2^{\star} = \frac{1}{T_2^{\star}} \]
This let us differentiate BOLD-related (\(\Delta R_2^{\star}\)) from non-BOLD related (\(\Delta\rho\)) changes


Kundu et al. 2012 (NeuroImage)
If we apply ICA, we can fit the timeseries of the components to either sub-models and automatically classify them
Which ICA denoising?

What is the best way to denoise BH data after ICA?
being too aggressive might remove the signal of interest,
but being too conservative might keep too much noise in the model.

EuskalIBUR
* TR = 1.5 s, TEs = 10.6/28.69/46.78/64.87/82.96 ms, MB acceleration factor = 4, GRAPPA = 2, voxel size = 2.4x2.4x3 mm³
10 neurotypical subjects
(5F, age 25-40y)


10 sessions, one week apart, same time of the day

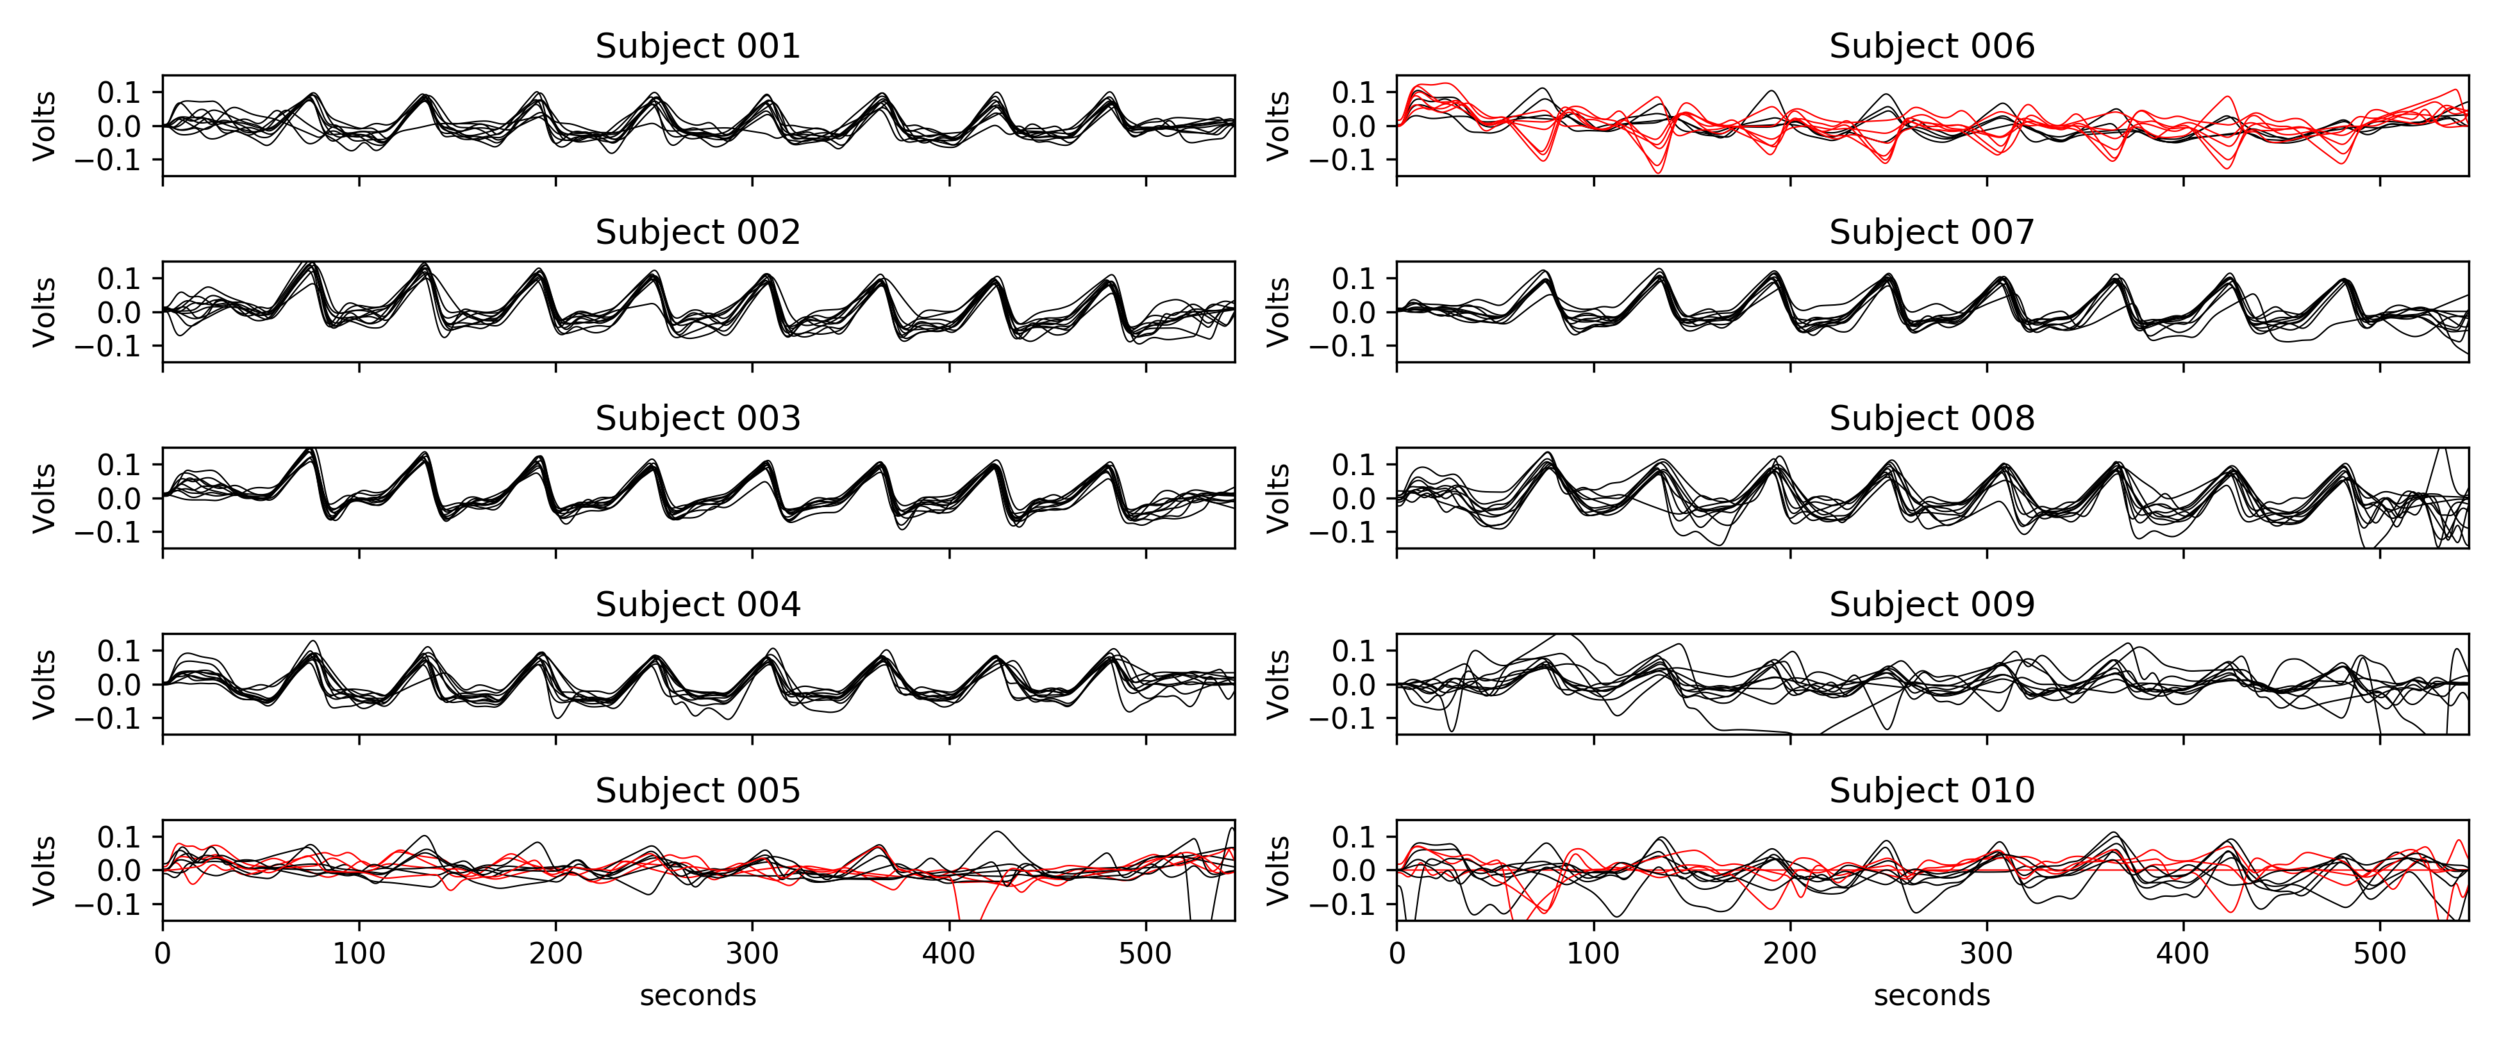
BH paradigm: ME-fMRI (Gradient Echo EPI)
+ SBREF image
T2w, MP2RAGE (T1w), 4 RS,
3 tasks, and BH paradigm
CO2 and O2
sampling

↑
Methods: preprocessing

Functional:
- motion realignment
- skullstripping
- optimal combination (OC)
- distortion correction
CO2 traces:
- (supervised) peak detection
- linear interpolation of peaks and convolution with HRF
- cross-correlation with average GM signal
- creation of lagged regression (range: ±9 s, step: 0.3 s)
- interpolation to fMRI TR
Methods: ME-ICA based denoise
What is the best way to denoise BH data after ICA?
being too aggressive might remove the signal of interest,
but being too conservative might keep too much noise in the model.
- Aggressive model: nuisance regression using only noise ICA-components (ME-AGG): $$ Y_{OC} = P_{ET}CO_2{hrf} + Mot + Poly + [IC_{rej} \perp (Mot,Poly) ] + n $$
- Moderate model: noise components are orthogonalised w.r.t. the CO2 trace (ME-MOD): $$ Y_{OC} = P_{ET}CO_2{hrf} + Mot + Poly + [IC_{rej} \perp (P_{ET}CO_2{hrf},Mot,Poly) ] + n $$
- Conservative model: noise components are orthogonalised w.r.t. the CO2 trace and the other components (ME-CON): $$ Y_{OC} = P_{ET}CO_2{hrf} + Mot + Poly + [IC_{rej} \perp (P_{ET}CO_2{hrf},IC_{acc},Mot,Poly) ] + n $$
- Optimal combination only (OC-MPR): $$ Y_{OC} = P_{ET}CO_2{hrf} + Mot + Poly + n $$
- Single echo only (second echo used as proxy, SE-MPR): $$ Y_{SE} = P_{ET}CO_2{hrf} + Mot + Poly + n $$

We set up a simultaneous estimation and denoise step, considering motion parameters,
their derivative, Legendre polynomials to the fourth order, and:
- Aggressive model: nuisance regression using only noise ICA-components (ME-AGG): $$ Y_{OC} = P_{ET}CO_2{hrf} + Mot + Poly + [IC_{rej} \perp (Mot,Poly) ] + n $$
- Moderate model: noise components are orthogonalised w.r.t. the CO2 trace (ME-MOD): $$ Y_{OC} = P_{ET}CO_2{hrf} + Mot + Poly + [IC_{rej} \perp (P_{ET}CO_2{hrf},Mot,Poly) ] + n $$
- Conservative model: noise components are orthogonalised w.r.t. the CO2 trace and the other components (ME-CON): $$ Y_{OC} = P_{ET}CO_2{hrf} + Mot + Poly + [IC_{rej} \perp (P_{ET}CO_2{hrf},IC_{acc},Mot,Poly) ] + n $$
- Optimal combination only (OC-MPR): $$ Y_{OC} = P_{ET}CO_2{hrf} + Mot + Poly + n $$
- Single echo only (second echo used as proxy, SE-MPR): $$ Y_{SE} = P_{ET}CO_2{hrf} + Mot + Poly + n $$
Methods: ME-ICA based denoise

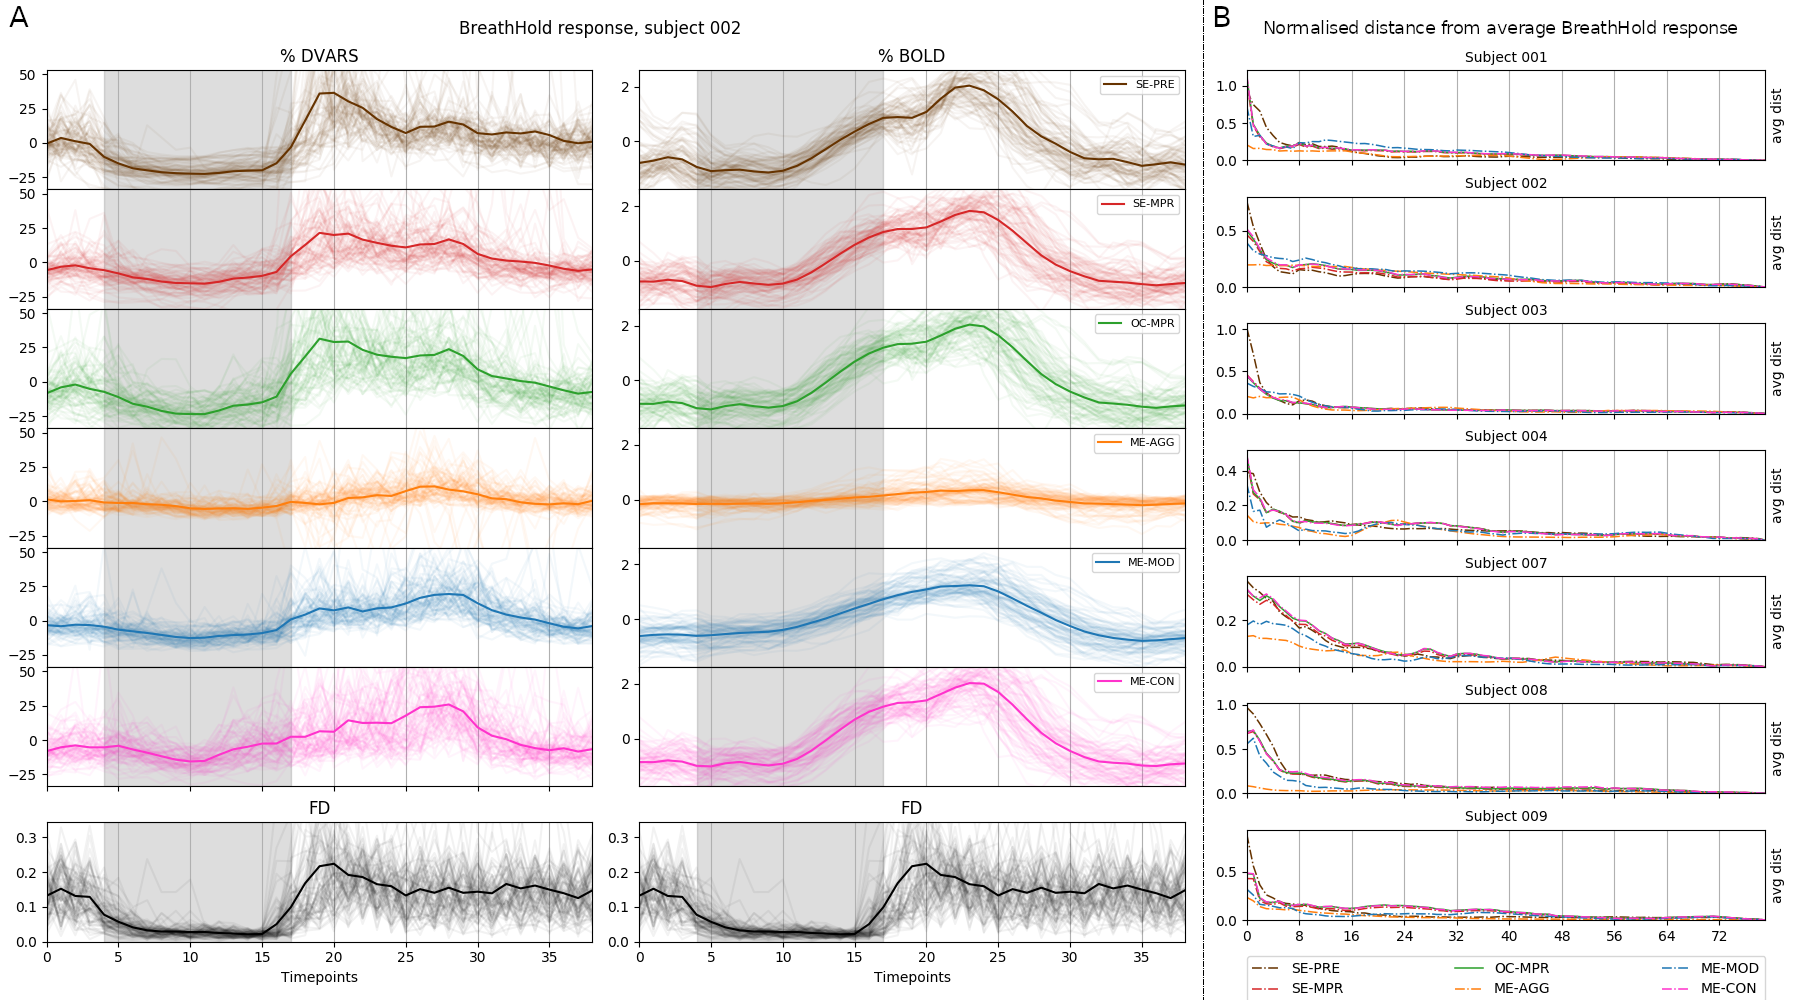
- their effect in terms of making signal (DVARS) independent of motion (FD) [LME]: $$DVARS_t = \sqrt{\lang [I_t(x) - I_{t-1}(x)]^2}$$ $$FD_t=|\Delta d_x|+|\Delta d_y|+|\Delta d_z|+|\Delta \alpha |+|\Delta \beta|+|\Delta \gamma |$$
$$DVARS\sim FD\ast model+(1|subject)+(1|session)$$
- the resulting CVR and lag maps spatially [LME]: $$X\sim model+(1|subject)+(1|session)$$
- the resulting CVR and lag maps' reliability [ICC]: $$X \sim (1|subject)+(1|session)$$
We compared:
Alternative ICA based denoise (sequential)

What is the best way to denoise the data after ICA?
Regression based:
Aggressive approach: nuisance regression using only the rejected components.
Non aggressive (partial regression) approach: all the components are considered, but only the rejected components are regressed out of the data.
Orthogonalised approach: the rejected components are orthogonalised with respect to the other components.
4D-based approach (similar to M/EEG): reconstruct volumes on noise, then subtract it from the original data.
\( Y = \) \(A\) \(+\) \(R\) \(+ n \)
Multivariate:
Alternative ICA based denoise (sequential)


Effect of denoising approach is significant for slope (F(5,354)=177.6, p<0.001) and intercept (F(5,354)=225.7, p<0.001) of the linear regression model
DVARS vs FD
Group level, DVARS vs FD
Slope
Intercept
↓
↓

Alternative ICA based denoise (sequential)


Average % BOLD and DVARS across all trials
↑
↑
↓
↓
↓
↓
↓
Aggressive denoise removes signal of interest
OC and E-02 denoise affects the signal of interest more than ICA denoise
↑
↑
↑
↑

Alternative ICA based denoise (sequential)


Lag reliability
CVR reliability

Results: motion removal
Moia et al. 2021 (NeuroImage)


\( \cdot \) timepoint \( - \) session
Results: CVR amplitude maps

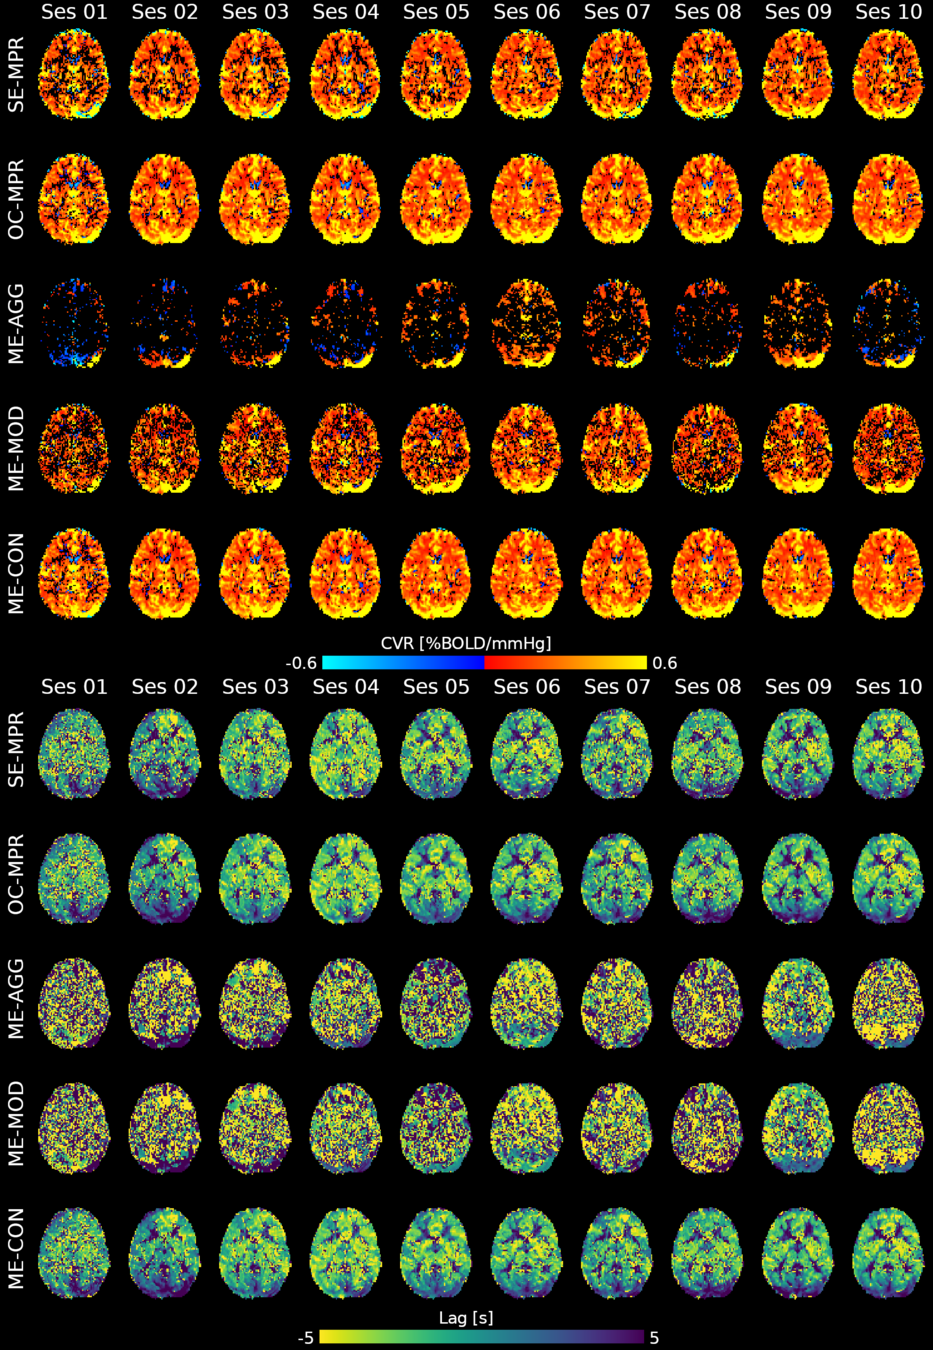


Moia et al. 2021 (NeuroImage)
Results: lag maps


Moia et al. 2021 (NeuroImage)
Results: lag maps


Moia et al. 2021 (NeuroImage)

Results: model comparison

Moia et al. 2021 (NeuroImage)


CVR amplitude
CVR lag
CVR amplitude
CVR lag


Results: model comparison

Moia et al. 2021 (NeuroImage)


CVR amplitude
CVR lag
CVR amplitude
CVR lag


Results: model comparison

Moia et al. 2021 (NeuroImage)


CVR amplitude
CVR lag
CVR amplitude
CVR lag


Reliability [ICC (2,1)]


Moia et al. 2021 (NeuroImage)

OC-MPR vs ME-CON


ME-CON should be better than OC-MPR in temporal-dependent application
Example of application: timeseries clustering (Self-Organising Maps, 20 clusters)


Submitted to ISMRM 2022
Conclusion

In data characterised by global responses and high motion collinearity, such as CVR, a conservative ICA-based approach best removes motion-related effects, while obtaining reliable responses, but a simple optimal combination of ME data provides similar estimations
However, further examinations are required to translate these observations to paradigms with lower collinear motion and more focal responses (e.g. functional task), or in which there is no task information available (e.g. rest)
We plan to repeat the same experiment with the other acquisitions in EuskalIBUR, considering both statistical maps and temporal properties (e.g. connectome)
An ICA-based conservative denoising improves BH-induced CVR mapping, but a simpler optimal combination of ME data could be already sufficient.
Take home message #1


1. What is Cerebrovascular Reactivity (CVR)
2. How can we improve CVR estimation?
4. Does CVR have an impact on functional activity?
3. Are there any factors affecting CVR?
CVR and blood pressure
Due to its nature as homeostatic and cerebrovascular process, CVR is modulated by systemic changes in blood pressure¹
1. Fierstra et al. 2013 (J. Physiol.); 2. e.g. Hetzel et al. 1999 (Stroke)
Previous studies with Transcranial Doppler Ultrasound suggest to take into account blood pressure when measuring CVR²
To our knowledge, the impact of blood pressure on BOLD-fMRI based CVR estimation has not been assessed yet

EuskalIBUR
10 neurotypical subjects
(5F, age 25-40y) (3 discarded)
10 sessions, one week apart, same time of the day

Vital signs (VS), measured before the MRI session, while the subject was lying supine on a bed, once on the left arm and once on the right arm:
- Cardiac pulse
- Blood pressure (systolic and diastolic)
We averaged the two measurements and computed the Mean Arterial Pressure (MAP) and the Pulse Pressure (PP):
Methods: effect of pressure
We used 3dLMEr¹ to set up the following LME models:
Results were thresholded at \(p<0.05\) after controlling for false discovery rate²
1. Chen et al. 2013 (Neuroimage); 2. Benjamini et al. 2006 (Biometrika)

*maps were smoothed 5mm FWHM


Methods: effect of pressure
We smooth CVR and lag maps using a dilated GM mask (white mask below) and a FWHM of 5mm (voxel size 2.5 isometric) before running 3dLMEr.

Correlation between VSs


Correlation between VSs


Results: blood pressure


Results: blood pressure


Results: blood pressure

Both MAP and PP should be taken into account in CVR experiments, especially in comparisons between subjects or between regions!

Results: sex
- Females show higher CVR than males in most of the GM
- Previous studies report CVR higher in females¹, in males², or no differences between the two³
- A possible cause of this difference might be related to hormonal changes during the menstrual cycle
1. Kastrup et al. 1997, 1998 (Stroke), Tallon et al. 2020 (Exp. Psychol.); 2. Kassner et al. 2010 (J. Magn. Reson. Imaging)
3. Chen et al. 2021 (Int. J. Imaging Syst. Technol.), Jiménez Caballero et al. 2006 (Rev Neurol)


Results: sex


Increased blood pressure
results in localised increases in CVR.
The sex of the participant can affect CVR too.
Take home message #2


1. What is Cerebrovascular Reactivity (CVR)
2. How can we improve CVR estimation?
4. Does CVR have an impact on functional activity?
3. Are there any factors affecting CVR?
An alternative estimation of CVR (?)

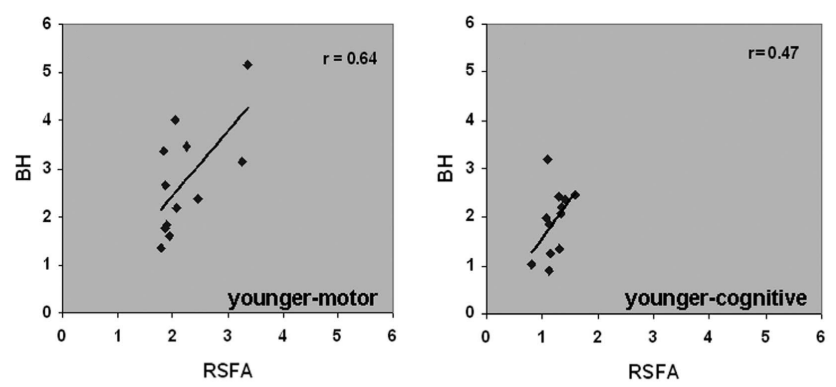
2. Golestani et al. 2016 (NeuroImage)

Estimating CVR with a BH task requires compliant subjects and
dedicated equipment, making it harder to adopt in clinical practice
As a cheaper and feasible alternative, previous literature suggests to use
Resting State fluctuations measures (RSF), such as:
- Resting State Fluctuations Amplitude (RSFA)¹
- [fractional] Amplitude of Low Frequency Fluctuations ([f]ALFF)²
1. Kannurpatti et al. 2014 (PloS ONE)

An alternative estimation of CVR (?)

Text
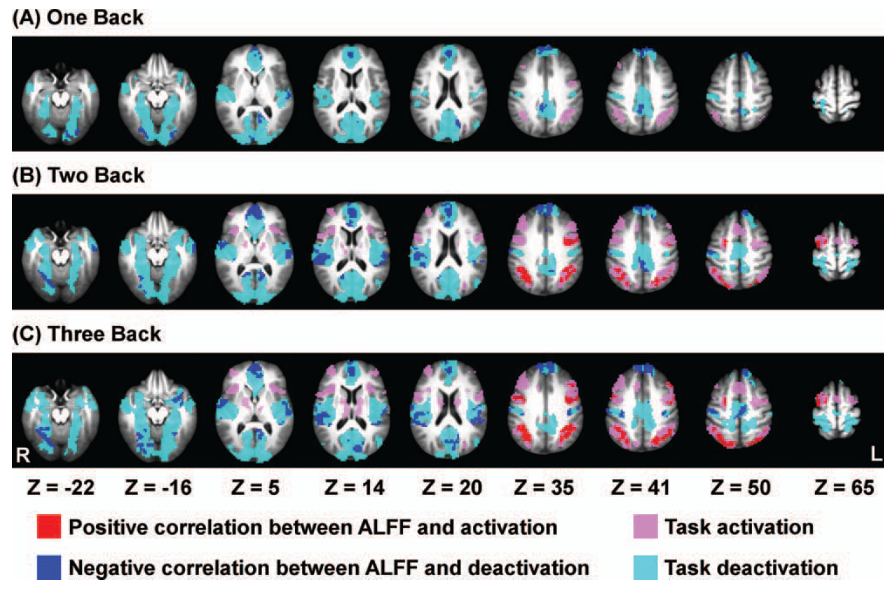
[Zou et al. 2013 (Hum. Brain Mapp.)]
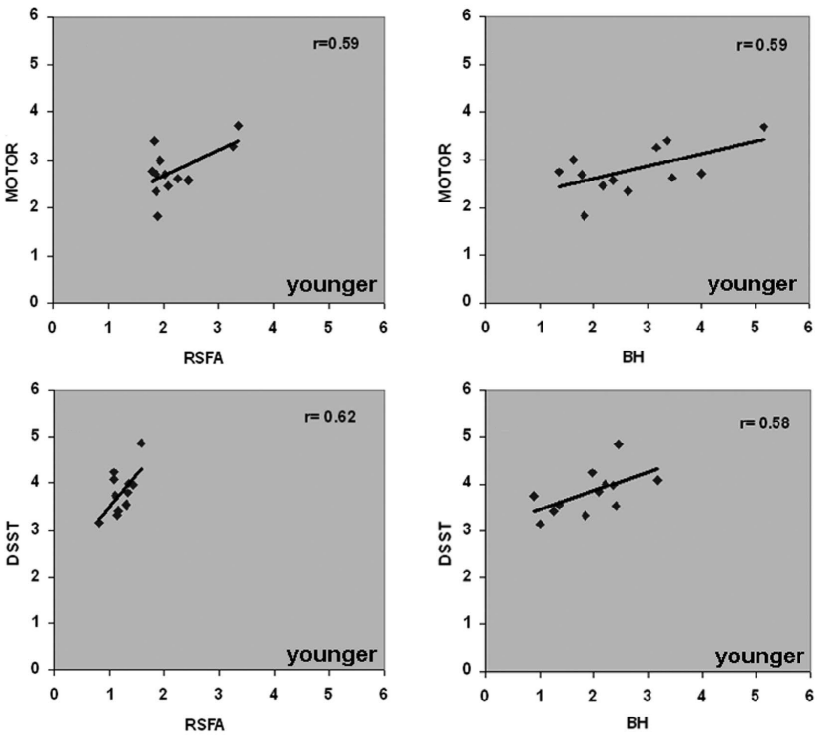
[Kannurpatti et al. 2014 (PLoS ONE)]
[Mennes et al. 2011 (NeuroImage)]


Data


- The first RS of the session
- A motor task
- A Simon task (executive functions)

We preprocessed RS, motor, and Simon data similarly to CVR
We computed:
- RSFA, ALFF, and fALFF from the first RS session
- task Induced Activation (tIA) of Motor task, as each movement vs sham
- tIA of Simon task, considering congruent or incongruent responses
- RSFA, ALFF, and fALFF from the first RS session
- task Induced Activation (tIA) of Motor task, as each movement vs sham
- tIA of Simon task, considering congruent or incongruent responses
We selected:
Methods: effect of CVR on fMRI
Results were thresholded at \(p<0.05\) after controlling for false discovery rate³
(then at \(p<0.001\) uncorrected)
1. Chen et al. 2013 (Neuroimage); 2. Golestani et al. 2016 (NeuroImage); 3. Benjamini et al. 2006 (Biometrika)

We used 3dLMEr¹ to set up the following LME models voxelwise (R syntax):
- \(RSF \sim cvr + (cvr|session) + (cvr|subject)\)
- \(tIA \sim RSF + (RSF|session) + (RSF|subject)\)
- \(tIA \sim cvr + (cvr|session) + (cvr|subject)\)
We used the first model considering the average GM value of RSF and CVR²
- \(RSF \sim cvr + (cvr|session) + (cvr|subject)\)
- \(tIA \sim RSF + (RSF|session) + (RSF|subject)\)
- \(tIA \sim cvr + (cvr|session) + (cvr|subject)\)
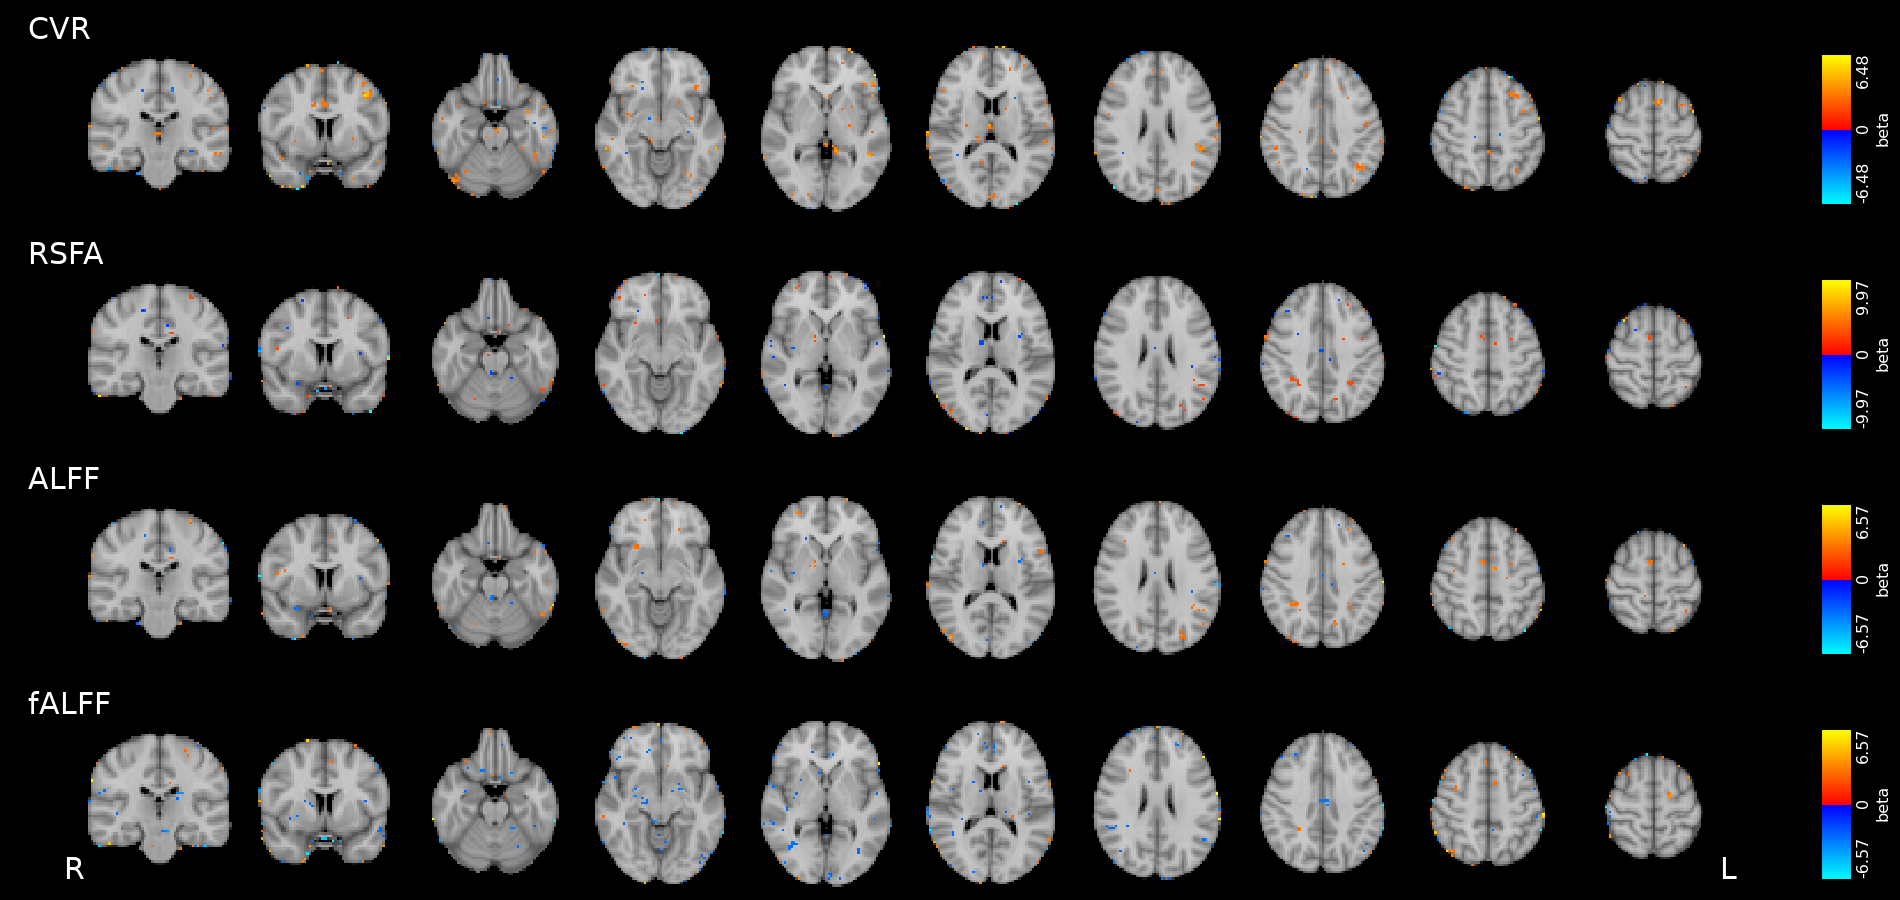
Results: CVR and RSF

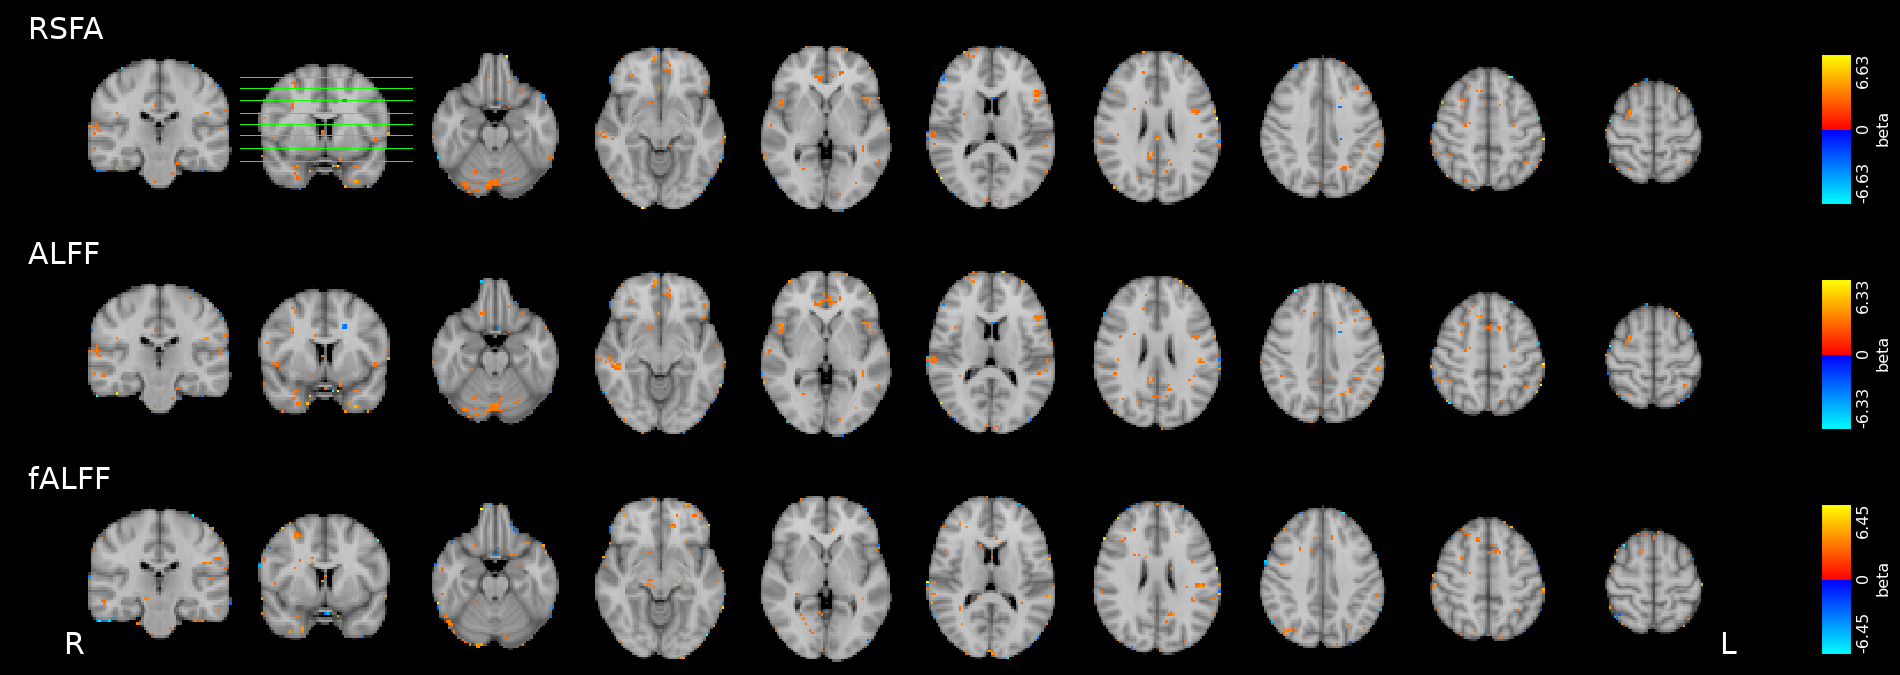
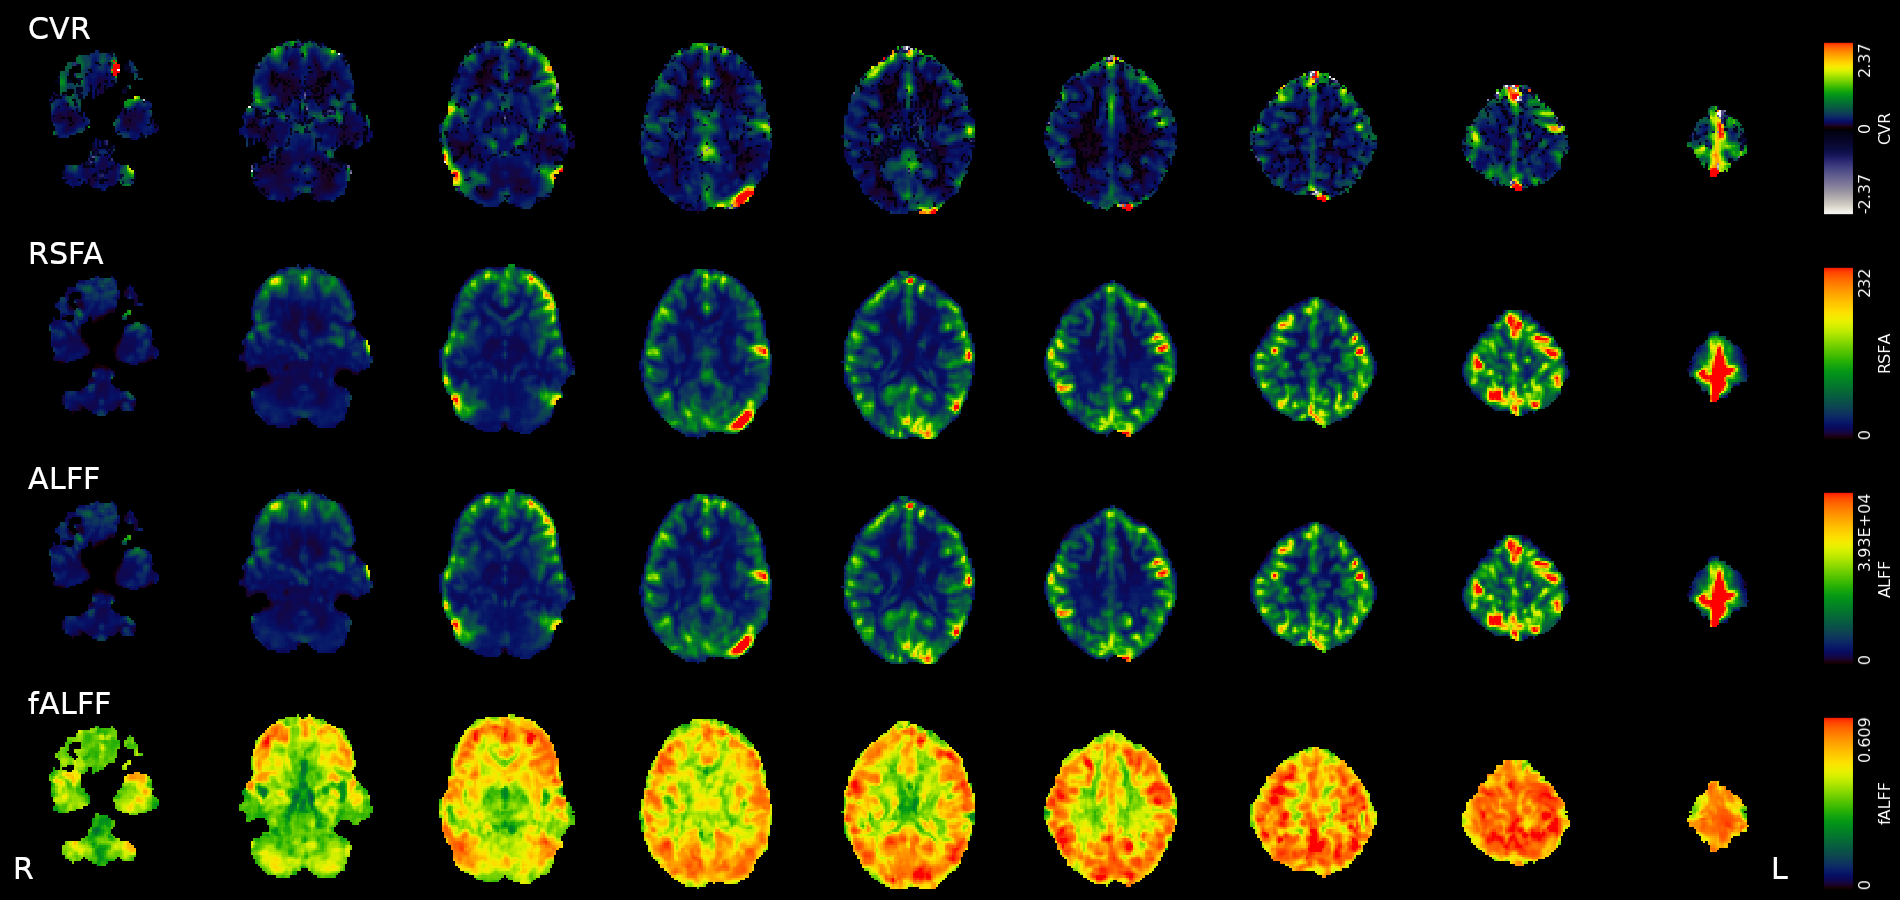
Physiology and RSF

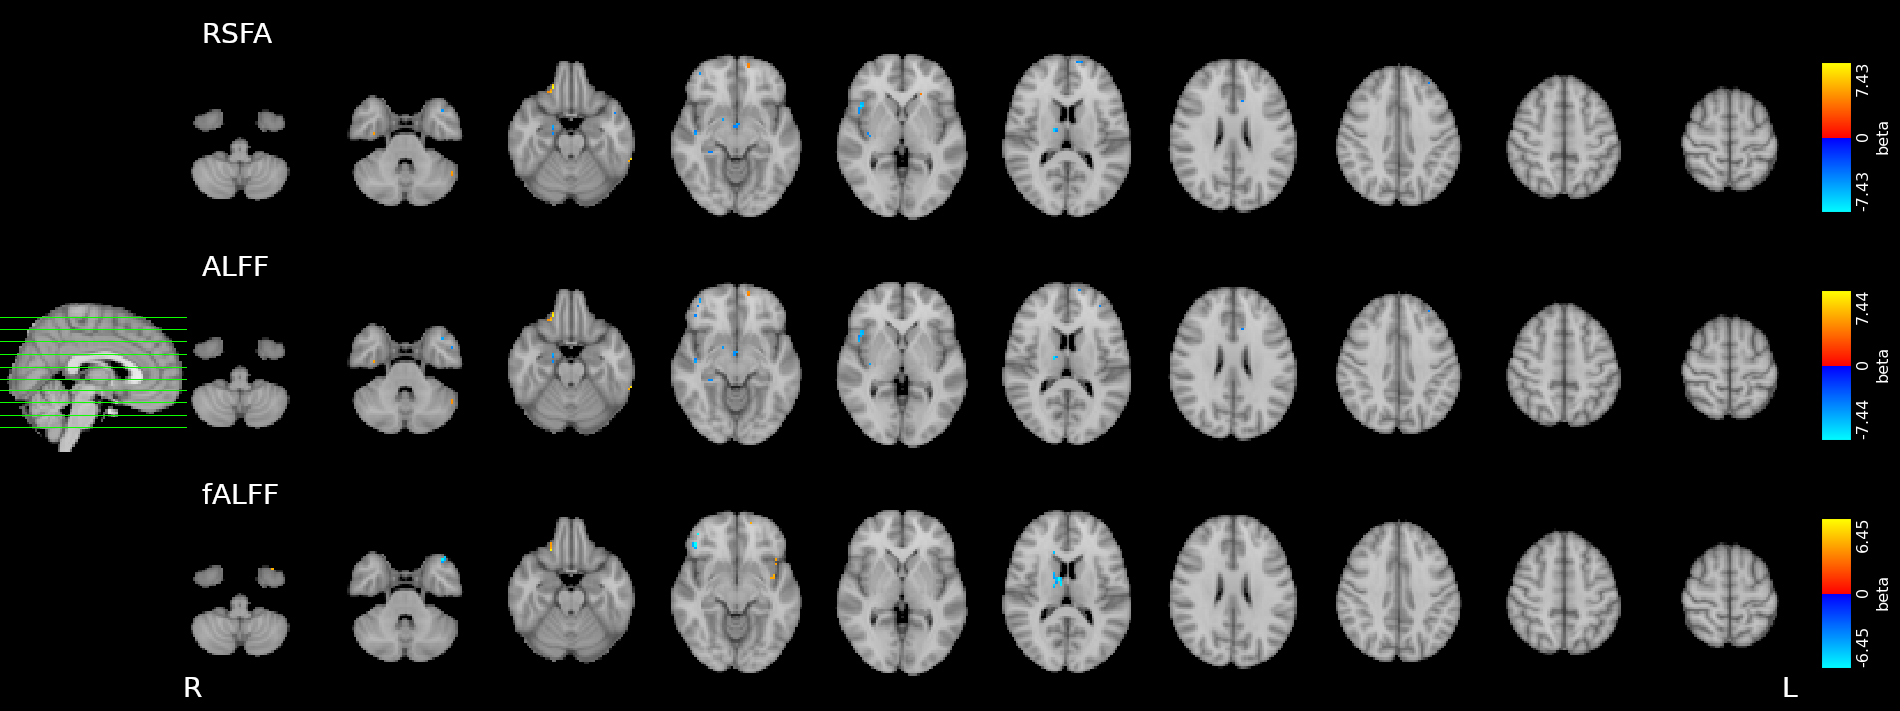
We used 3dLMEr¹ to set up the following LME models (R syntax):
Effect of Sex
Only sex had a significant effect on RSF
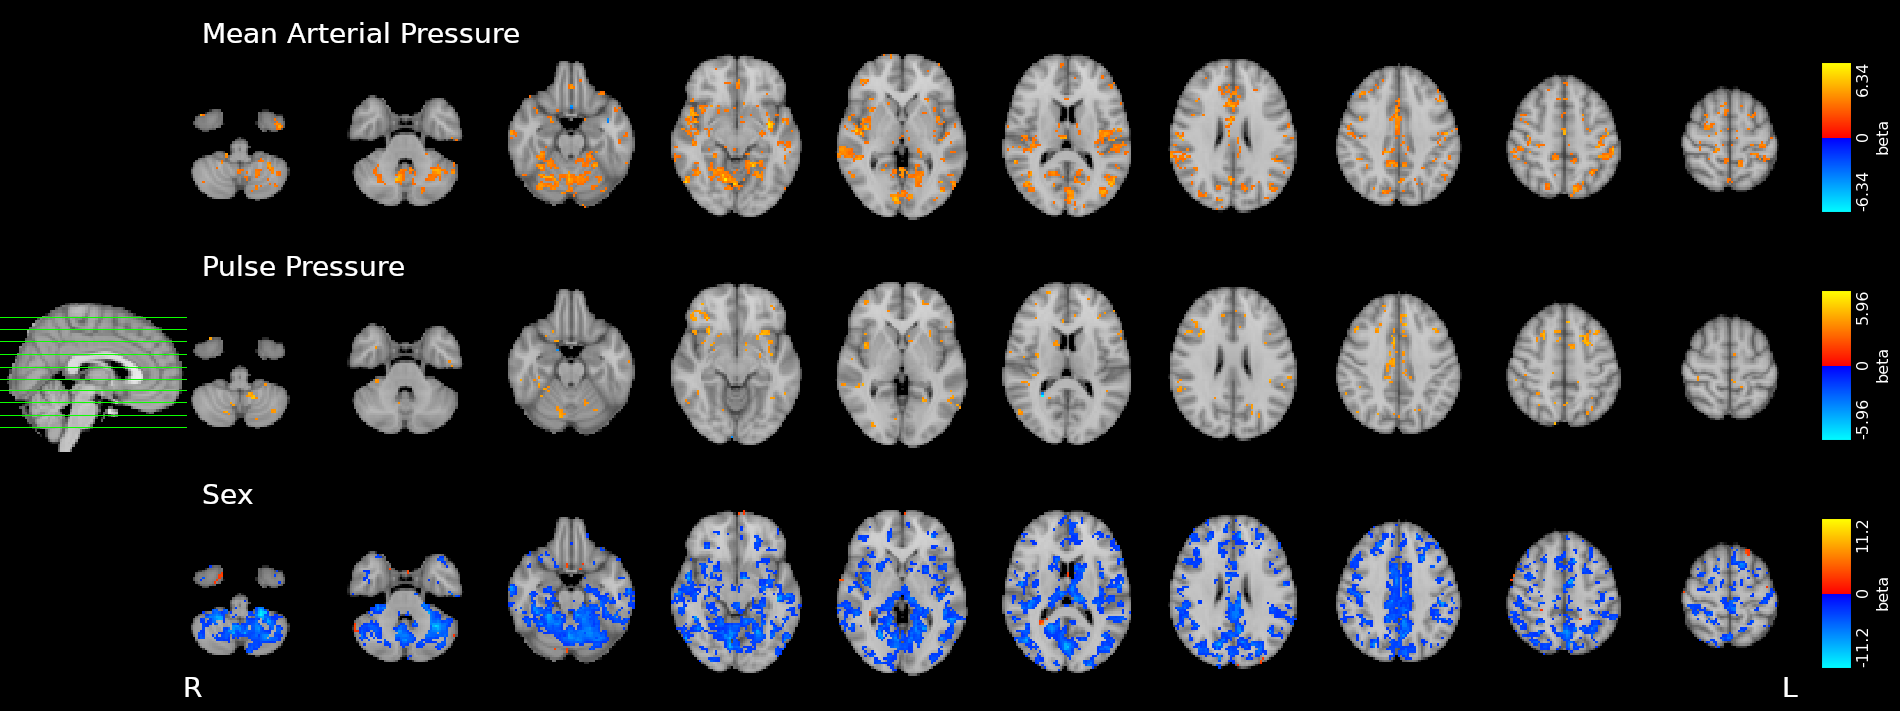
Effect on CVR
Results: CVR and RSF


Golestani et al. 2016 (NeuroImage)

Results: CVR, RSF, and tasks

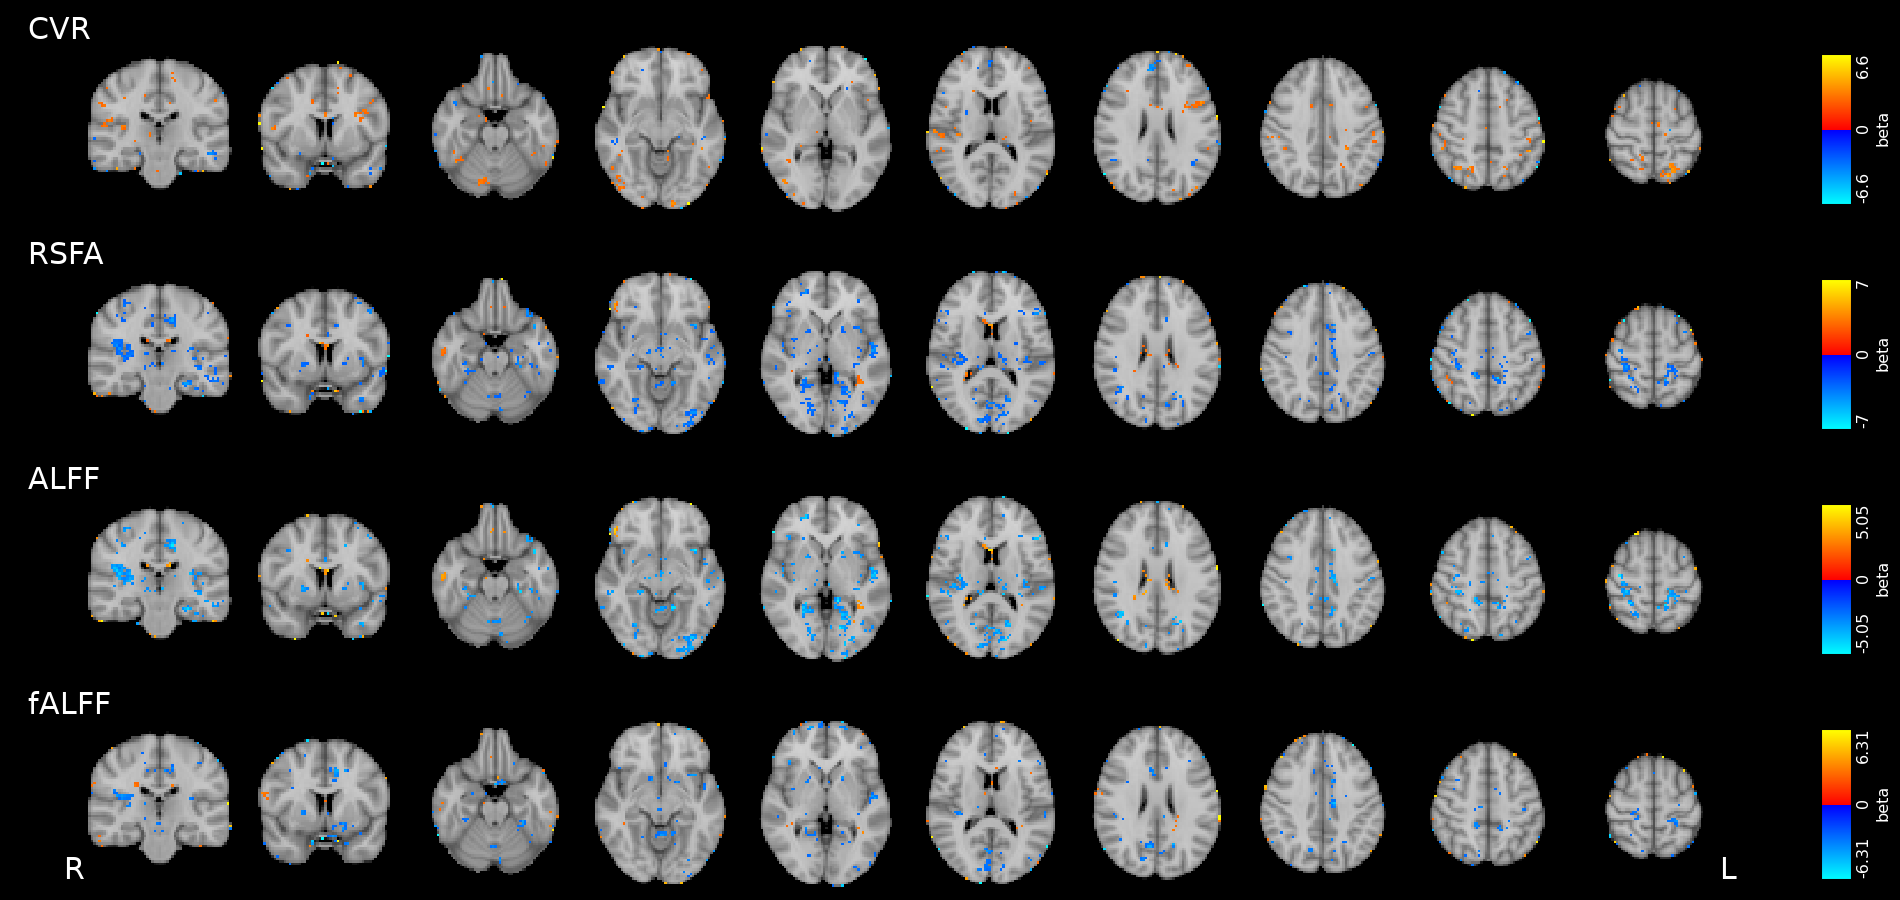
Motor task
Simon task, congruent responses

Simon task, incongruent responses
The relationship between CVR, RS fluctuations, and tIA
might be highly subject specific
or absent altogether.
Take home message #3

Conclusion

- A conservative MEICA-based approach best removes motion-related effects in CVR estimation, while obtaining reliable responses, but a simple optimal combination of ME data provides similar estimations
-
This observation does not translate automatically to paradigms with lower collinear motion and more focal responses (e.g. functional task), or in which there is no task information available (e.g. rest)
-
Further comparisons are also necessary to compare the performance of different lagged approaches in a multiverse environment
-
Conclusion

- Stationary blood pressure changes, expressed as MAP and PP, as well as sex, impact regional CVR estimation differently across sessions and subjects
-
Dynamic blood pressure changes are expected to impact CVR estimation, hence continuous blood pressure recordings are required to assess the matter
- Future studies should expand the impact of sex on CVR estimation by assessing the impact of more defined factors (e.g. hormonal fluctuations)
-
Dynamic blood pressure changes are expected to impact CVR estimation, hence continuous blood pressure recordings are required to assess the matter
Conclusion

- We did not observe a statistically significant effect of CVR on RS fluctuations, or of CVR and RS fluctuations on task induced activity, most probably due to the high variability between subjects
-
The failure of generalisation of previous observations might be related to different methods, but whether this is related to a better denoising and signal quality or to a possibly non optimal setting (e.g. compared to gas challenges) is uncertain
-
A different statistical perspective (i.e. Bayesian) is required to exclude any relationship between CVR and RS fluctuations, and further analyses are required to improve the agreement between CVR and RS fluctuations
-

1. What is Cerebrovascular Reactivity (CVR)
2. How can we improve CVR estimation?
4. Does CVR have an impact on functional activity?
3. Are there any factors affecting CVR?
It's a vascular response that maintains the adequate levels of oxygen (and pH)
By acquiring ME data and using a Lagged GLM to estimate it
Blood pressure seems to have localised effects, as well as sex
Although it cannot be excluded, the impact of CVR on RSF might be highly subject specific, while the impact of CVR on tIA requires further analysis to be ascertained
That's all folks!
Thanks to...


...the SPiN-lab group @ BCBL
... the Brightlab - ANVIL group @ Northwestern University
...my family and my friends
Research supported by the Eunice Kennedy Shriver National Institute of Child Health and Human Development of the National Institutes of Health under award number K12HD073945, the European Union’s Horizon 2020 research and innovation program (Marie Skłodowska-Curie grant agreement No. 713673), a fellowship from La Caixa Foundation (ID 100010434, fellowship code LCF/BQ/IN17/11620063), the Spanish Ministry of Economy and Competitiveness (Ramon y Cajal Fellowship, RYC-2017- 21845), the Spanish State Research Agency (BCBL “Severo Ochoa” excellence accreditation, SEV- 2015-490), the Basque Government (BERC 2018-2021 and PIBA_2019_104), the Spanish Ministry of Science, Innovation and Universities (MICINN; FJCI-2017-31814)


... Dr. César Caballero-Gaudes, Dr. Maite Termenon, and Dr. Molly G. Bright
...you for the (sustained) attention!
1. An ICA-based conservative denoising improvesCVR mapping, but a simpler OC of ME data is already sufficient.
2. Increased blood pressure results in localised increases in CVR. The sex of the participant can affect CVR too.
3. The relationship between CVR, RS fluctuations, and tIA might be highly subject specific and requires further
studies to be ascertained.
Take home messages

Any question [/opinions/objections/..]?
1. CVR is a vascular response to CO2 changes that can be estimated with respiratory tasks and BOLD imaging.
2. To improve CVR estimates, compute lagged-regression of signal of interest and noise simultaneously.
3. An ICA-based conservative denoising improvesCVR mapping, but a simpler OC of ME data is already sufficient.
4. Increased blood pressure results in localised increases in CVR. The sex of the participant can affect CVR too.
5. The relationship between CVR, RS fluctuations, and tIA might be highly subject specific and requires further
studies to be ascertained.
Take home messages
