Dense mapping reveals disconnect between resting state fMRI metrics and cerebrovascular physiology
Stefano Moia¹, Gang Chen², Eneko Uruñuela¹, Rachael C. Stickland³, Maite Termenon¹, César Caballero-Gaudes¹, and Molly G. Bright³
1. Basque Center on Cognition, Brain and Language, San Sebastian, Spain 2. NIMH/NIH/HHS, Bethesda (MD), USA 3.Northwestern University, Chicago (IL), USA


| smoia | |
| @SteMoia | |
| s.moia.research@gmail.com |
Cerebrovascular Reactivity
Cerebrovascular Reactivity (CVR) is the response of cerebral vessels to a vasoactive stimulus to provide sufficient O2 to cerebral tissues¹.

Due to its nature as homeostatic and cerebrovascular process, CVR interacts with all other homeostatic and cerebrovascular processes (e.g. autoregulation)². Hence, it is modulated by systemic physiological changes.
Proper CVR estimation requires specific equipment and/or compliance to specific tasks and it can cause discomfort, providing a challenge for clinical settings and when resources are limited.

1. Liu et al. 2018 (Neuroimage); 2. Lassen et al. 1976 (Bri. J. Anaesth.)
An alternative estimation of CVR (?)
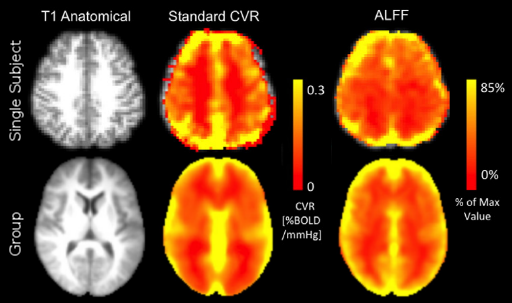
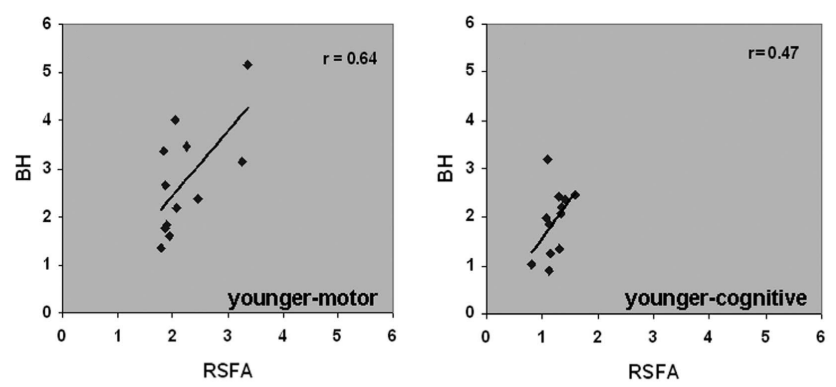
2. Golestani et al. 2016 (NeuroImage)

As a more feasible alternative, previous literature suggests to use
Resting State Fluctuations measures (RSF) that relate to CVR, such as:
- Resting State Fluctuations Amplitude (RSFA)¹
- [fractional] Amplitude of Low Frequency Fluctuations ([f]ALFF)²
1. Kannurpatti et al. 2014 (PloS ONE)

However, the relationship between RSF and CVR is controversial.
cfr. Golestani et al. 2016 (Neuroimage), Lipp et al. 2015 (Neuroimage)
This relationship led to the idea of using RSF to calibrate task-induced activation.
cfr. Kalcher et al. 2013 (Neuroimage), Kannurpatti & Biswal 2008 (Neuroimage), Kazan et al. 2017 (Magn Reson Med.)

What is the inter- and intra-subject
relationship between RSF and
breathhold (BH) based CVR?
1.
Do other physiological factors
(e.g. blood pressure) impact
CVR and RSF equally?
2.
EuskalIBUR
ME-MB fMRI: TR = 1.5 s, TEs = 10.6/28.69/46.78/64.87/82.96 ms, MB = 4, GRAPPA = 2, voxel size = 2.4x2.4x3 mm³

10 neurotypical subjects
(5F, age 25-40y)


10 sessions, one week apart, same time of the day

T2w, MP2RAGE, 4 RS,
3 tasks, BH paradigm
CO2 and O2
sampling
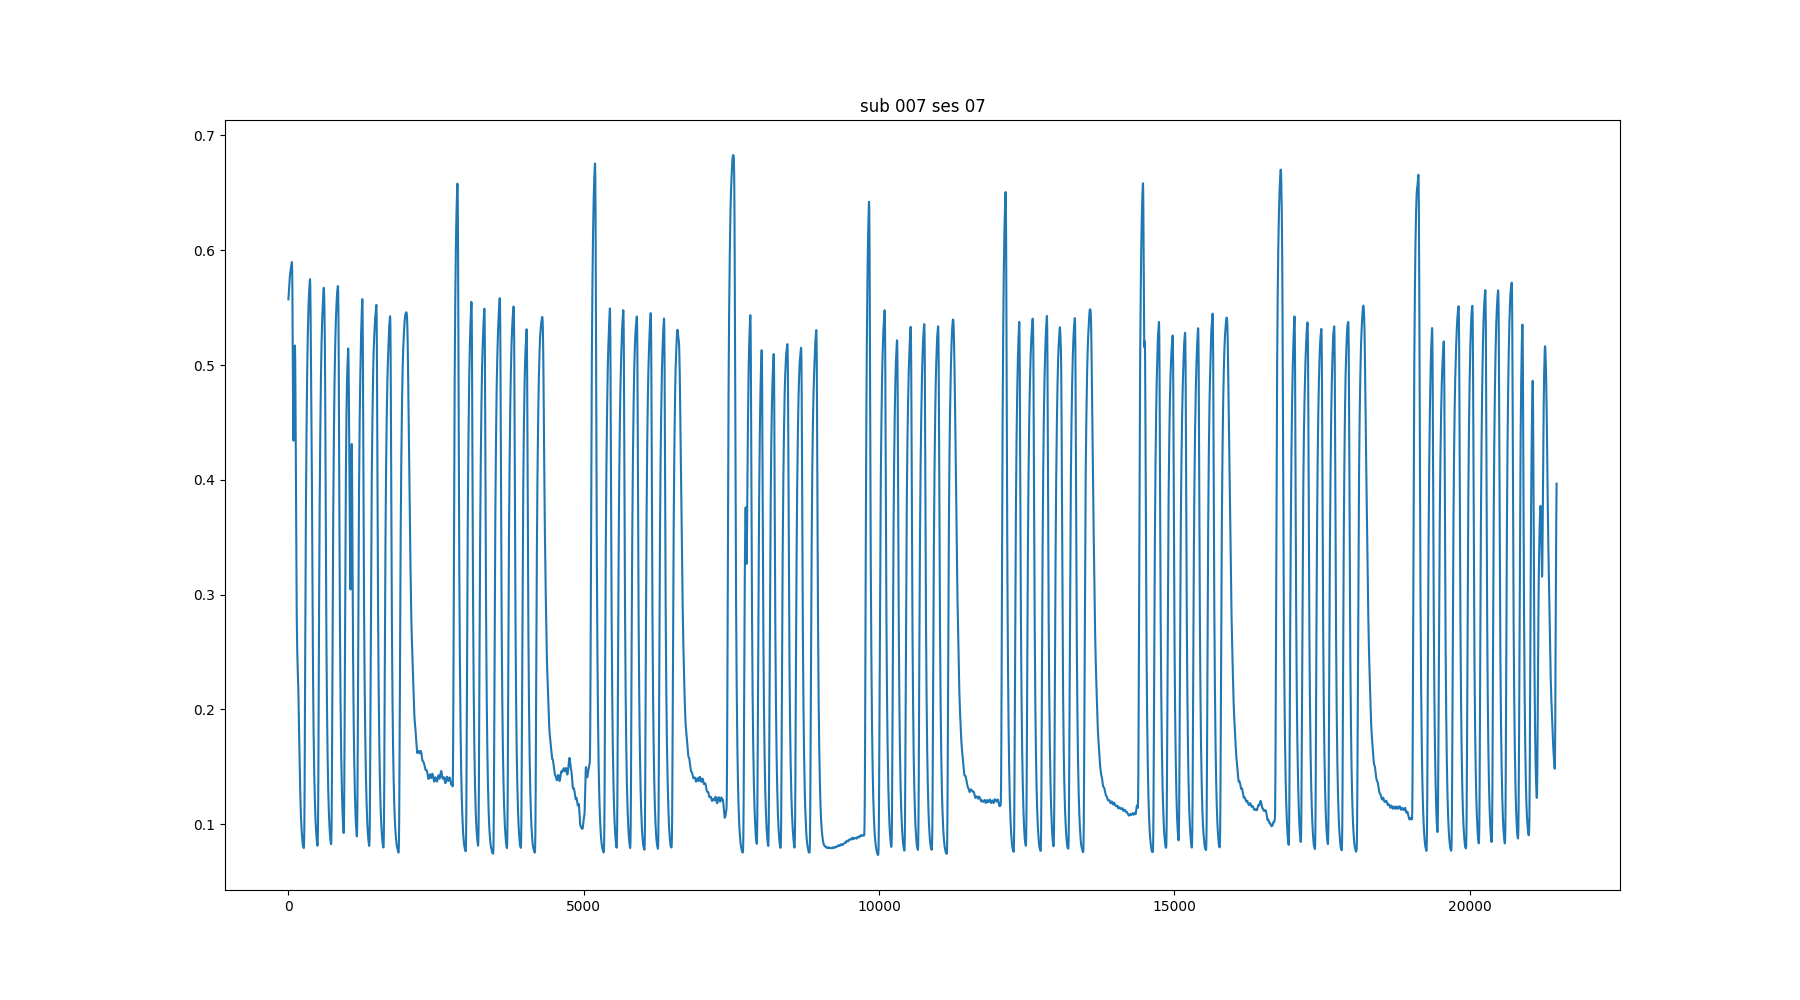
↑
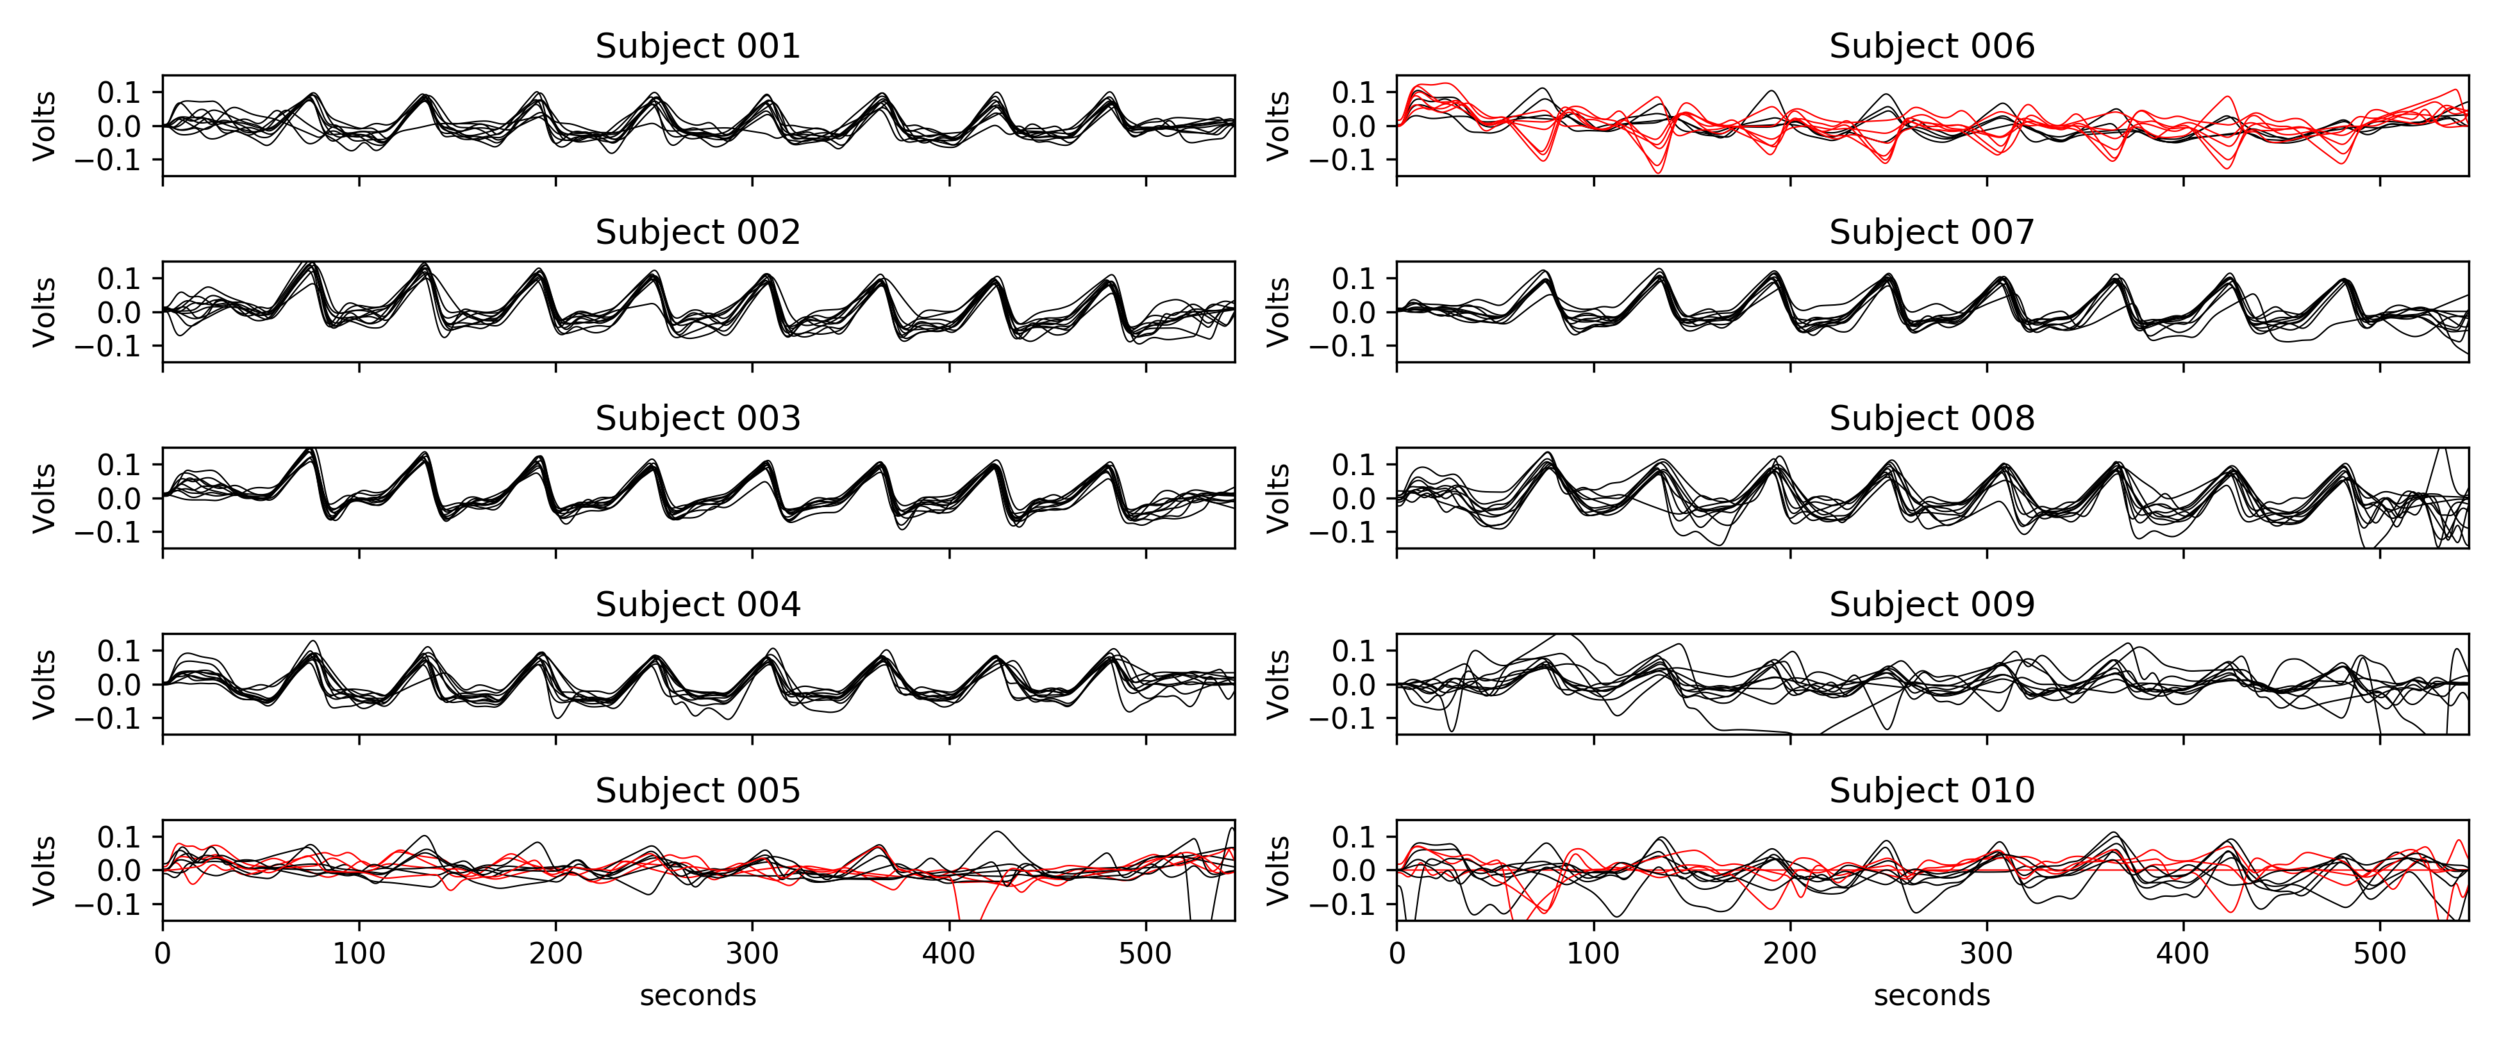
Moia et al. (2020), OpenNeuro. [Dataset] doi: 10.18112/openneuro.ds003192.v1.0.1

EuskalIBUR
10 neurotypical subjects
(5F, age 25-40y) (3 discarded)
10 sessions, one week apart, same time of the day
Vital signs (VS), measured before the MRI session, while the subject was lying supine on a bed, once on the left arm and once on the right arm:
- Cardiac pulse
- Blood pressure (systolic and diastolic)
We averaged the two measurements and computed the Mean Arterial Pressure (MAP) and the Pulse Pressure (PP):

MRI data processing
Functional: motion realignment, skullstripping, optimal combination (OC), Independent Component Analysis denoising (RS only)¹, distortion correction.
CO2 traces²: peak detection, linear interpolation of peaks and convolution with HRF, cross-correlation with average GM signal, creation of lagged regression (range: ±9 s, step: 0.3 s), interpolation to fMRI TR.
CVR and lag maps²: GLM with each lagged regressor and nuisance regressors(12 motion parameters and low frequency trends), voxelwise selection of the lagged model with highest explained variance (R²), normalisation to MNI152 template (2.5 mm isotropic),
smoothing (5 mm FWHM) in a dilated GM mask (1 voxel dilation).
RSF: computation of ALFF, fALFF, and RSFA in the 0.01-0.1 Hz domain.


1. Moia et al. 2021 (Neuroimage); 2. Moia, Stickland, et al. 2020 (EMBC)

Input maps
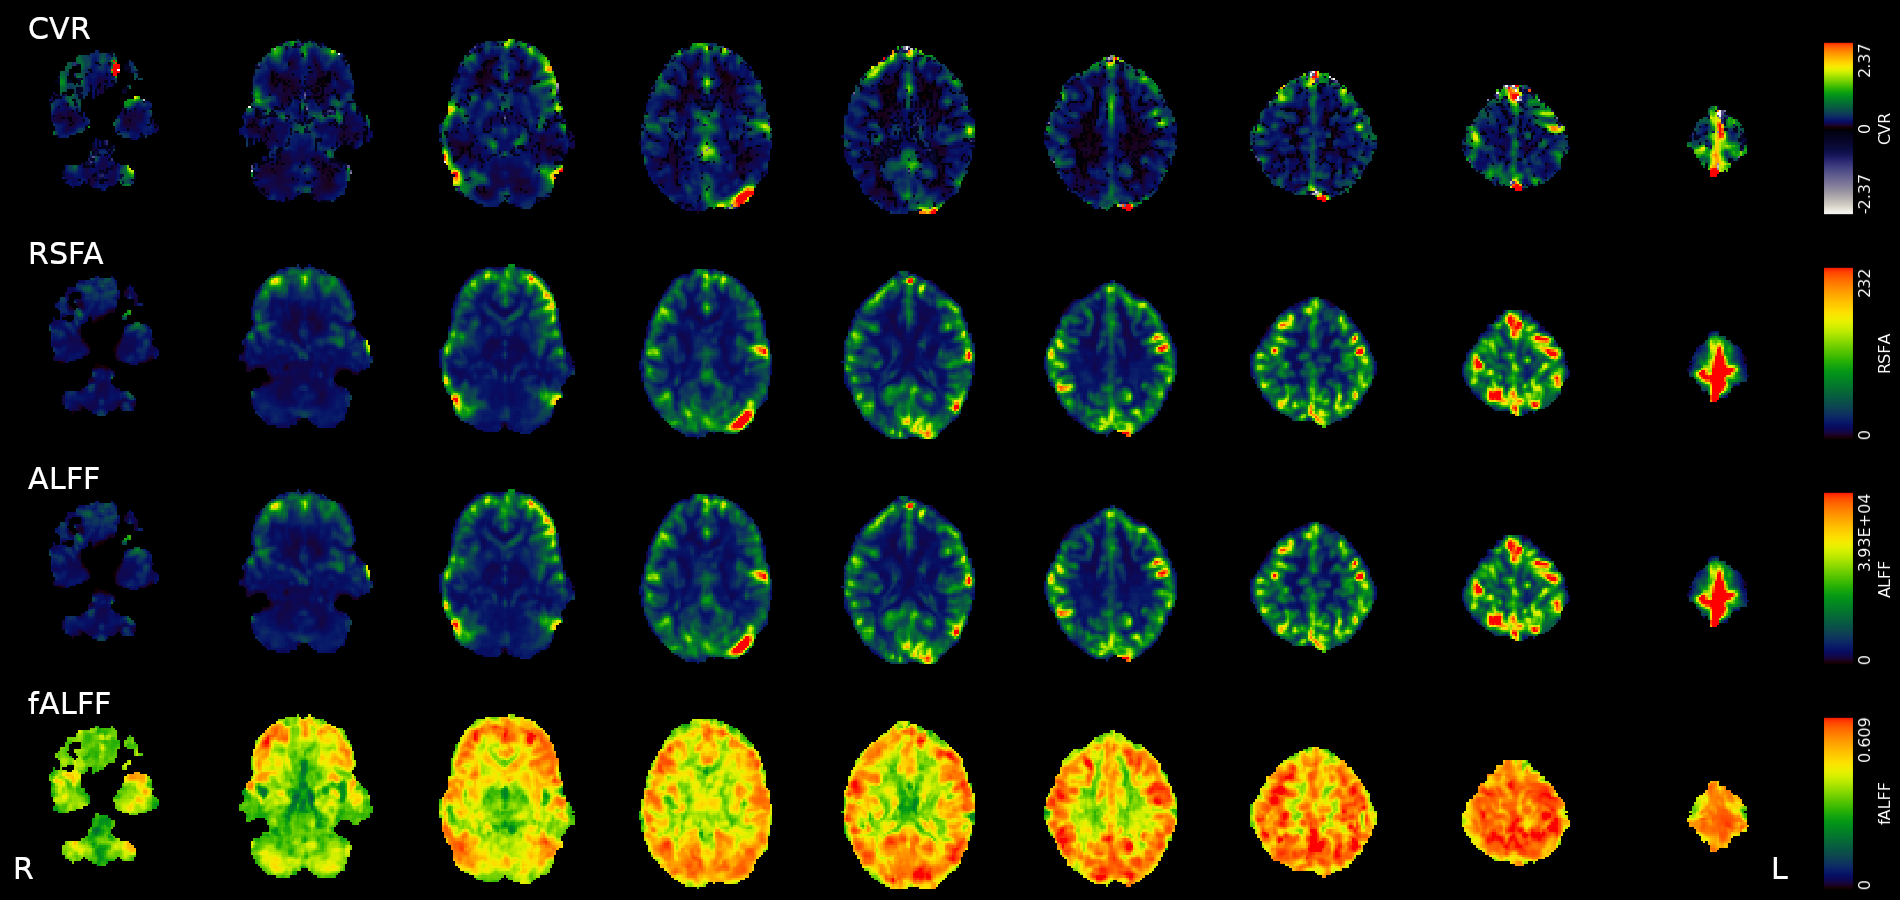

Data Analysis
We used 3dLMEr¹ to set up the following LME models (R syntax):
Results were thresholded at \(p<0.05\) after controlling for false discovery rate².
1. Chen et al. 2013 (Neuroimage); 2. Benjamini et al. 2006 (Biometrika)
Where \(RSF\) is either ALFF, fALFF, or RSFA, to compute the effec of CVR on RSF.
Where \(metric\) is either a RSF or CVR map, to compute the effect of blood pressure on each metric.

Relationship between CVR & RSF: GM average


Relationship between CVR & RSF: voxelwise
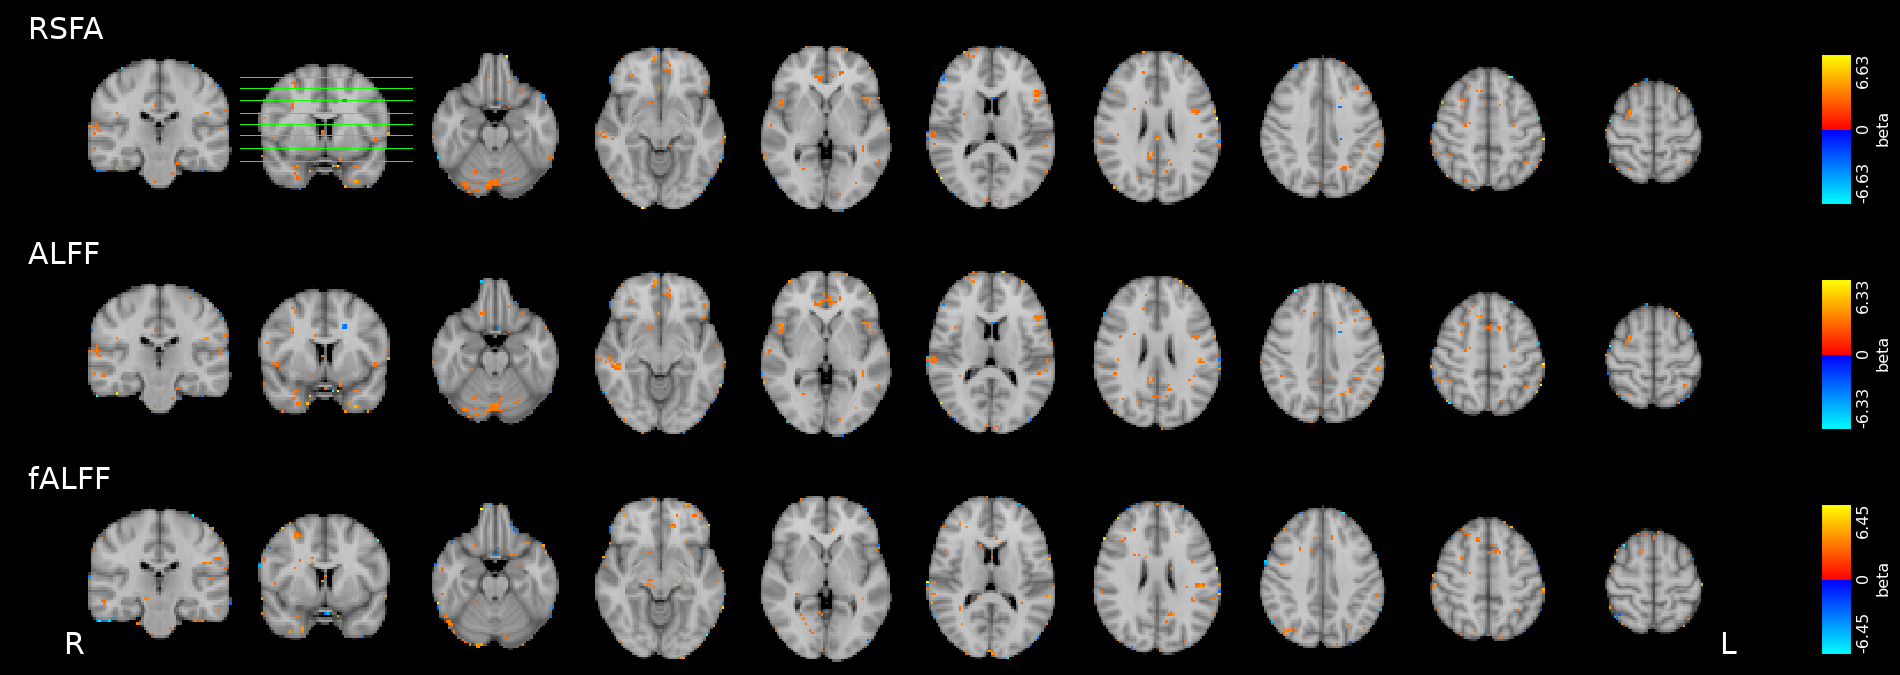
* threshold at \(p<0.001\) uncorrected (no significant result at \(q<0.05 \) FDR corrected).

Impact of sex on RSF
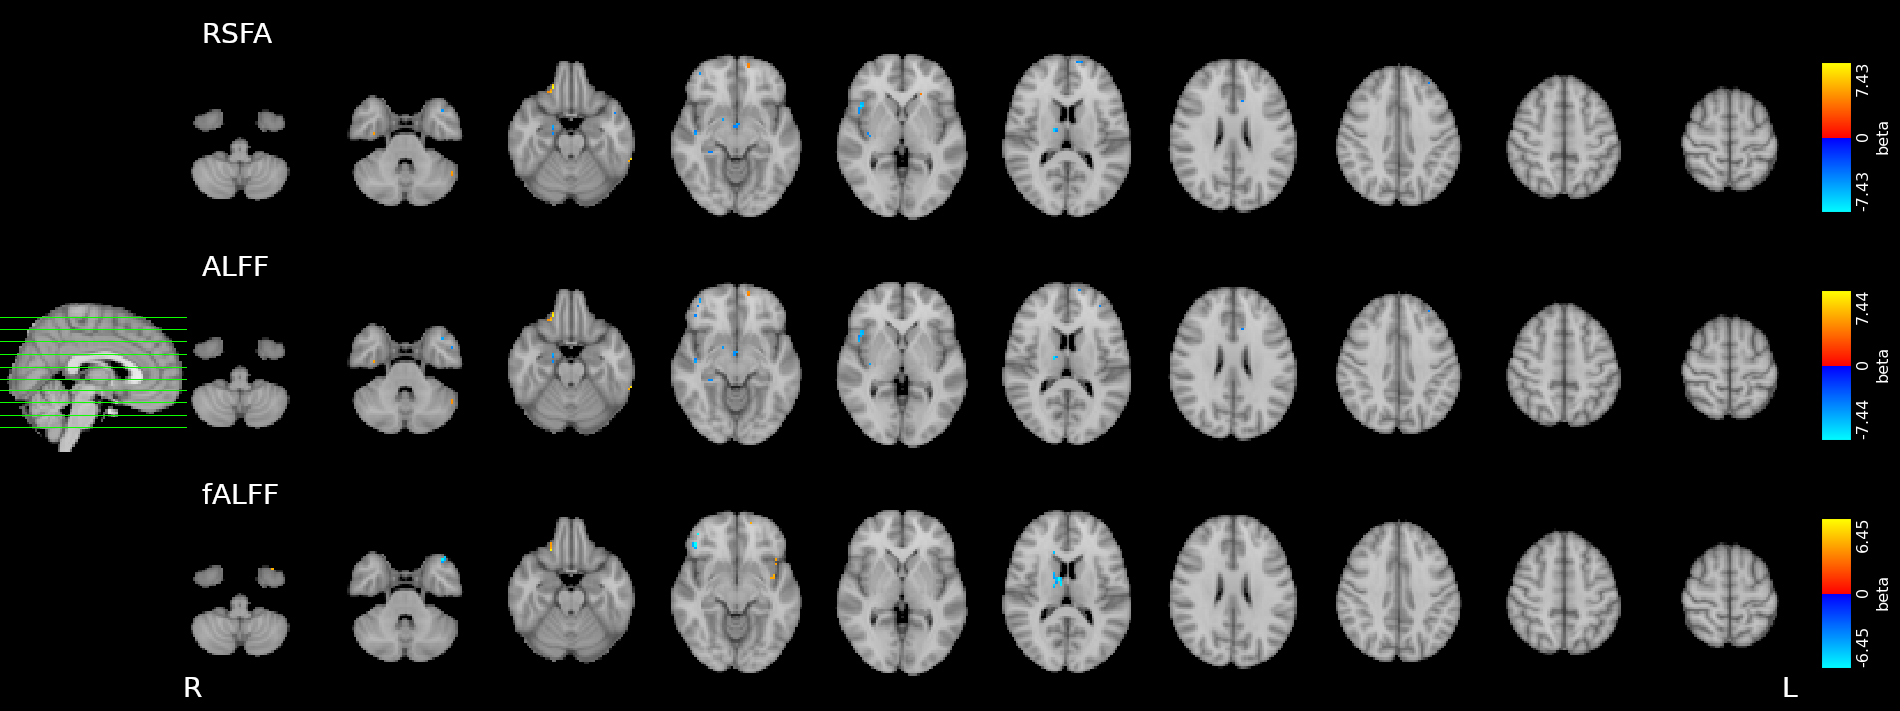
* threshold at \(q<0.5 \) FDR corrected.

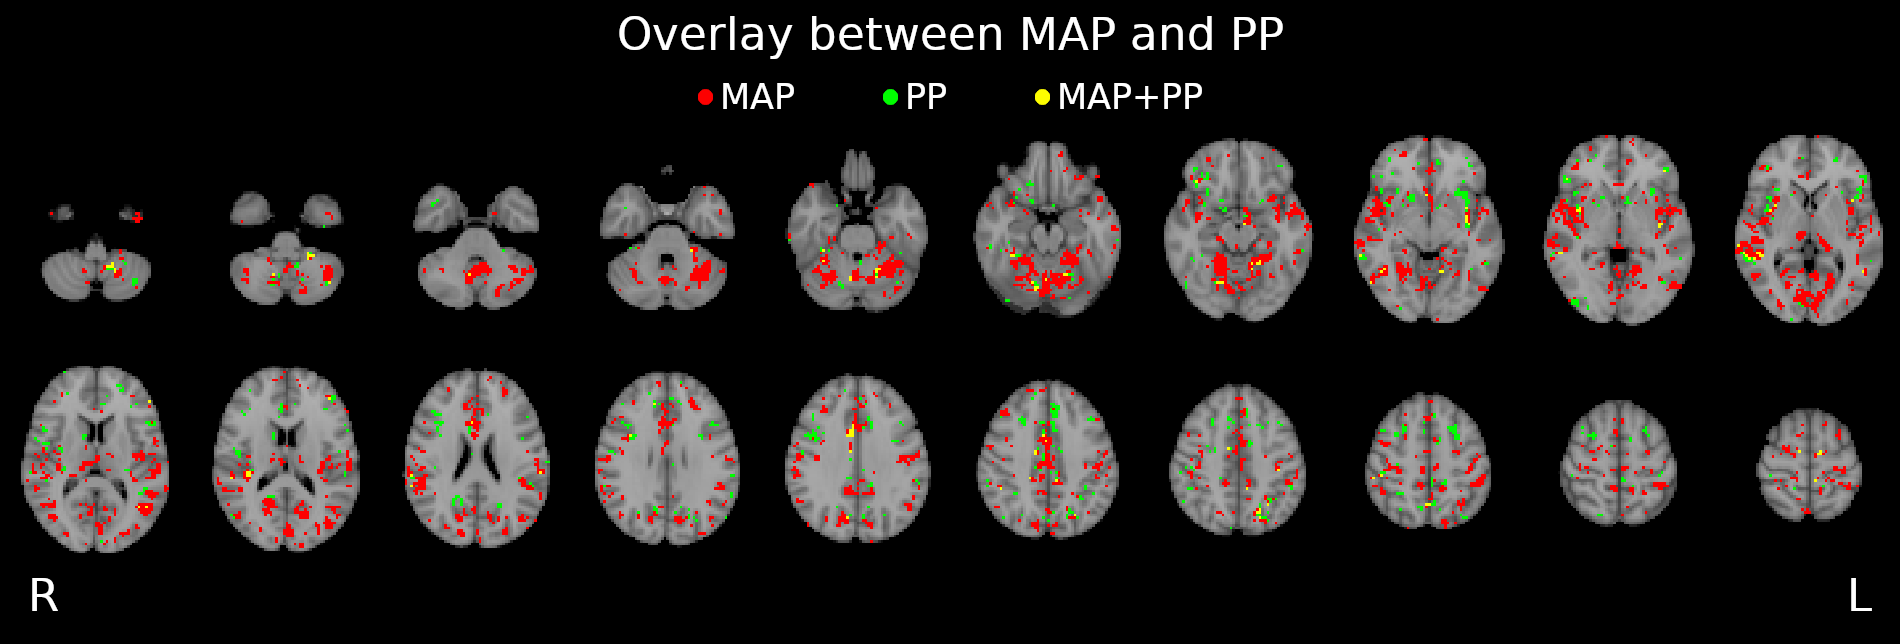
Impact of blood pressure and sex on CVR
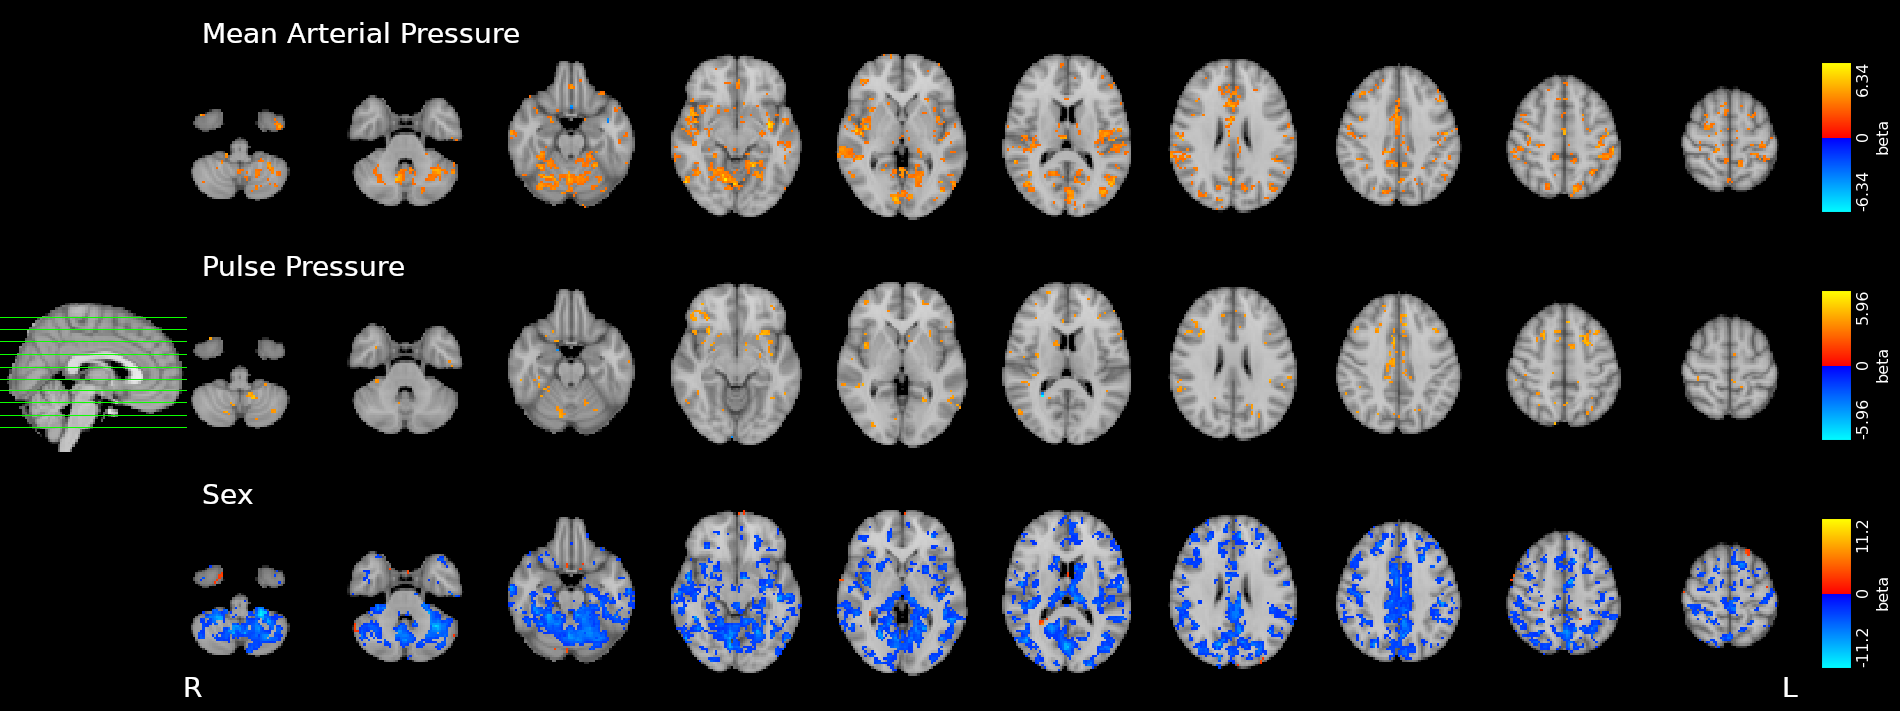
* threshold at \(q<0.5 \) FDR corrected.

Impact of blood pressure and sex on CVR

* threshold at \(q<0.5 \) FDR corrected.


If a relationship between RSF and CVR exists, it
varies greatly between subjects.
2.
RSF and CVR are not driven by the same
physiological factors (e.g. BP, sex).
5.
Using RSF metrics to calibrate fMRI might not be the
most adequate solution.
6.
Females show globally higher CVR than males, but
there is only focal RSF differences related to sex.
4.
Our dense mapping dataset does not show any
relationship between RSF and CVR.
1.
To higher BP corresponds higher CVR (and viceversa),
but there is no relationship between BP and RSF.
3.
Results: blood pressure
- Higher MAP and PP correlate with higher CVR in various cerebral regions.
- Blood pressure should be taken into account in CVR experiments, especially in comparisons between subjects or between regions.
- Both MAP and PP should be taken into account in these cases.
- Changes in blood pressure simultaneous to CVR inducing stimuli should be taken into account.
That's all folks!
Thanks to...

...the SPiN-lab group @ BCBL
... the Brightlab - ANVIL group @ Northwestern University
...you for the (sustained) attention!
Research supported by the Eunice Kennedy Shriver National Institute of Child Health and Human Development of the National Institutes of Health under award number K12HD073945, the European Union’s Horizon 2020 research and innovation program (Marie Skłodowska-Curie grant agreement No. 713673), a fellowship from La Caixa Foundation (ID 100010434, fellowship code LCF/BQ/IN17/11620063), the Spanish Ministry of Economy and Competitiveness (Ramon y Cajal Fellowship, RYC-2017- 21845), the Spanish State Research Agency (BCBL “Severo Ochoa” excellence accreditation, SEV- 2015-490), the Basque Government (BERC 2018-2021 and PIBA_2019_104), the Spanish Ministry of Science, Innovation and Universities (MICINN; FJCI-2017-31814)




Dense mapping reveals disconnect between resting state fMRI metrics and cerebrovascular physiology
By Stefano Moia
Dense mapping reveals disconnect between resting state fMRI metrics and cerebrovascular physiology
- 19


