(f)MRI Quality Control
- a scalable workflow for BIDS data


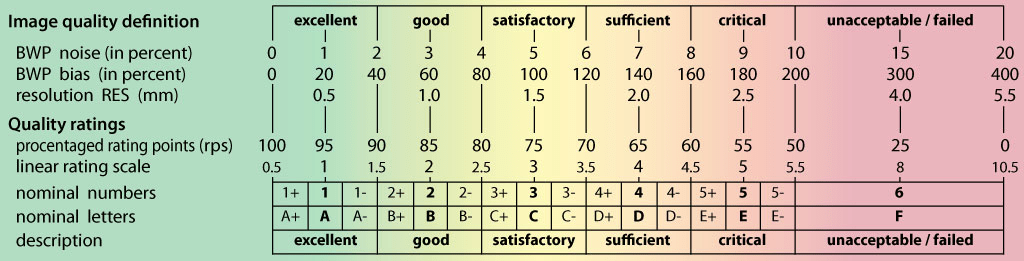
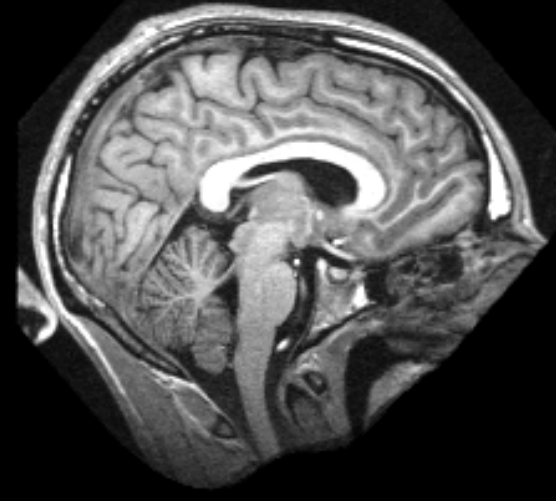
- Quality standards – What is a good and bad image ?
- Quality assessment – How to measure quality ?
- Quality data acquisition - How to get quality data ?
- Quality impact – How does bad quality influence results?
QC workflow for (f)MRI data
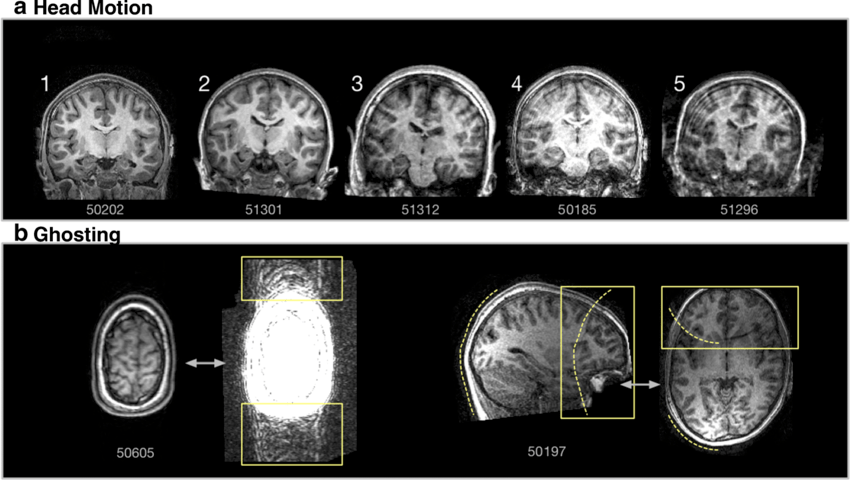
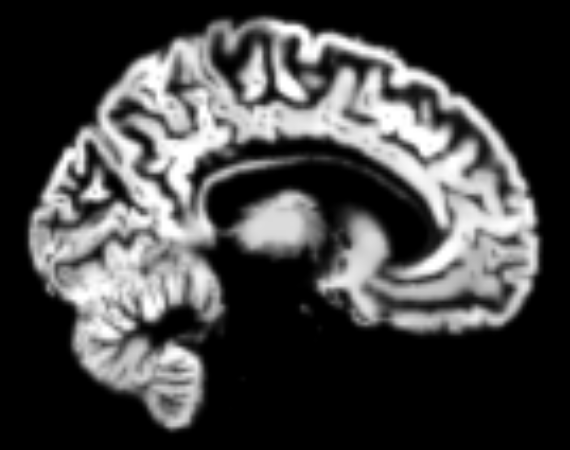
MRI image artifacts
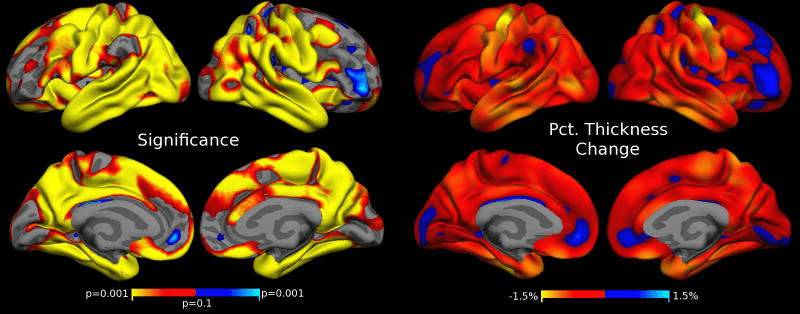
Head motion during MRI acquisition reduces gray matter volume and thickness estimates
Reuter et al. 2015, Neuroimage
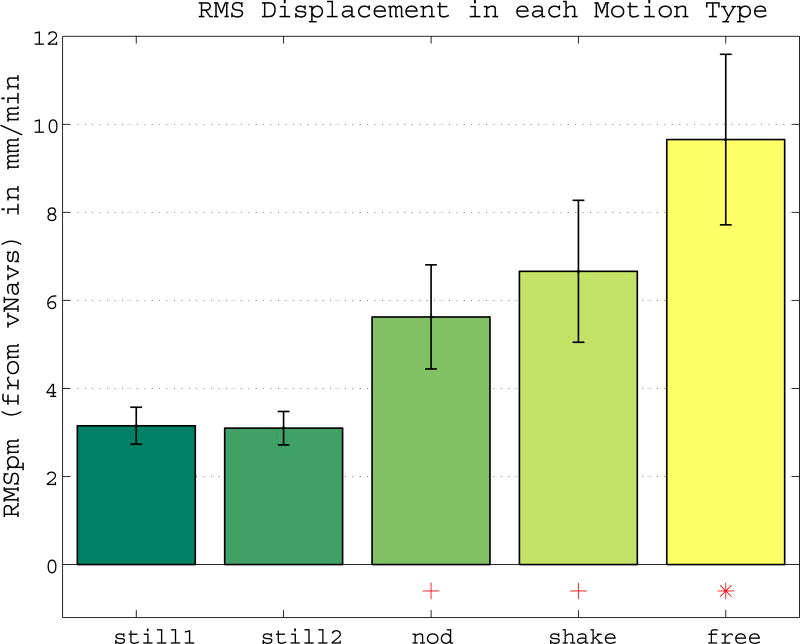
N=12
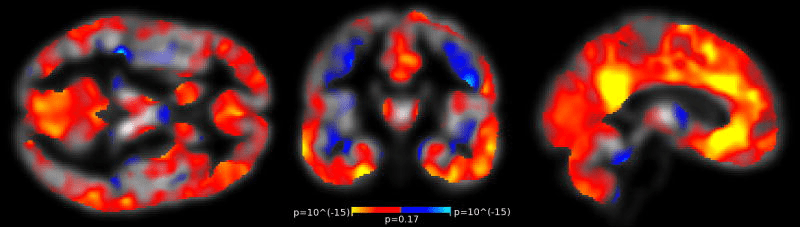
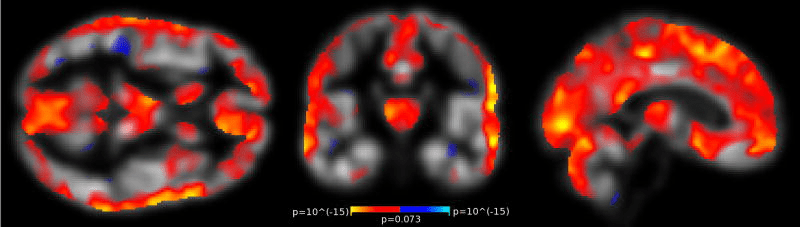
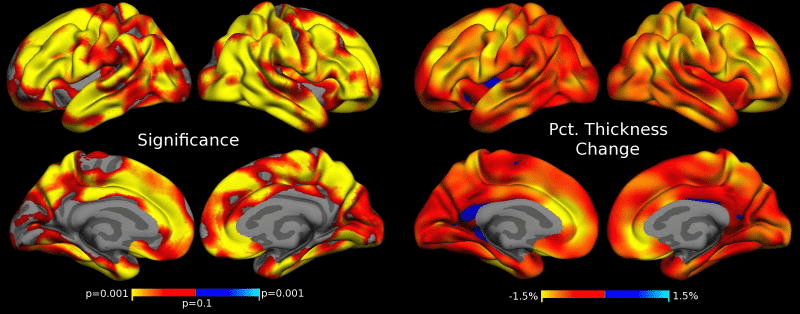
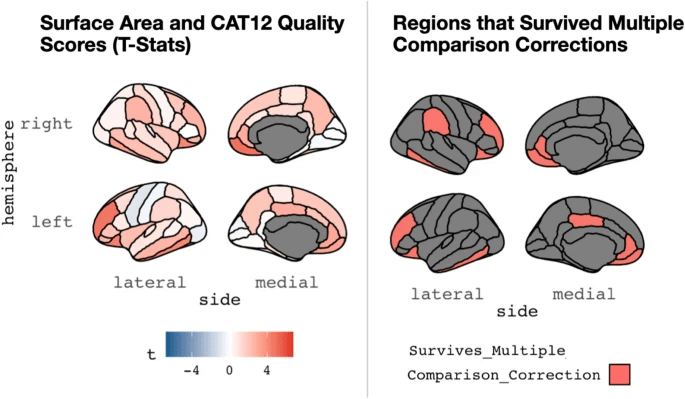
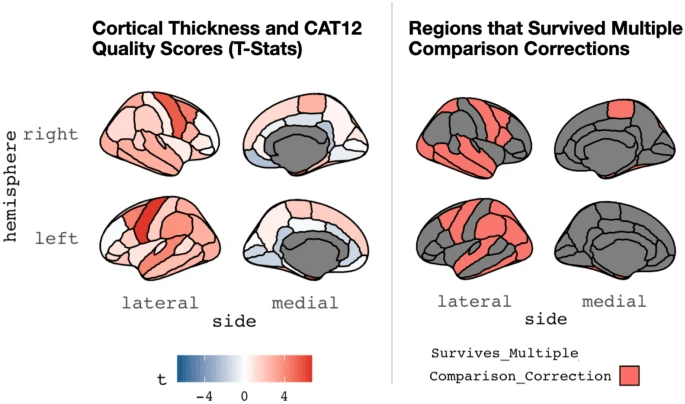
Variations in structural MRI quality significantly impact commonly used measures of brain anatomy
Gilmore et al. 2021, Brain Informatics
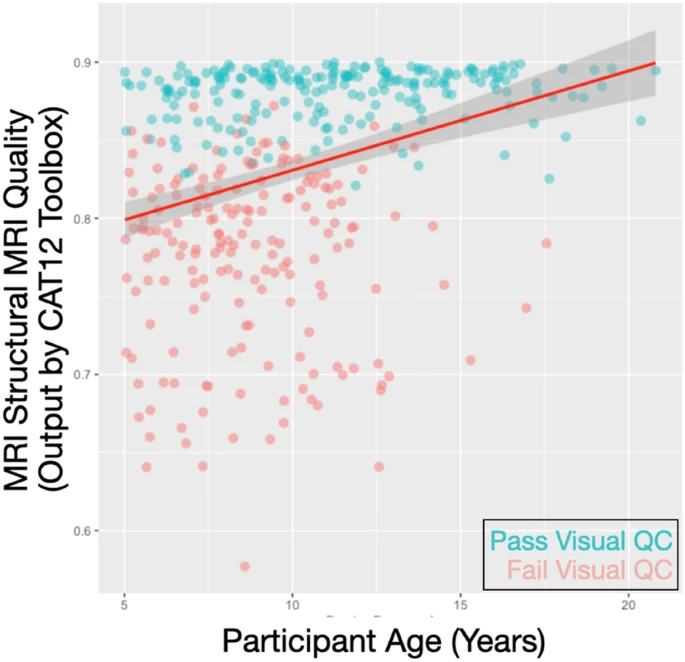
Healthy Brain Network N=388; age range 5-21
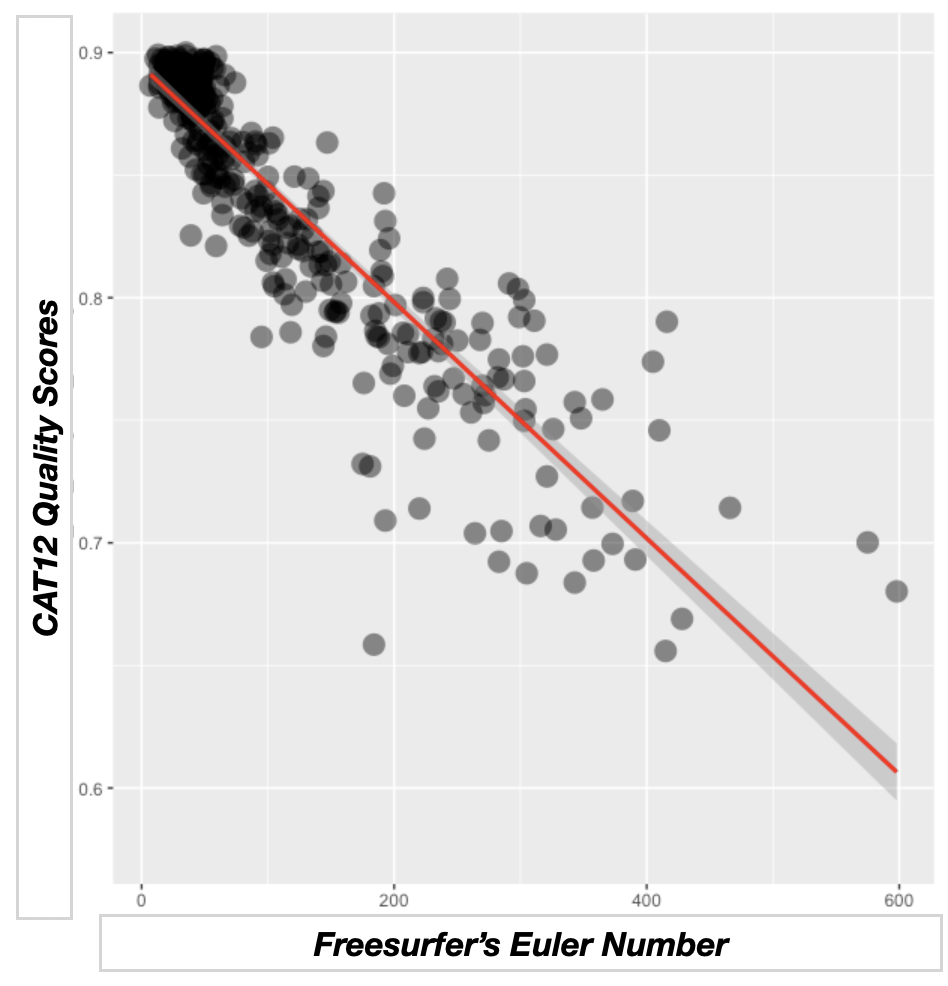
r=-.904
r = .321
Pass Visual QC: n=209

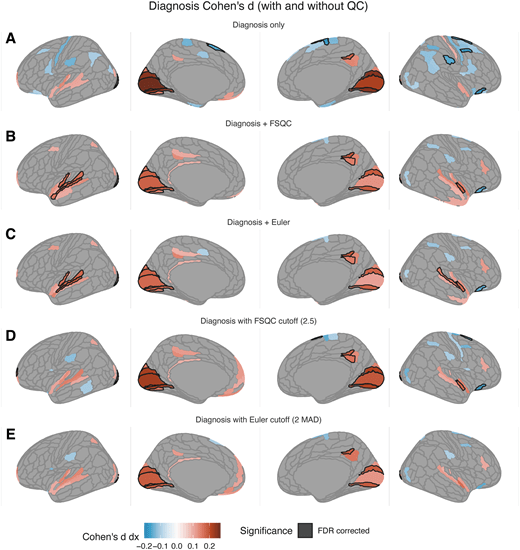
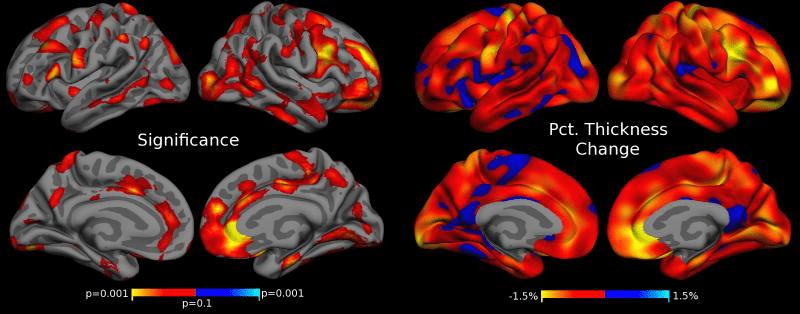
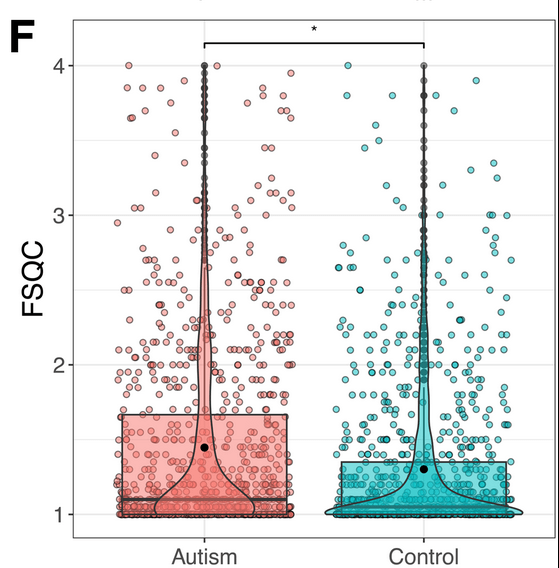
Impact of autism diagnosis on cortical thickness (Cohen’s d)
The impact of MRI image quality on
statistical and predictive analysis of voxel
based morphology
- Quantify impact of quality on univariate statistics and machine learning classification
- Group effects (T-test) of sex on gray matter volume
- Sex prediction from GM using logistic regression
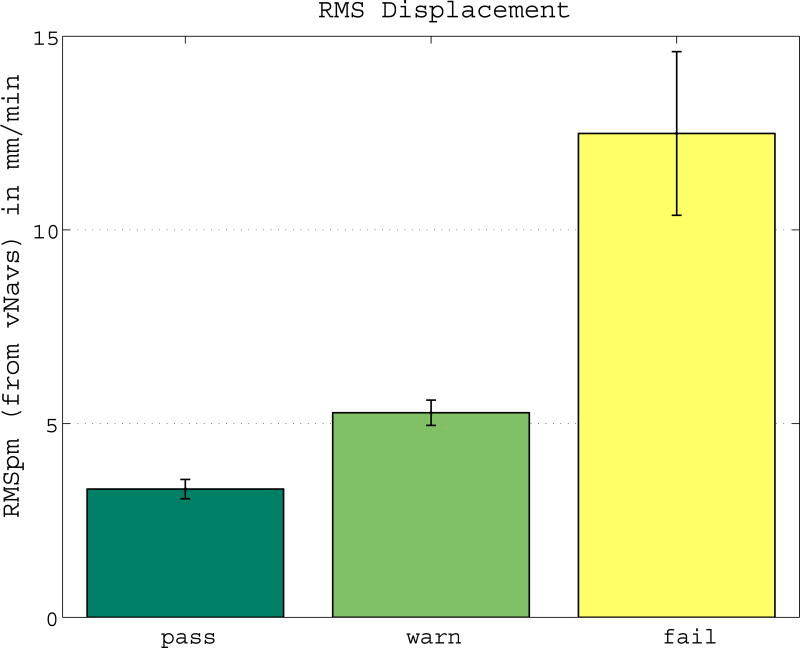
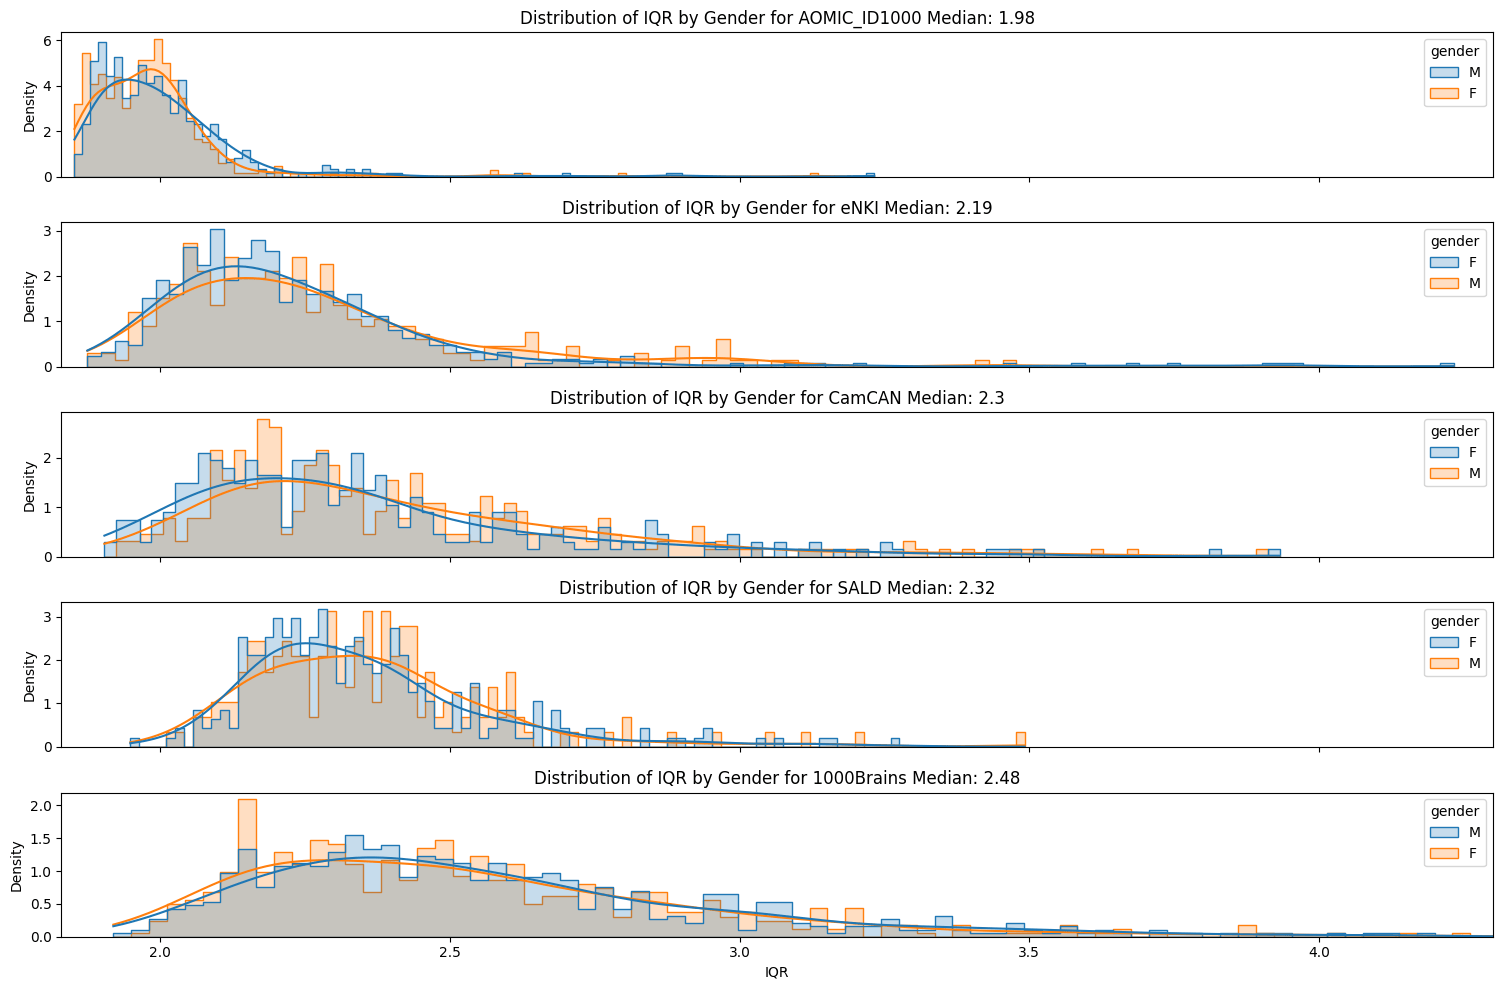
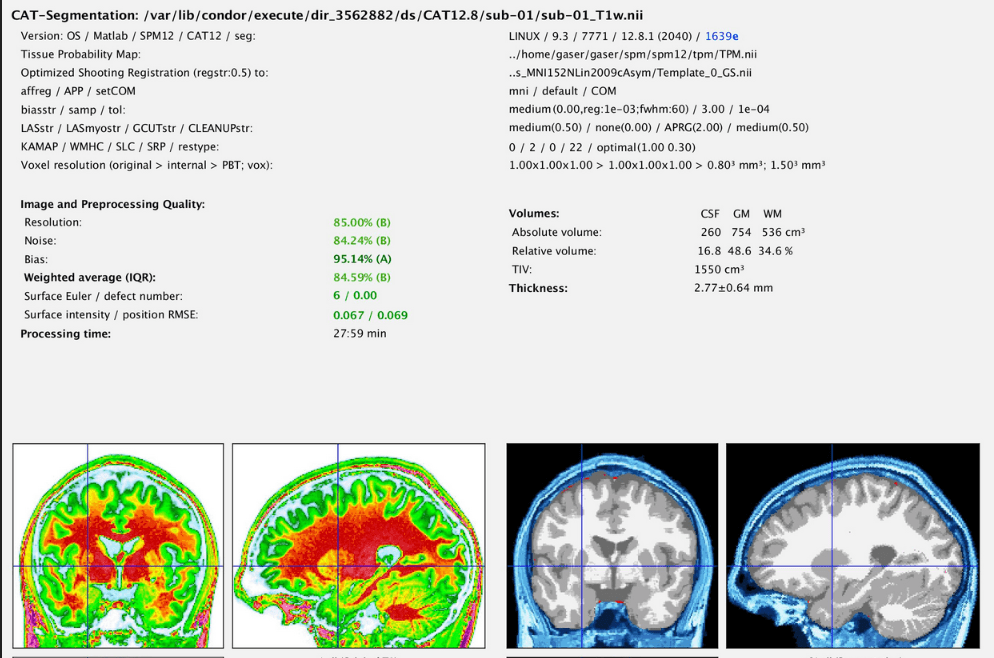
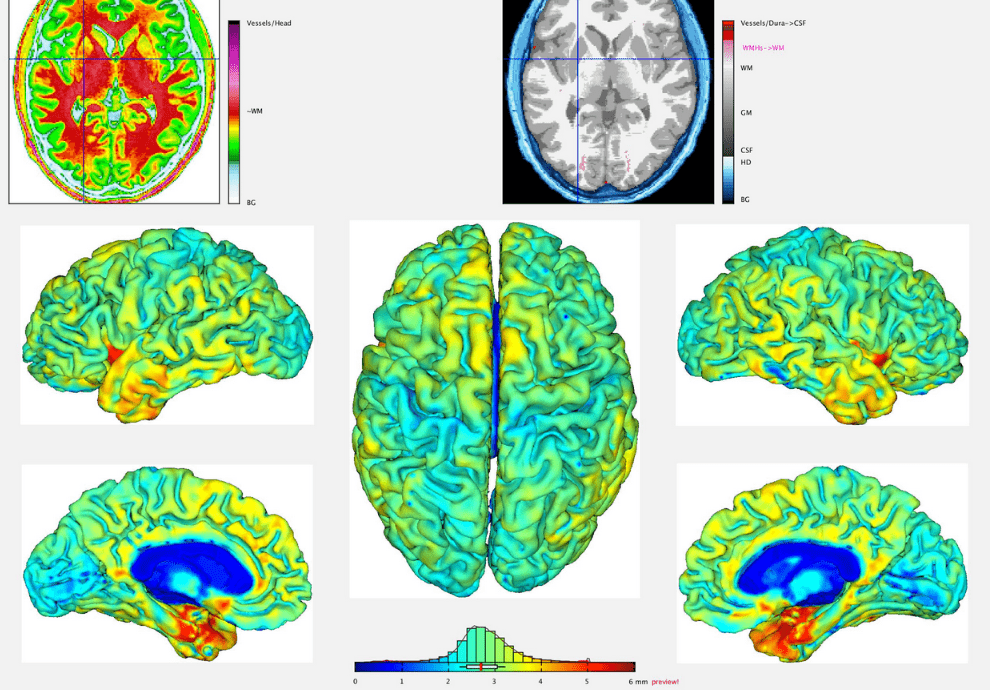
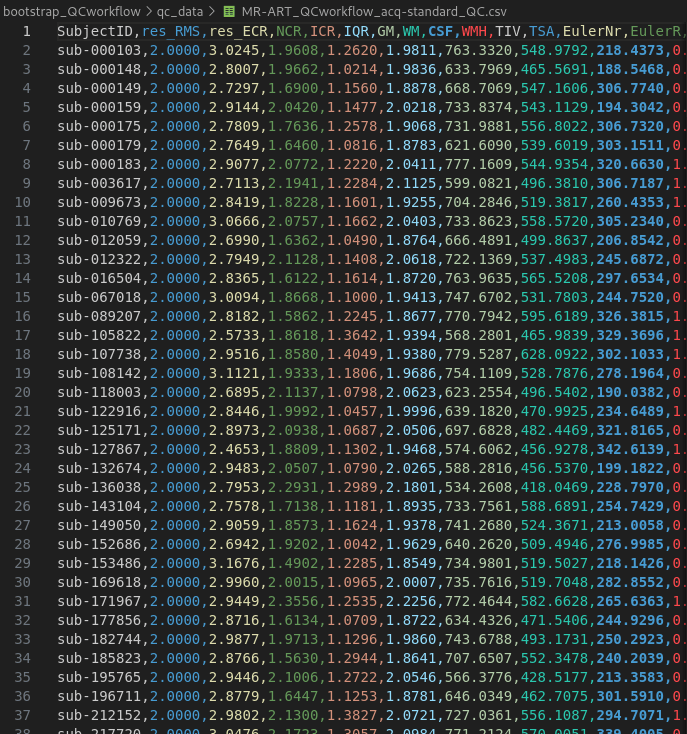
CAT12 - IQR (Image Quality Rating)
-
NCR (Noise Contrast Ratio):
local standard deviation in the optimized WM segment, scaled by the minimum tissue contrast. -
ICR (Inhomogeneity Contrast Ratio): global standard deviation within the optimized WM segment
-
RES (RMS resolution): RMS value of the voxel size
Data
Raw data (N=4125):
AOMIC (N=928)      young adults
eNKI (N=818)       life span
CamCan (N=651)     aging
SALD (N=494)       life span
1000brains(N=1234) aging
Features
T1w images
CAT12.8.1 processed
modulated gray matter

Smoothing 4 mm
Resample 8 mm
=> 3474 voxels
Data
Raw data (N=4125):
AOMIC (N=928)      young adults
eNKI (N=818)       life span
CamCan (N=651)     aging
SALD (N=494)       life span
1000brains(N=1234) aging
Features
10 age bins (N=1528)
AOMIC (N=624)
eNKI (N=280)
CamCan (N=280)
SALD (N=200)
1000brains (N=144)
Subsamples low & high quality
balanced for sex & age
T1w images
CAT12.8.1 processed
modulated gray matter

Smoothing 4 mm
Resample 8 mm
=> 3474 voxels
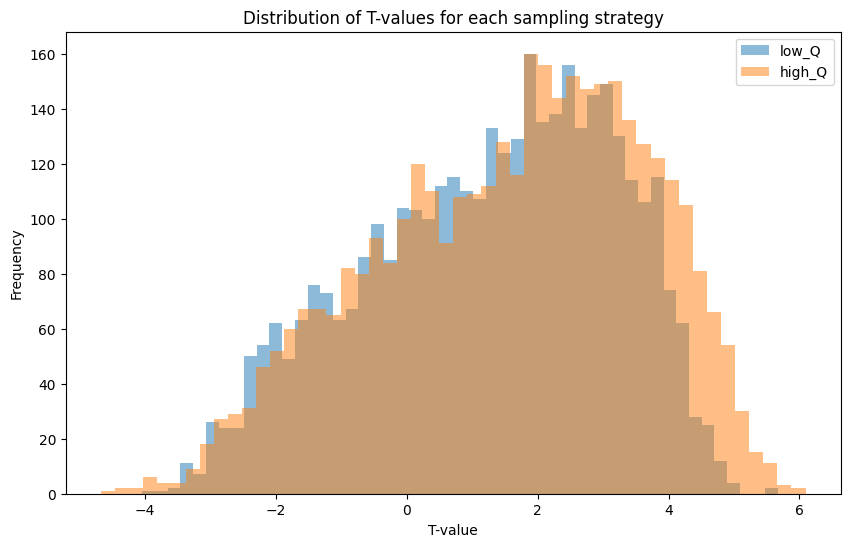
- T-test for sex differences over all voxels for pooled data
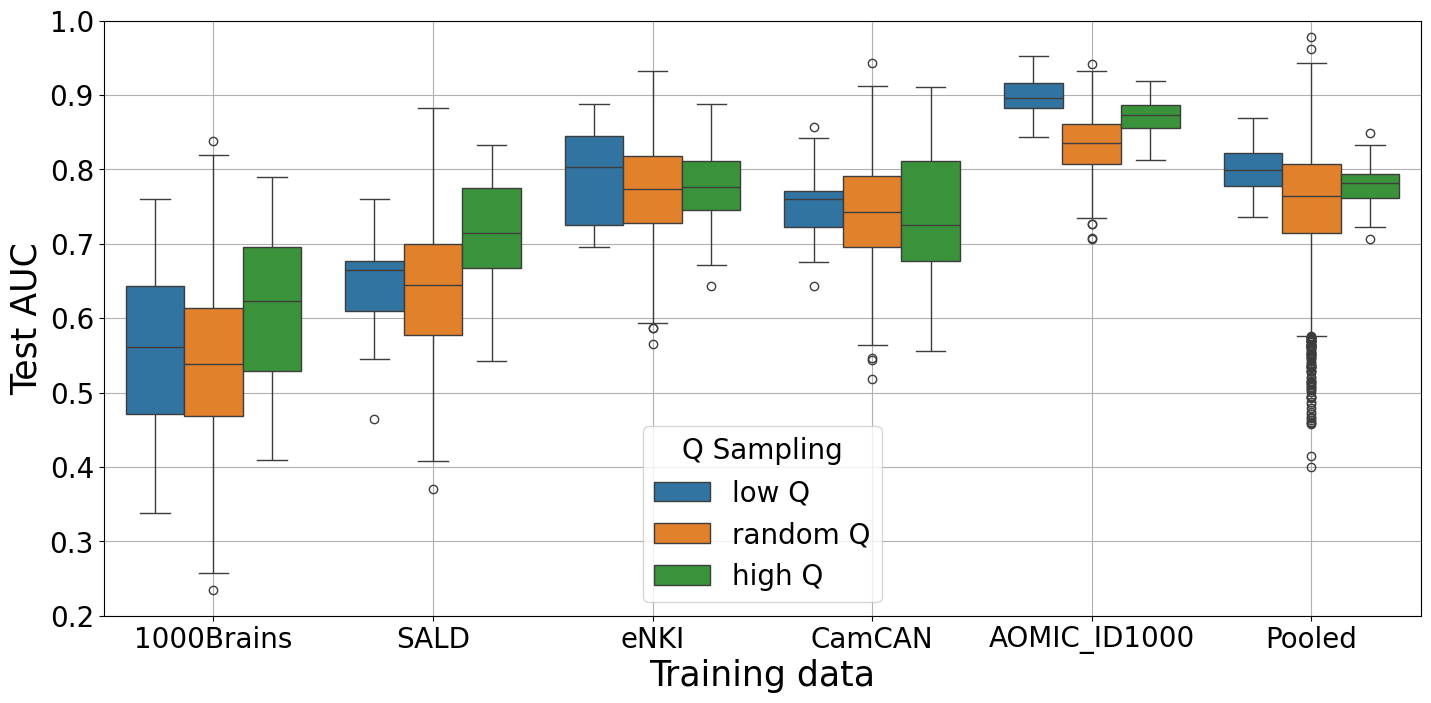
- Predicting sex via logistic regression 5x5fold CV within each site & overall
T-tests on pooled data
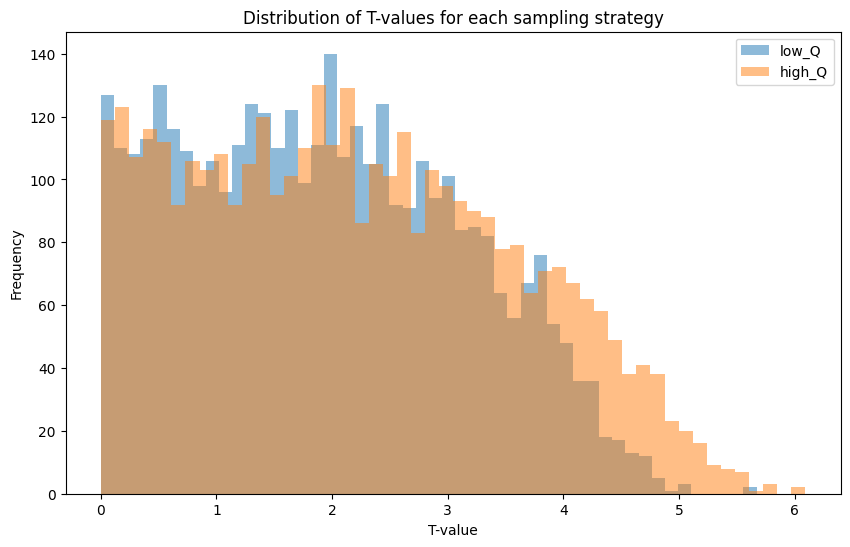
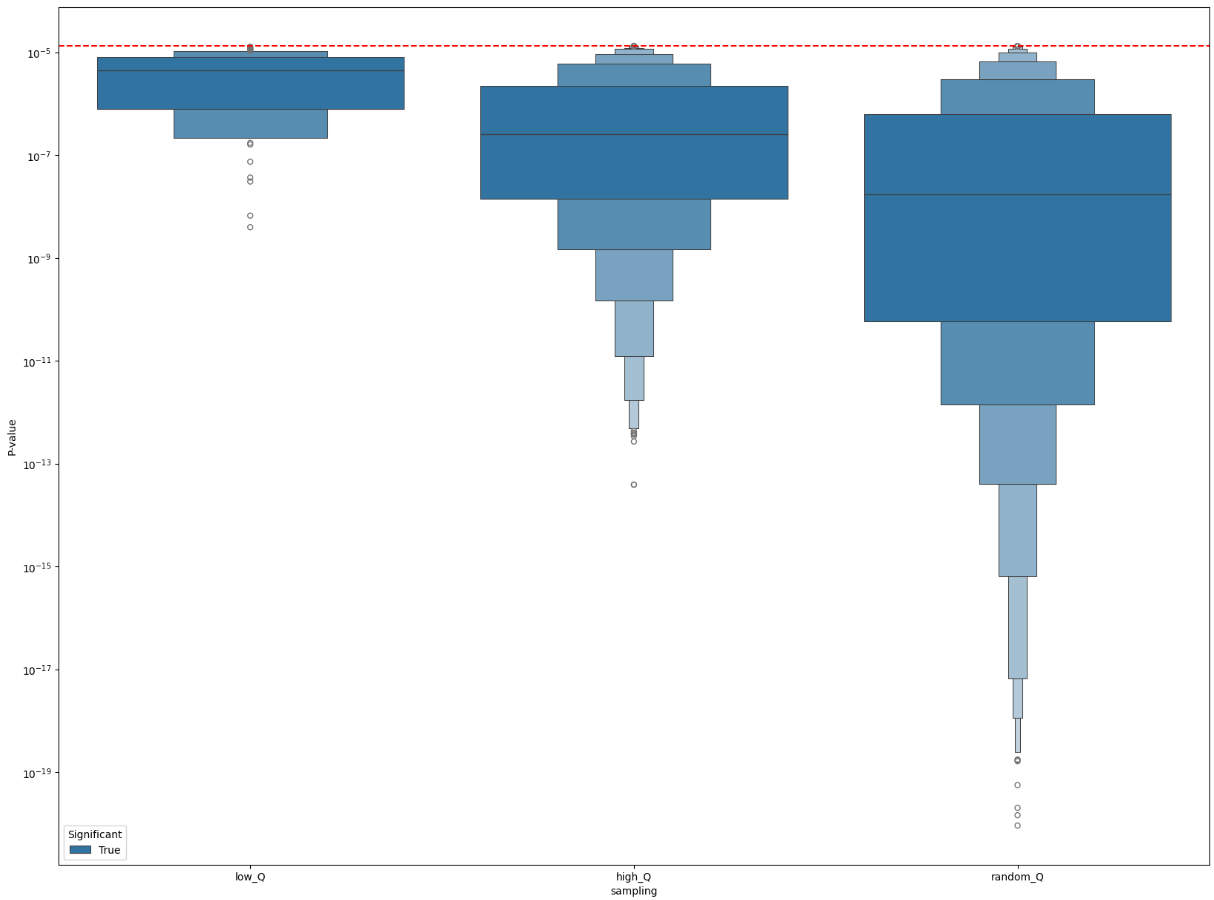
Distribution of p-values < 0.0001
low_Q random_Q high_Q
Sex/gender prediction logistic regression
Next steps
- Add new datasets.
- Add datasets with variable Q: ABIDE, ADNI, ABCD
- Use retest datasets for within subject effects: CoRR & OASIS3
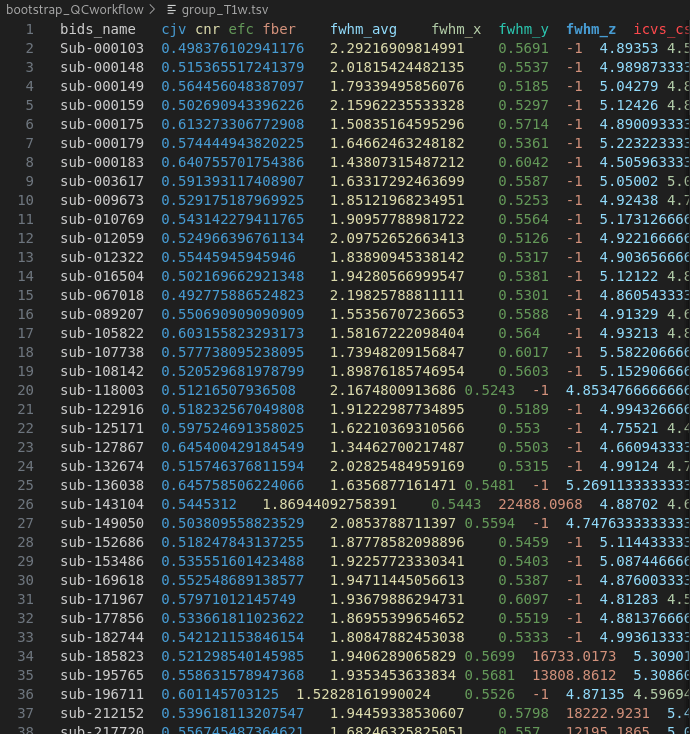
- Replicate effect of quality on analyses approach with EulerNr.
-
Robust analysis targets ?
-
Robust analysis targets ?
- Extend to functional MRI data:
- Identify useful image quality markers for fMRI
- Task or rest?
QC workflow for (f)MRI data
- MRIQC - standalone open-source project extracts no-reference IQMs (image quality metrics) from structural (T1w and T2w) and functional MRI data
- CAT12 - Computational Anatomy Toolbox for SPM12 is a powerful suite of tools for morphometric analyses including the estimation of image quality metrics for T1w
QC workflow for (f)MRI data
-
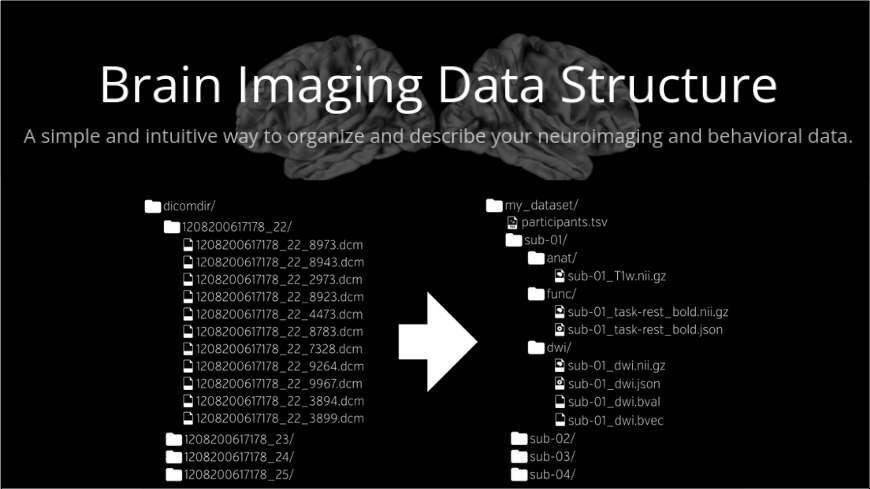
BIDS – Brain Imaging Data Structure
-
Containers – Singularity and Docker
- Datalad - Distributed Data Management
BIDS- Brain Imaging Data Structure
Containers - Singularity & Docker
- analysis code
- binary dependencies
- configuration files
- environment variables
- data dependencies
Distributed Data Management
-
CLONE DATA
-
Look at data structure without content present
-
Automatic download of single files or all data
- Easy sharing of data via common platforms

QC workflow for (f)MRI data
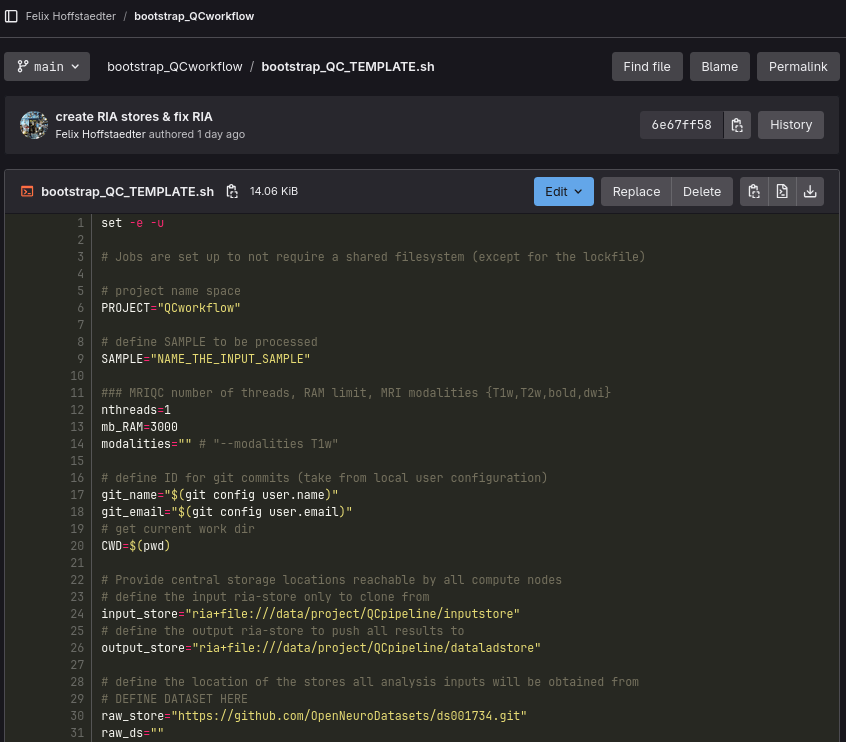
- data to QC in BIDS
- clone QCworkflow from JuGit
- storage on Juseless for output
- create bootstrap script
- run bootstrap script
- submit condor jobs
- run consolidation script
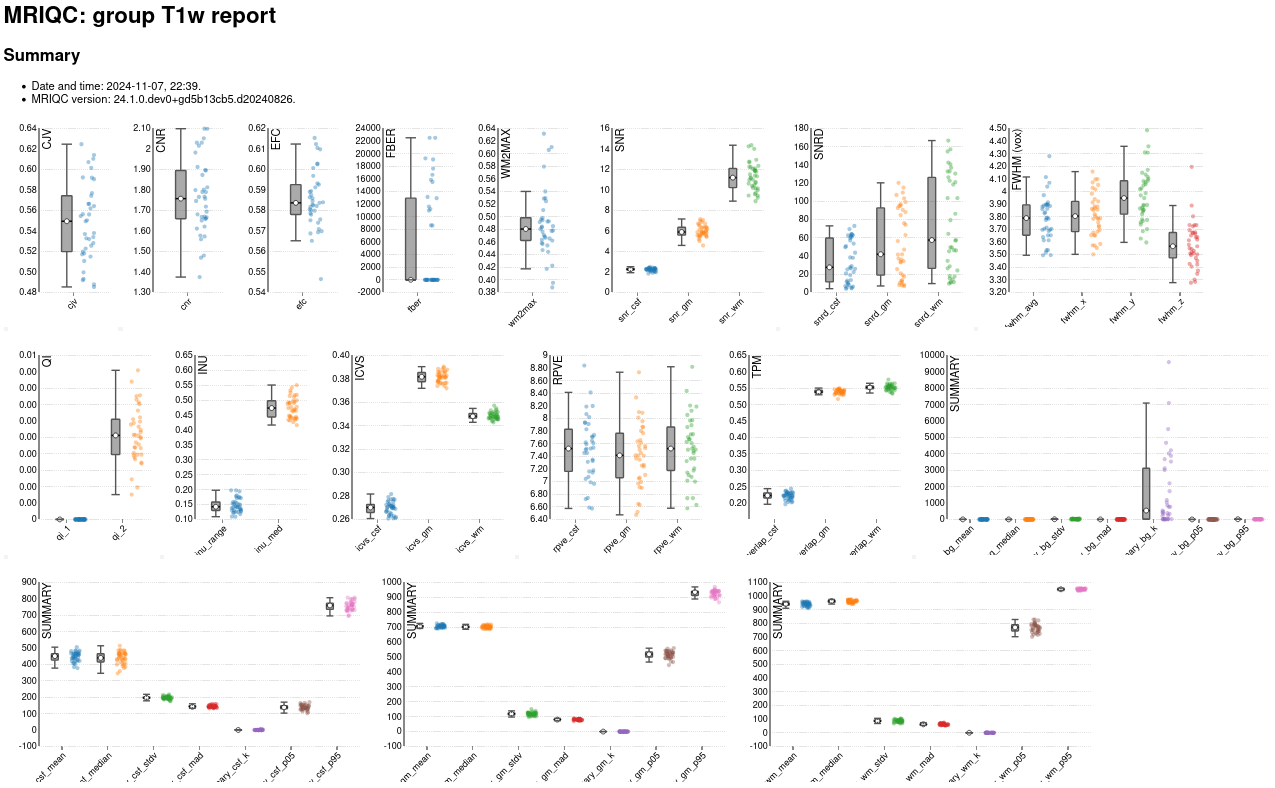
MRIQC
MRIQC CAT12
Next steps
- Create database of Quality measures
- QC your dataset: Let's run QCworkflow together
- Share your QC experiences and data
- Extend to functional MRI data:
- Identify useful image quality markers for fMRI
- Task or rest?