Problemas de diseño de información cuantitativa
Antecedentes
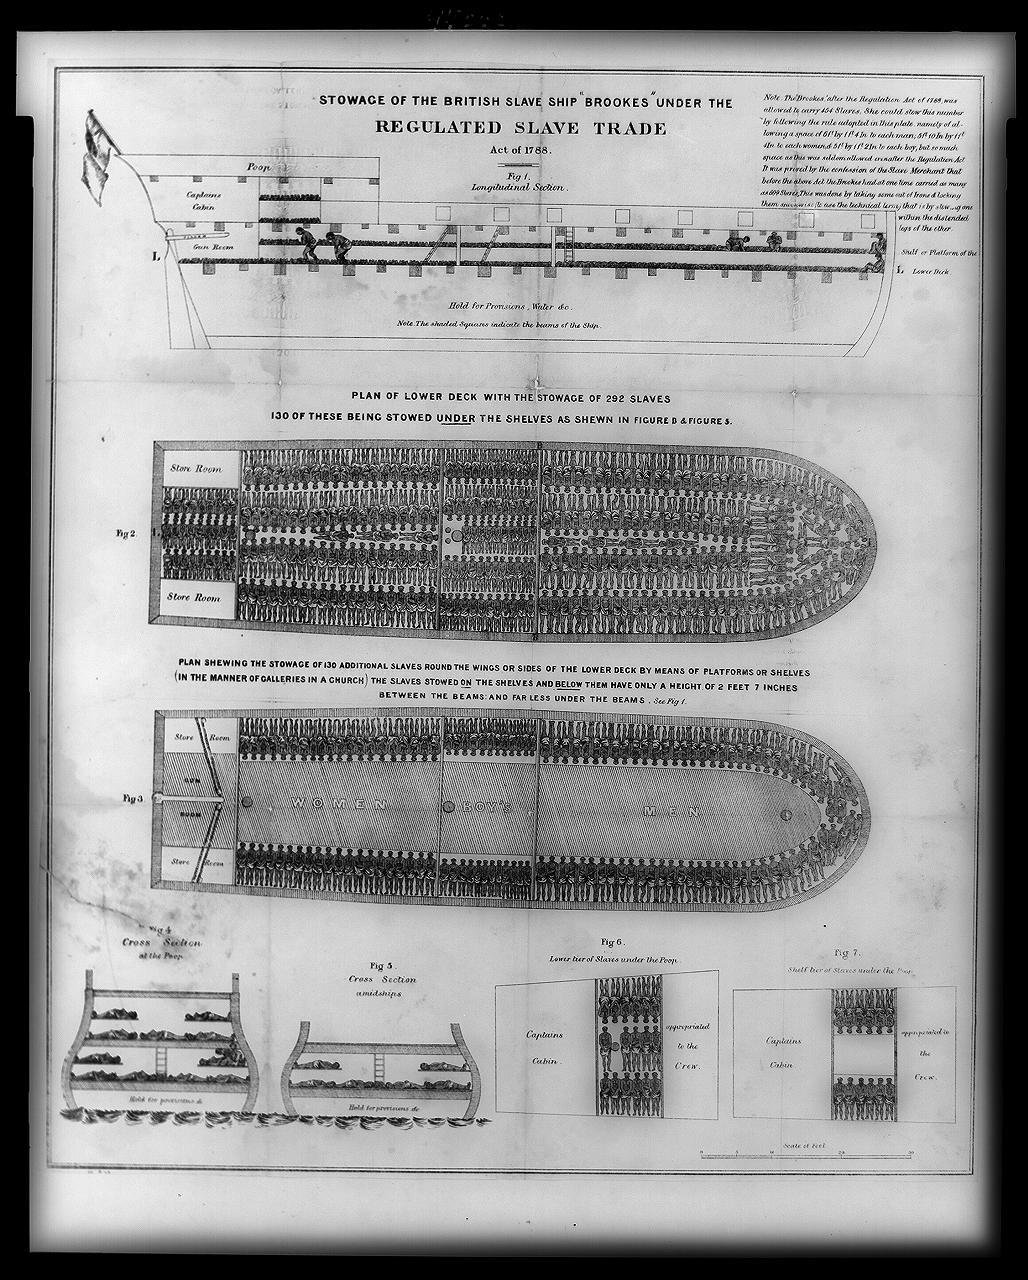
Stowage of the British Slave Ship 'Brookes' under the Regulated Slave Trade, Act of 1788
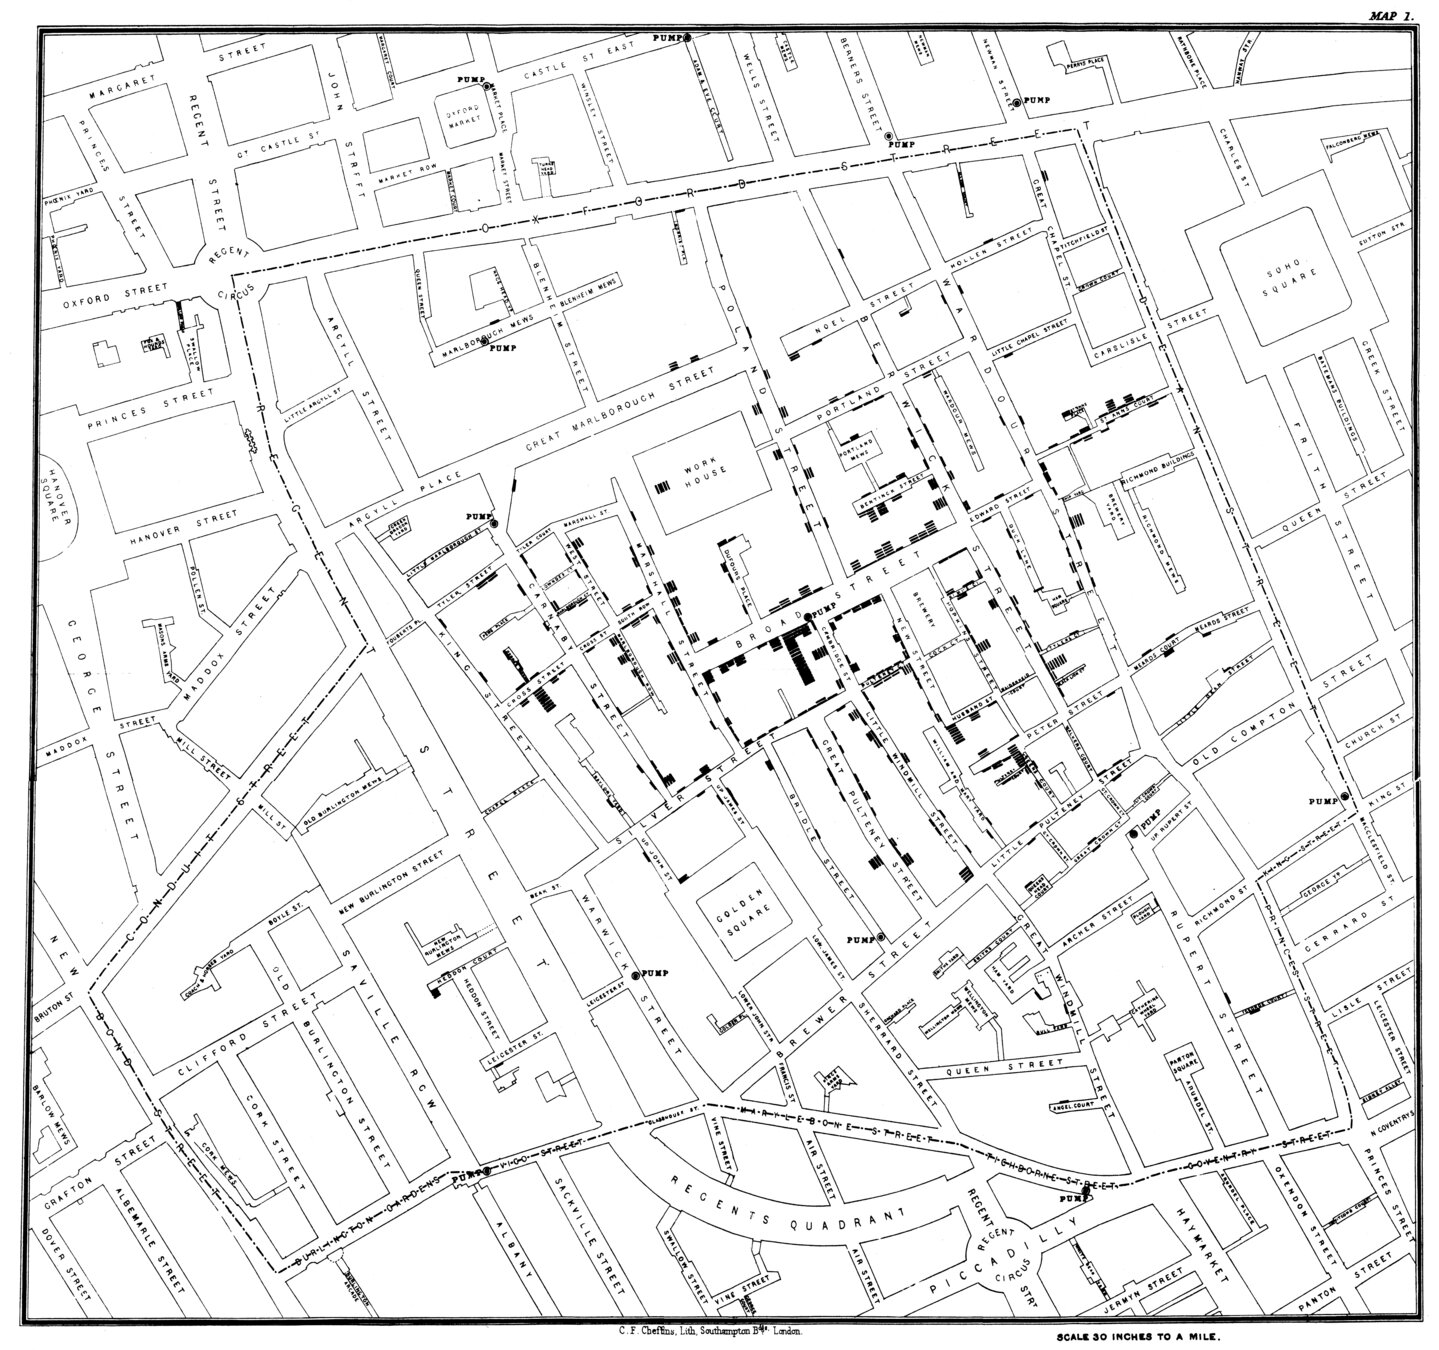
John Snow, 1855: On the Mode of Communication of Cholera
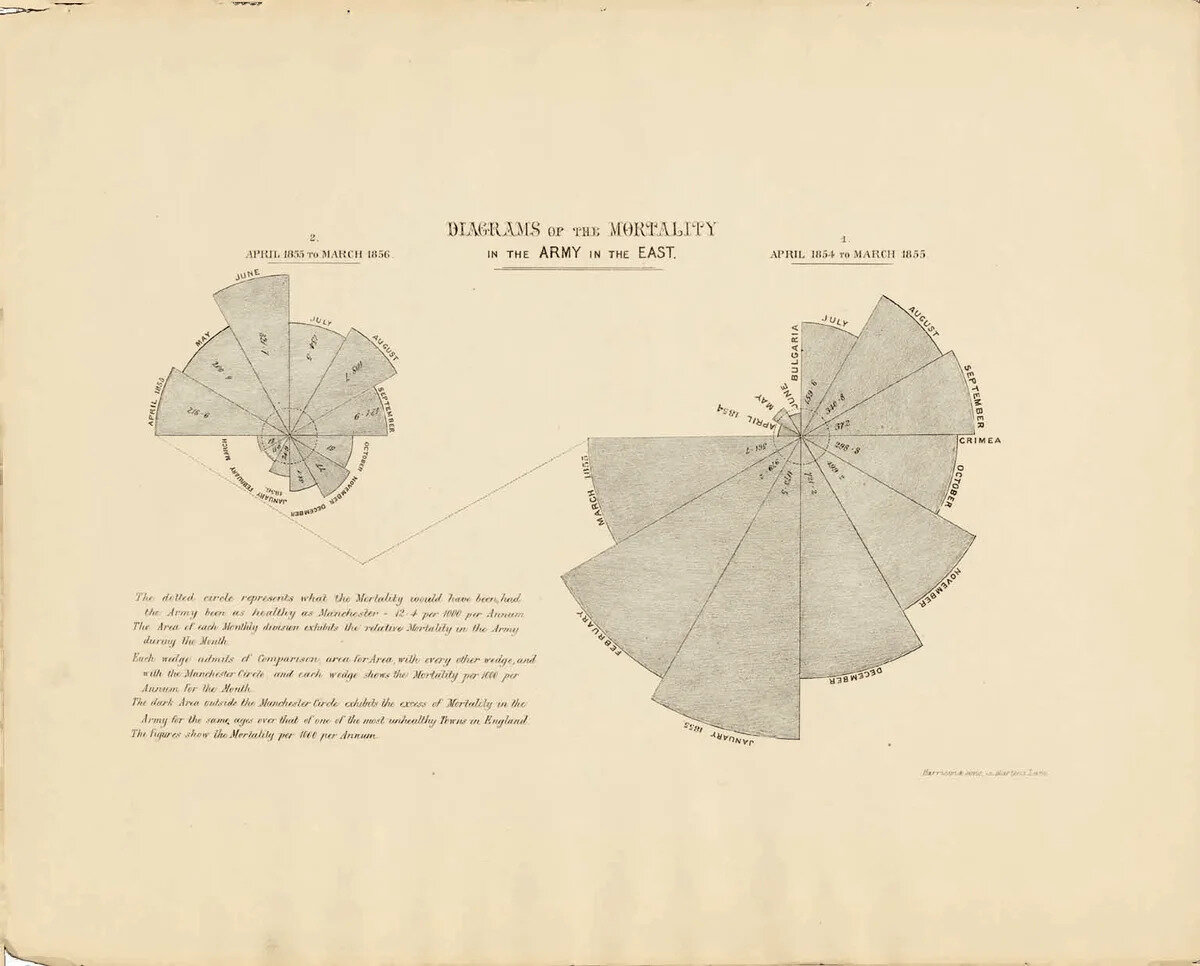
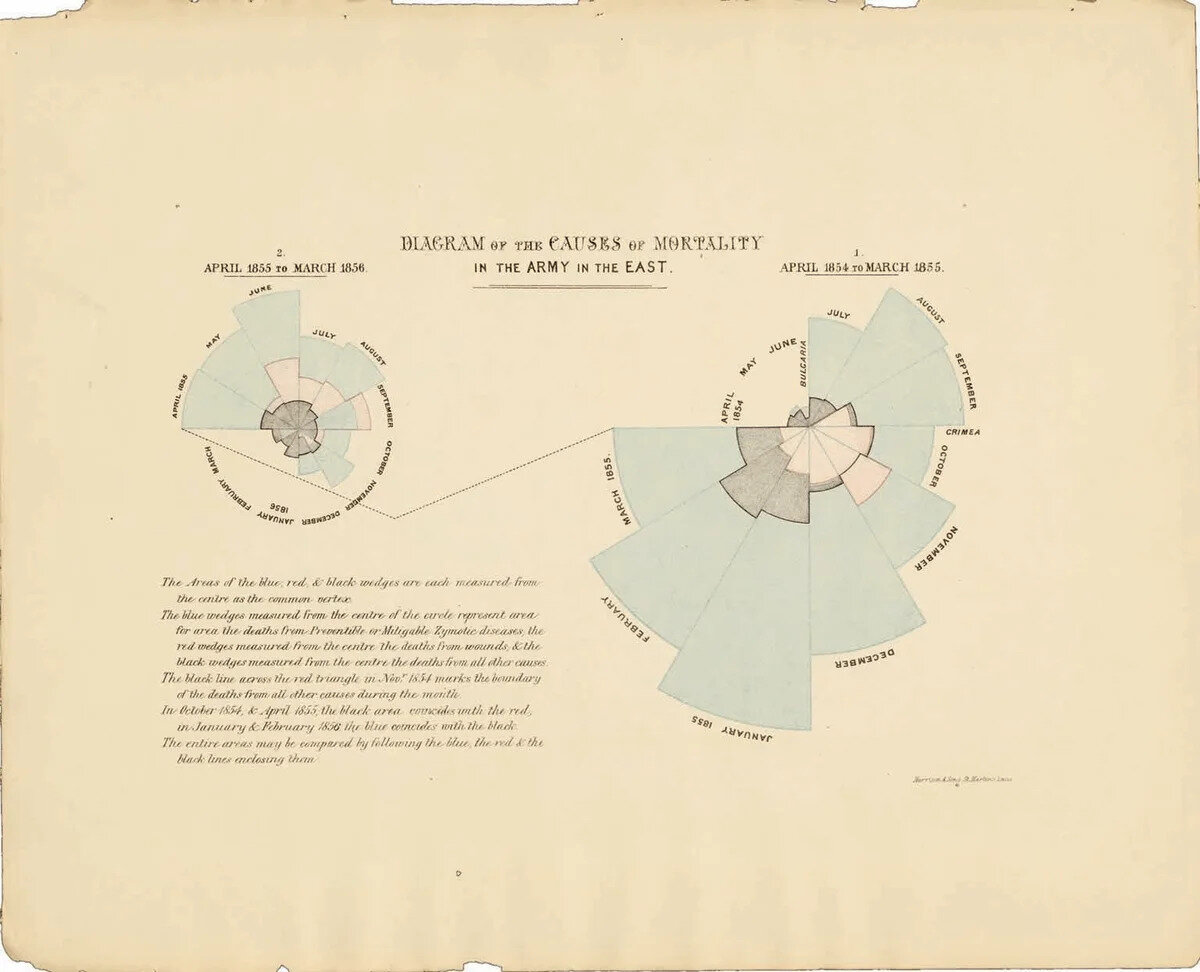
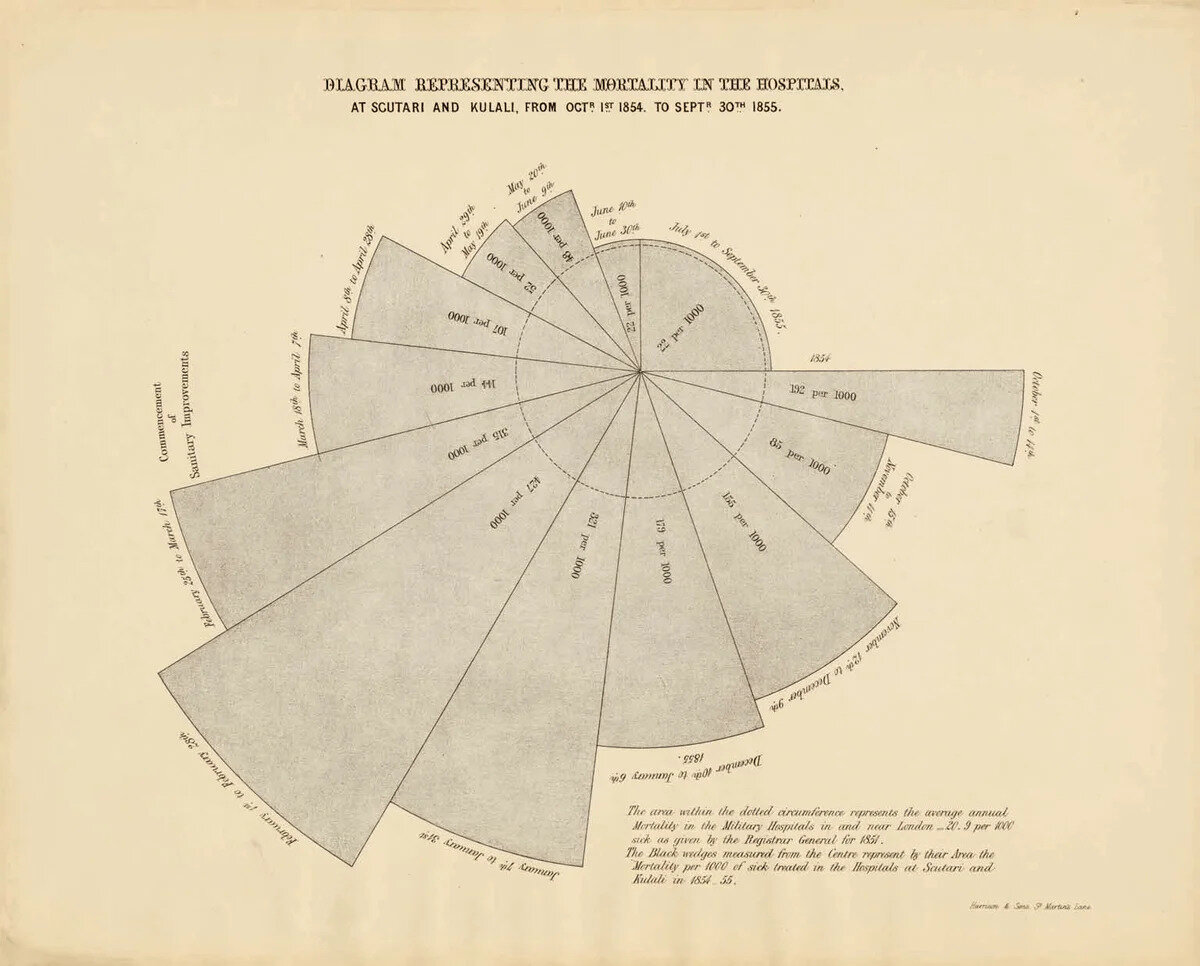
Florence Nightingale, 1858: Notes on Matters Affecting the Health, Efficiency and Hospital Administration of the British Army
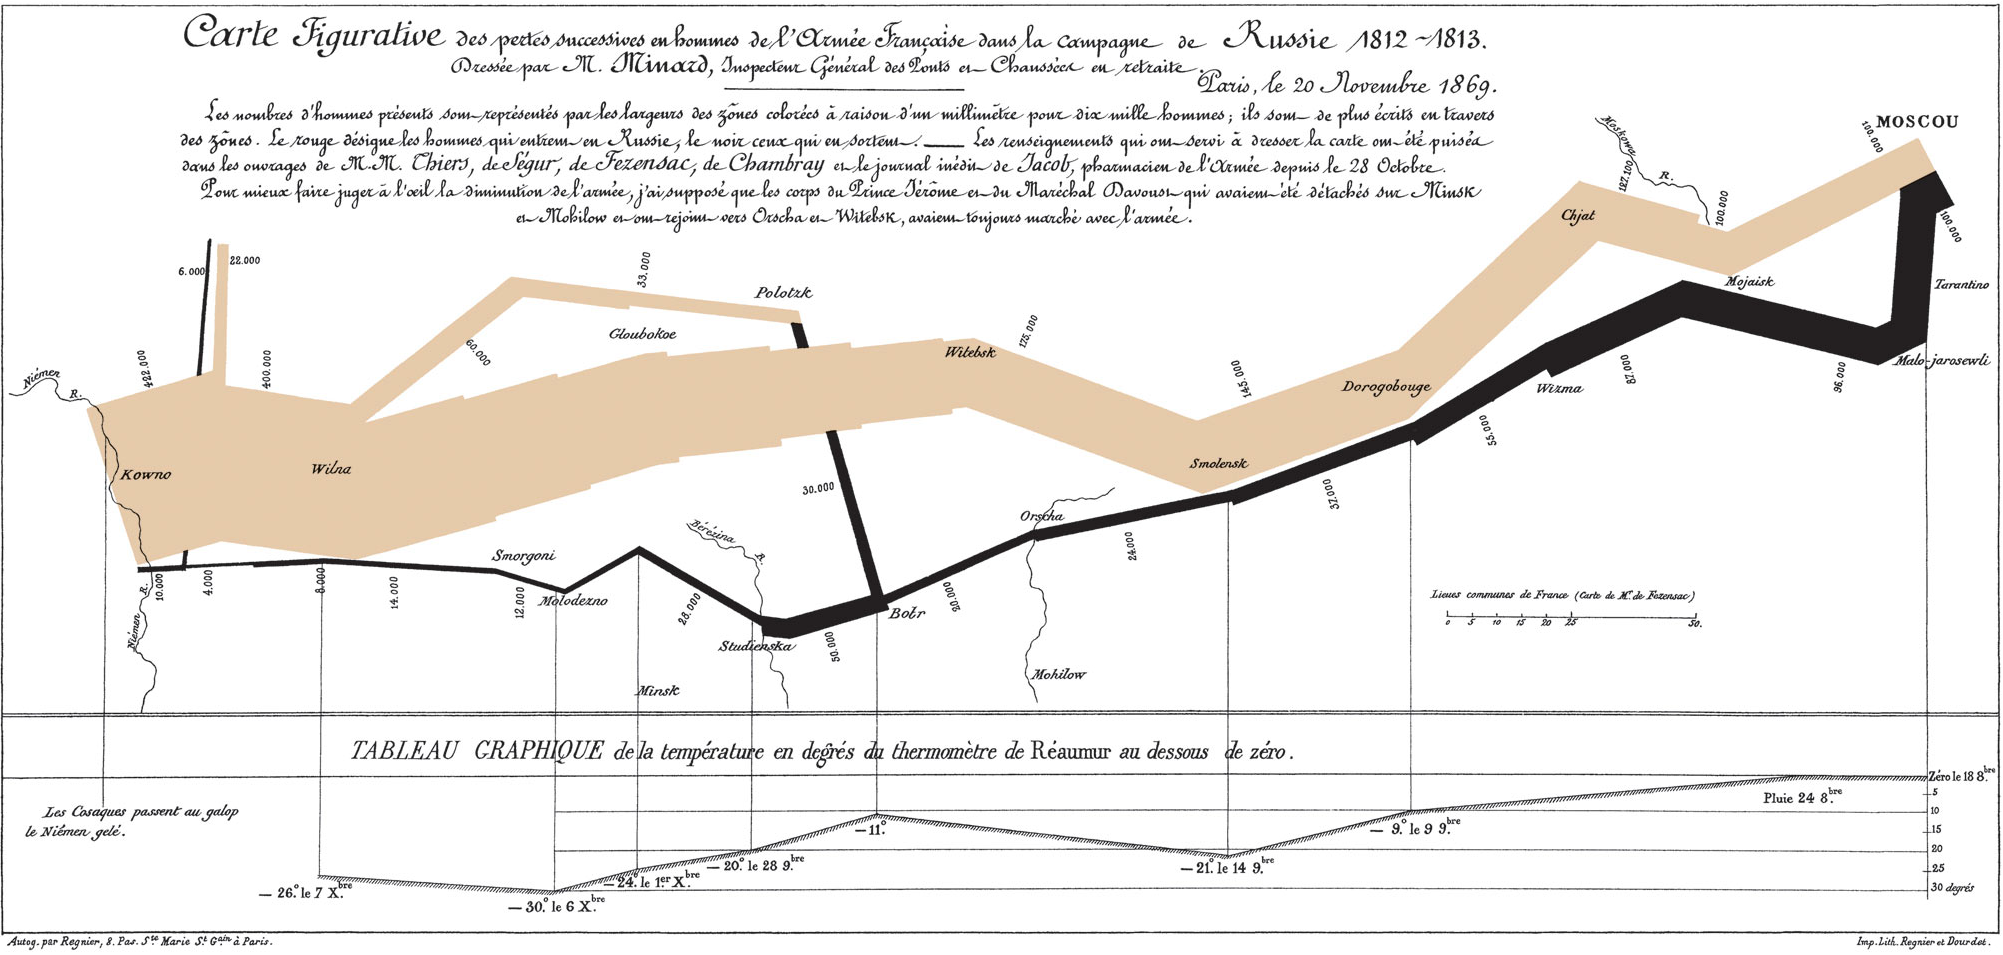
Charles Joseph Minard, 1869: Mapa figurativo de las bajas sucesivas del ejército francés en la campaña de Rusia de 1812-1813
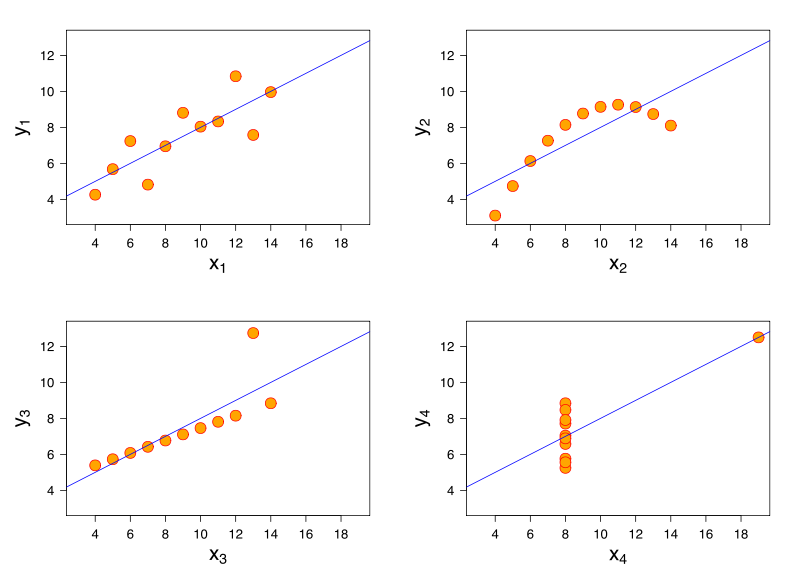
Considerando los cuatro conjuntos de datos, ¿qué podemos decir sobre ellos?
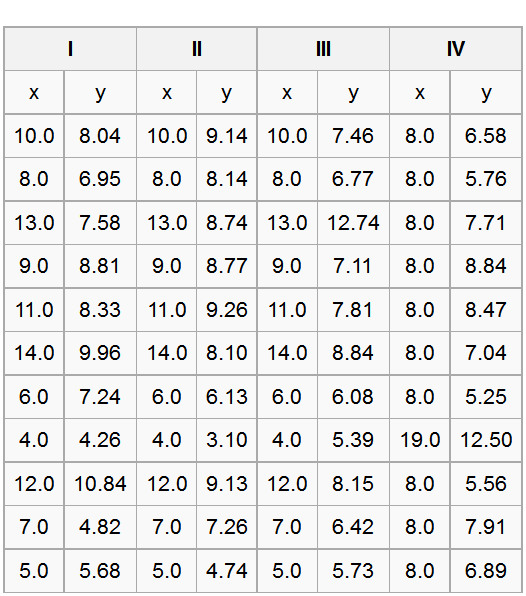
Francis Anscombe, 1973: Graphs in statistical analysis
| Propiedad | Valor |
|---|---|
| Media de x | 9 |
| Varianza de x | 11 |
| Media de y | 7.50 |
| Varianza de y | 4.125 |
| Correlación entre x & y | 0.816 |
| Línea de regresión | y = 3 + 0.5x |
¿Podemos afirmar que los cuatro conjuntos se comportan de la misma manera?
Francis Anscombe, 1973: Graphs in statistical analysis
Francis Anscombe, 1973: Graphs in statistical analysis
Francis Anscombe, 1973: Graphs in statistical analysis
De acuerdo a Anscombe, la formación tradicional en estadística hacía menos el rol que las gráficas juegan en mejorar el comprendimiento de los datos:
- Los cálculos numéricos son exactos pero las gráficas no lo son
- Para un conjunto particular de datos existe solo un conjunto particular de cálculos que conforman un análisis estadístico correcto
- Realizar cálculos complicados es virtuoso, mirar los datos es hacer trampa
Alberto Cairo, 2016: La docena del datasaurio
Once upon a time, statisticians only explored. Then they learned to confirm exactly—to confirm a few things exactly, each under very specific circumstances. As they emphasized exact confirmation, their techniques inevitably became less flexible. The connection of the most used techniques with past insights was weakened. Anything to which a confirmatory procedure was not explicitly attached was decried as 'mere descriptive statistics', no matter how much we had learned from it
John Tukey, 1977: Exploratory Data Analysis
El análisis exploratorio de datos no es una metodología sino la idea de que no se puede llegar a un conjunto de datos con ideas preconcebidas o sólo para demostrar algo, sino que es algo digno de ser explorado y de lo cuál pueden surgir hipótesis
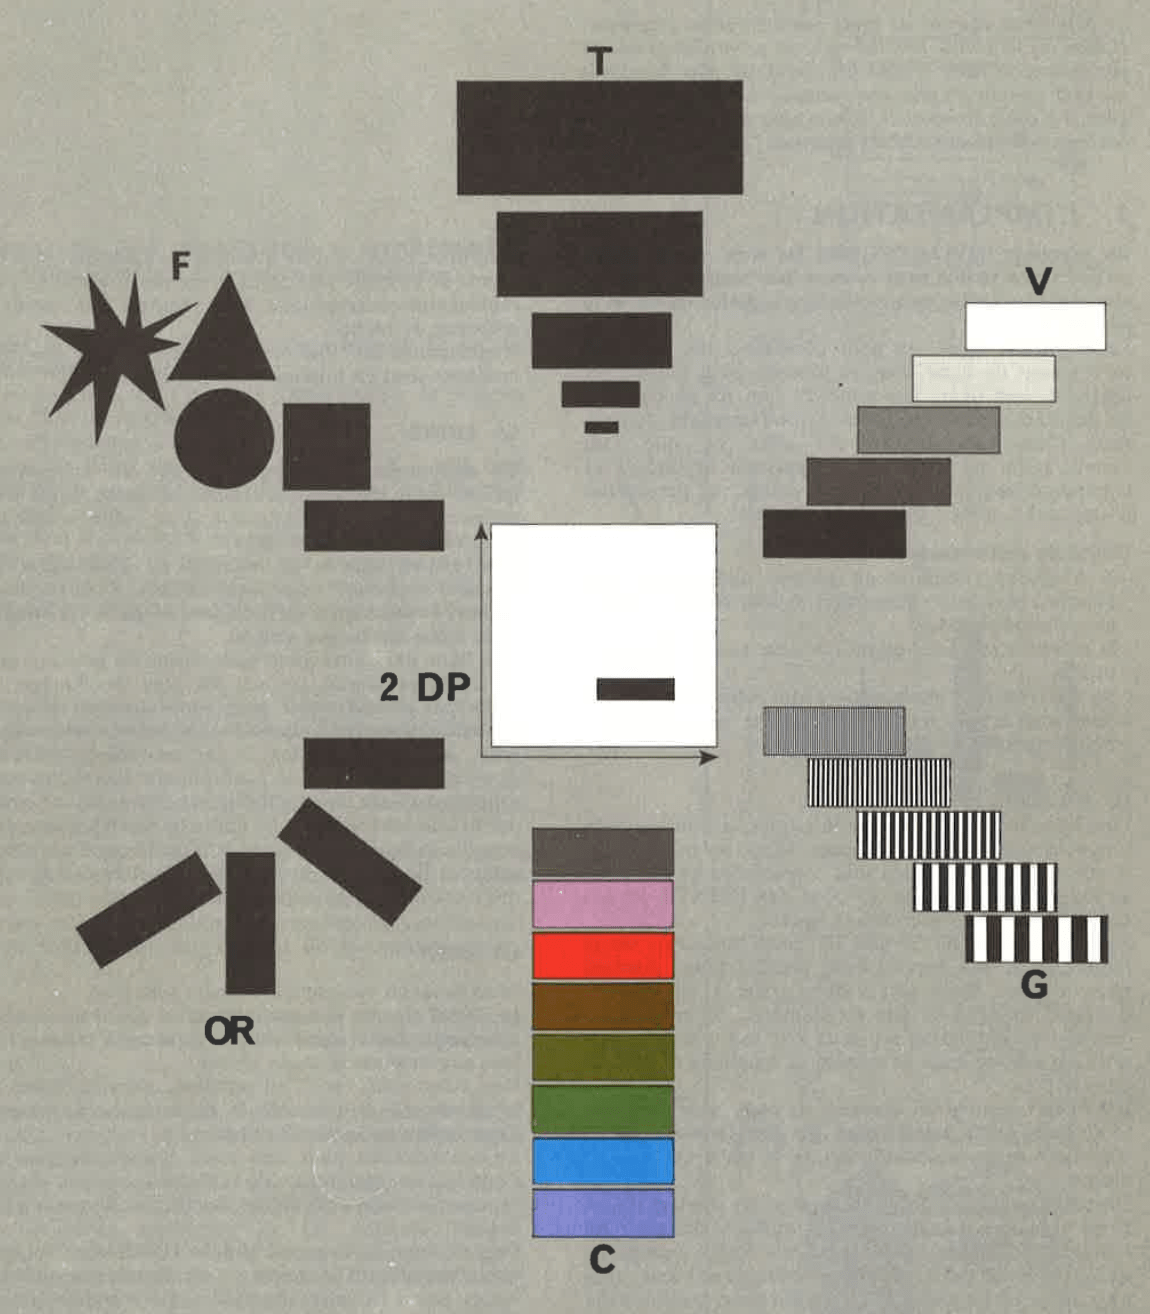
Jacques Bertin, 1967: Semiology of graphics
Variables visuales:
- Tamaño
- Valor (luminosidad)
- Grano (textura)
- Color (tinte)
- Orientación
- Forma
- Posición
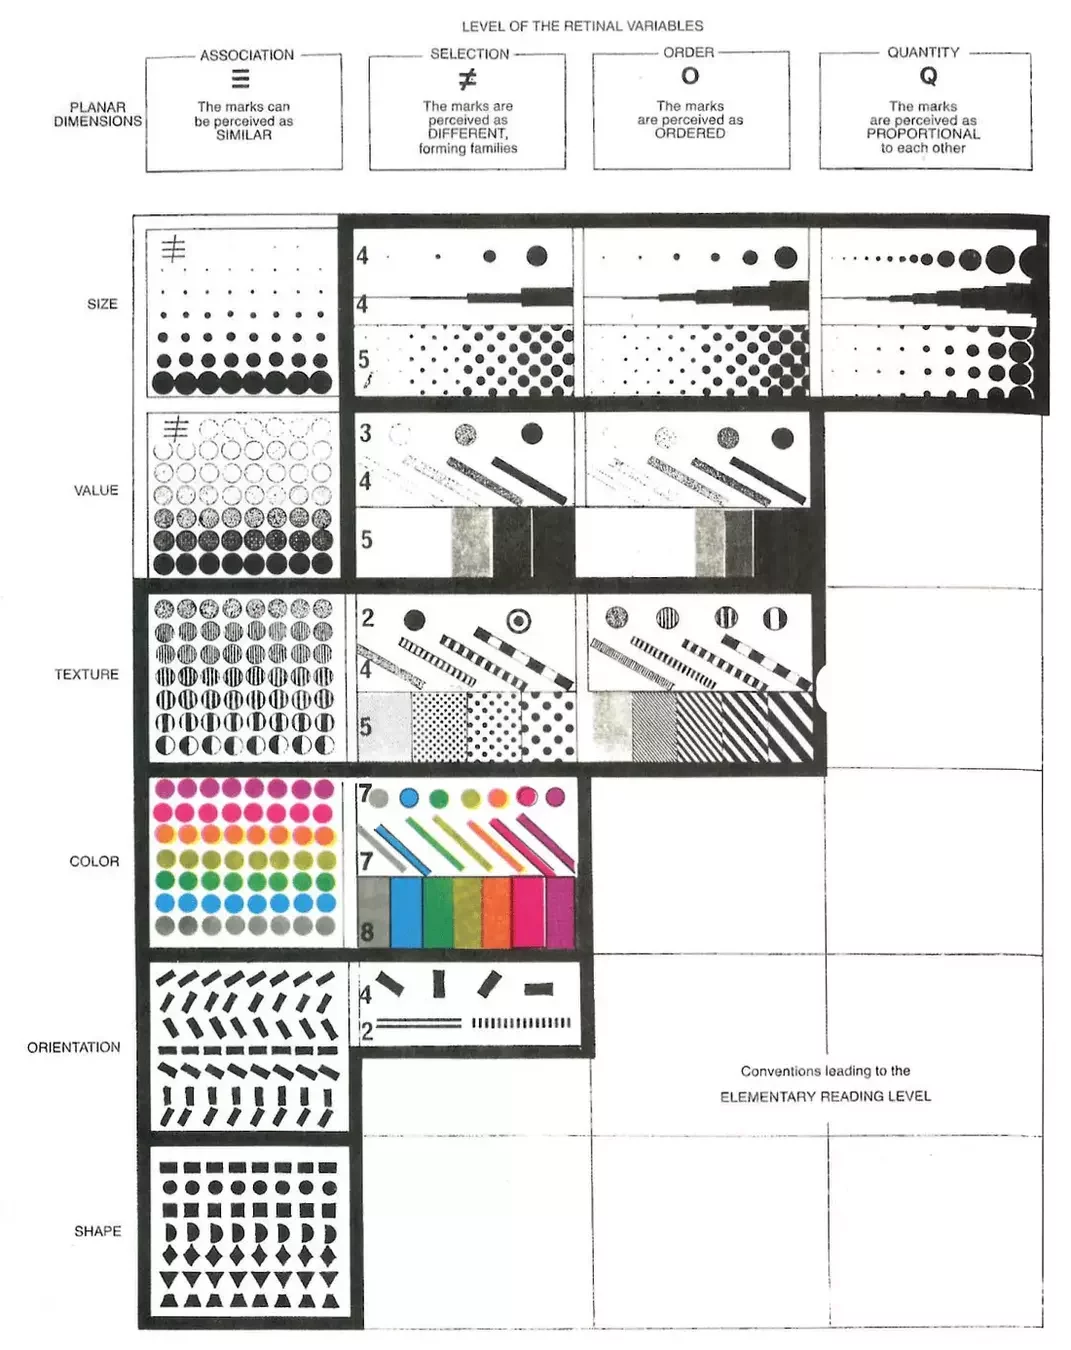
Jacques Bertin, 1967: Semiology of graphics
Propiedades de las variables:
- Asociativa
- Selectiva
- Ordenada
- Cuantitativa
Jacques Bertin, 1967: Semiology of graphics
Propiedades de las variables:
- Asociativa
- Selectiva
- Ordenada
- Cuantitativa
Jacques Bertin, 1967: Semiology of graphics
| Tamaño | Valor | Grano | Color | Orientación | Forma | Posición | |
|---|---|---|---|---|---|---|---|
| Asociativa | ♢ | ♢ | ♢ | ♢ | ♢ | ||
| Selectiva | ♢ | ♢ | ♢ | ♢ | ♢ | ♢ | |
| Ordenada | ♢ | ♢ | ♢ | ♢ | |||
| Cuantitativa | ♢ | ♢ |
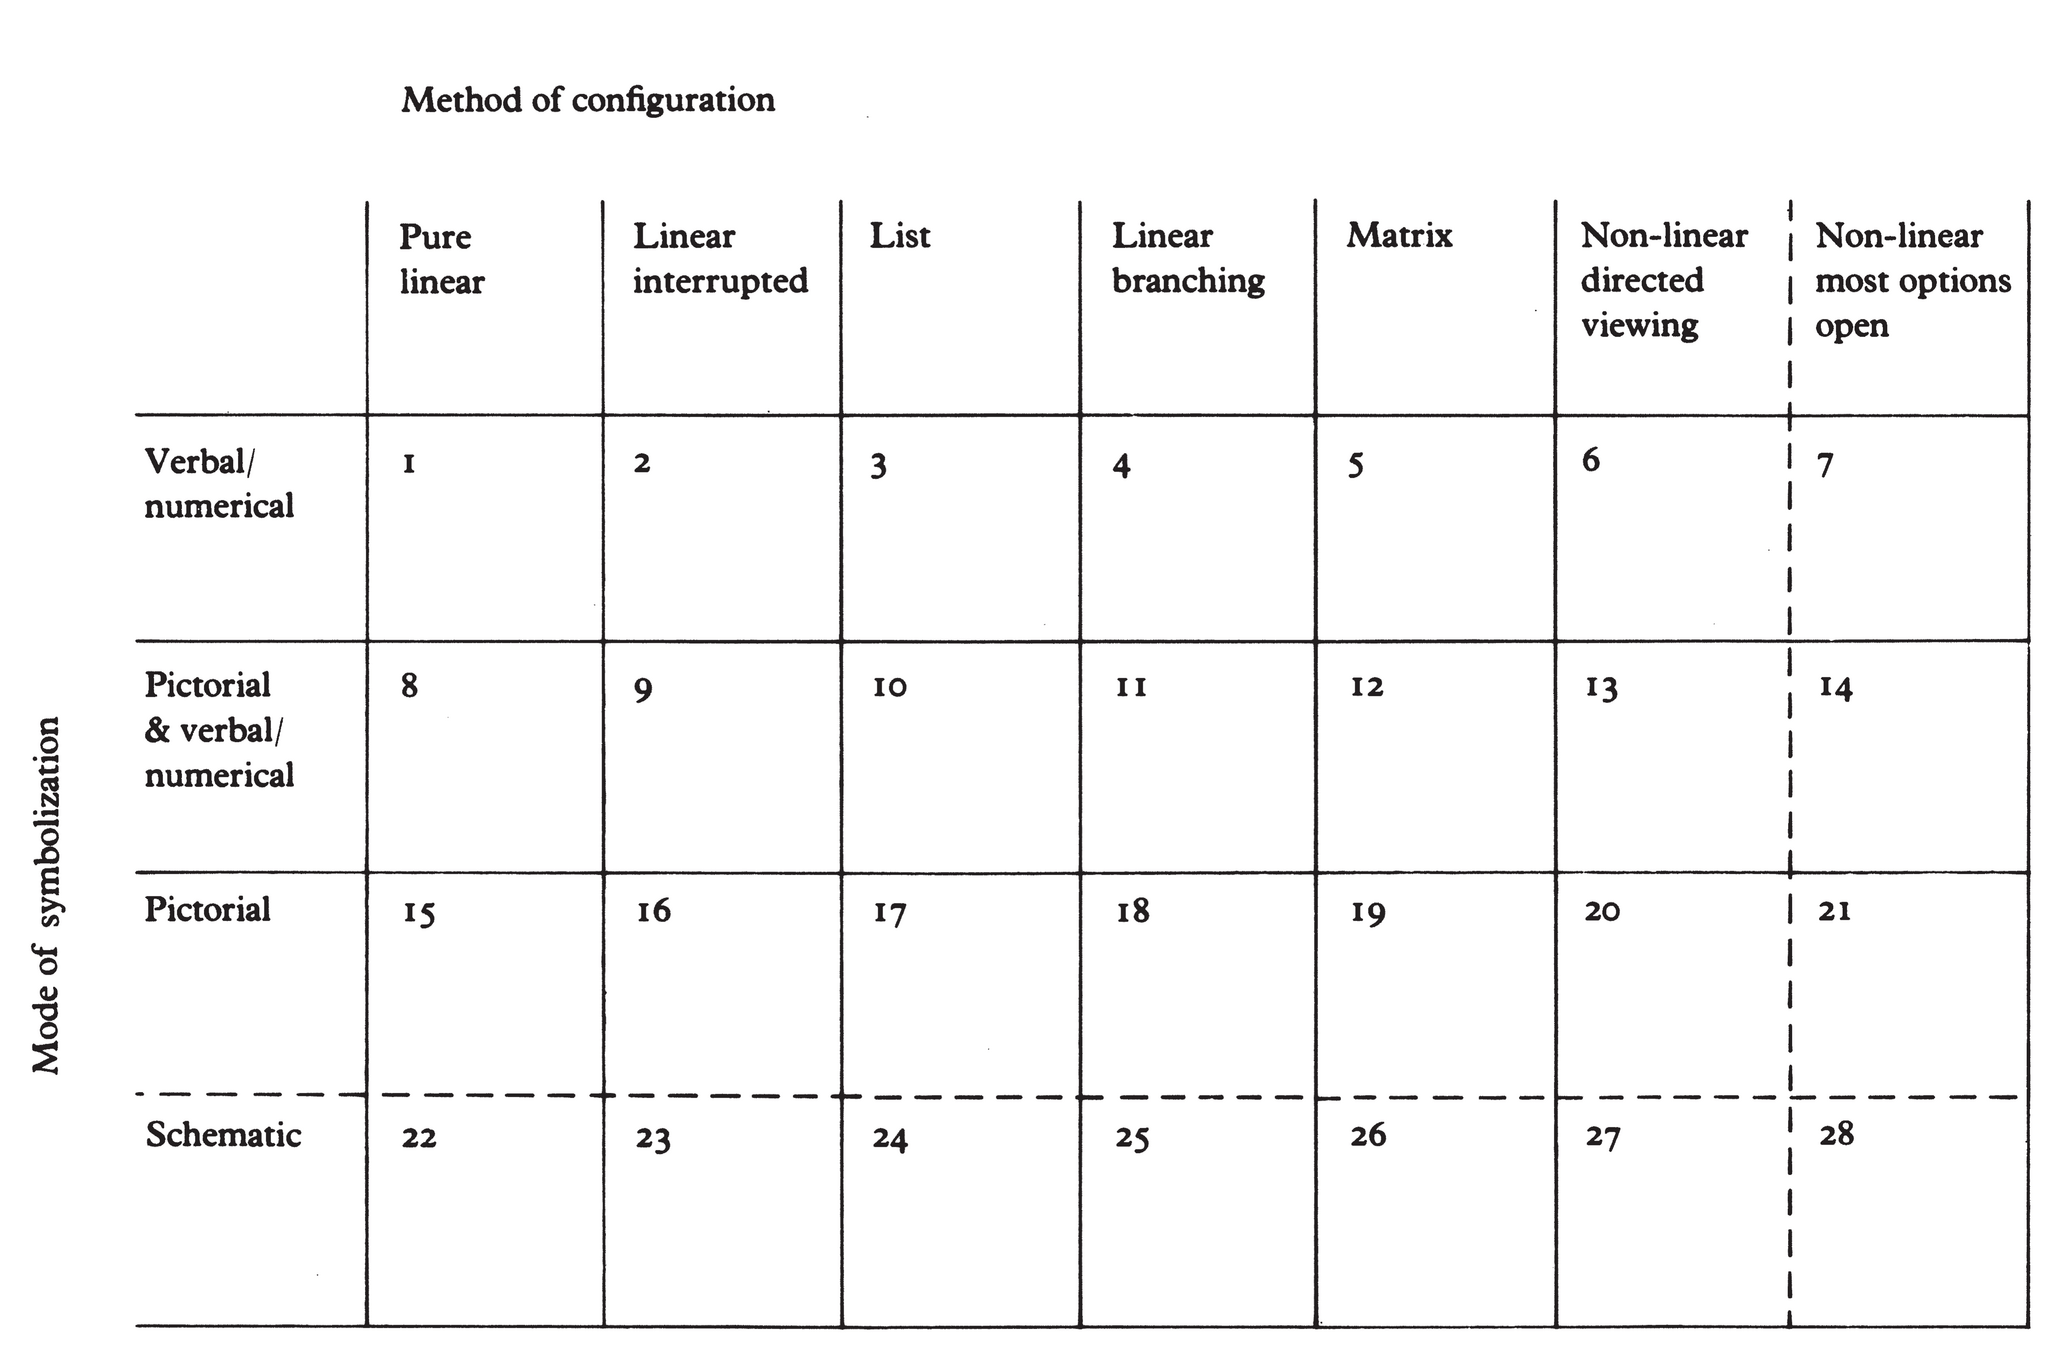
Michael Twyman, 1979: A schema for the study of graphic language
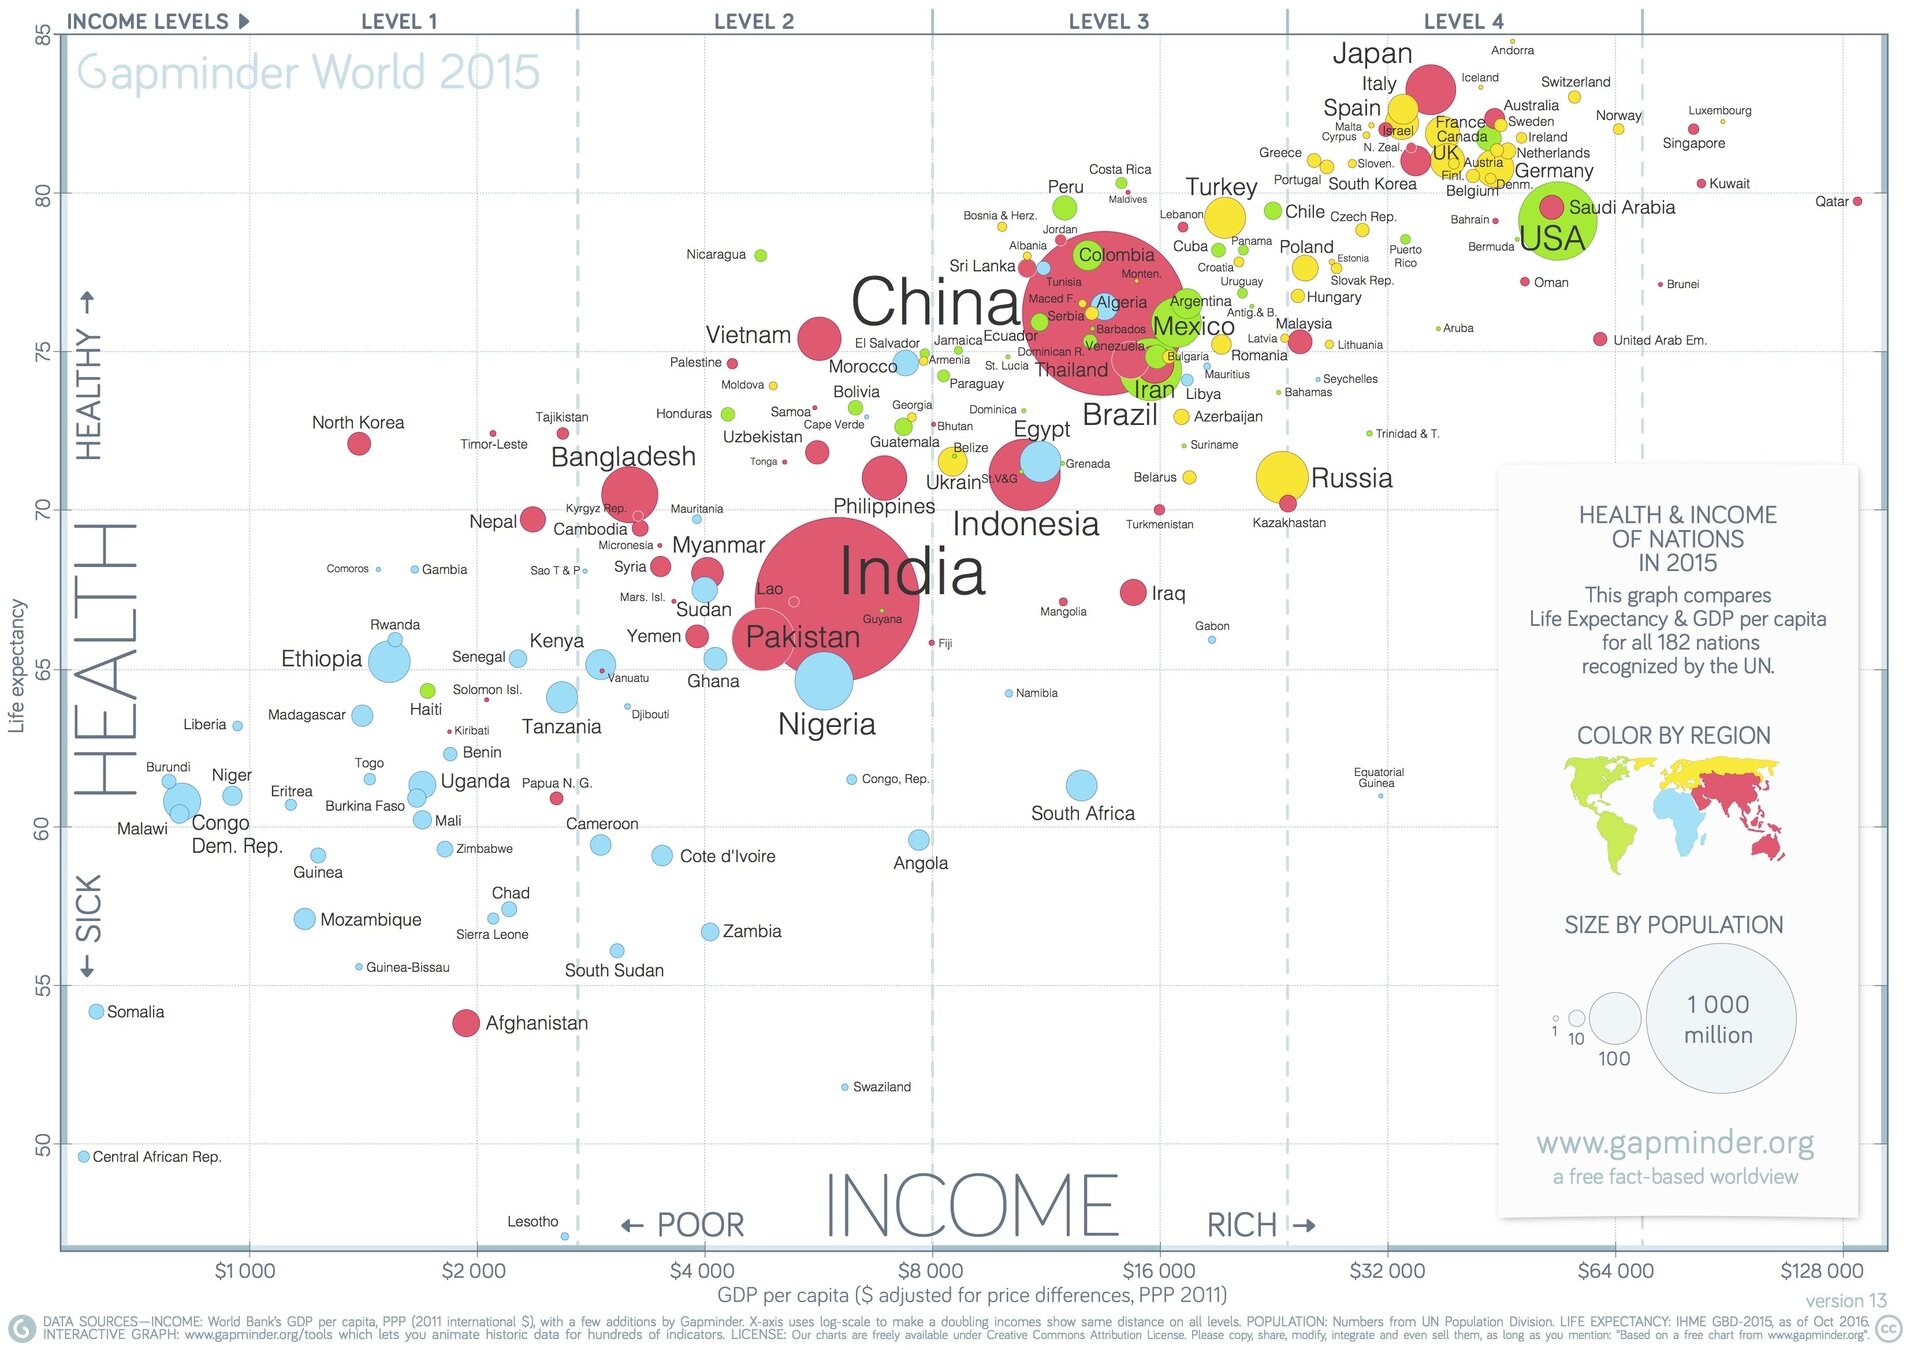
Hans Rosling, 2006: The best stats you've ever seen