Chart Question Answering Workshop

best paper + best poster!
challenge winners!
Chart Question Answering Workshop
Thank you to the Program Committee!
Donglai Wei, Harvard University: Expert in VQA / Computer Vision
Hendrik Strobelt, MIT-IBM Watson AI Lab: Expert in eXplainable AI and Visualization
Funda Durupinar-Babur, University of Massachusetts Boston: Expert in Computer Graphics
Chart Question Answering Workshop
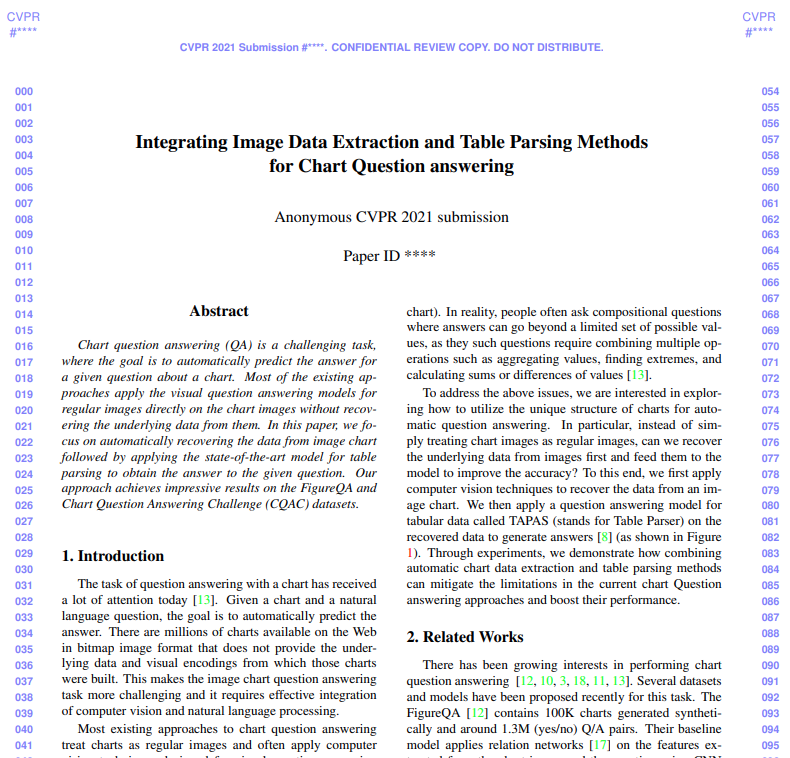
Ahmed Masry and Enamul Hoque Prince
York University
Chart Question Answering Workshop
Presentation!
Ahmed Masry and Enamul Hoque Prince
York University
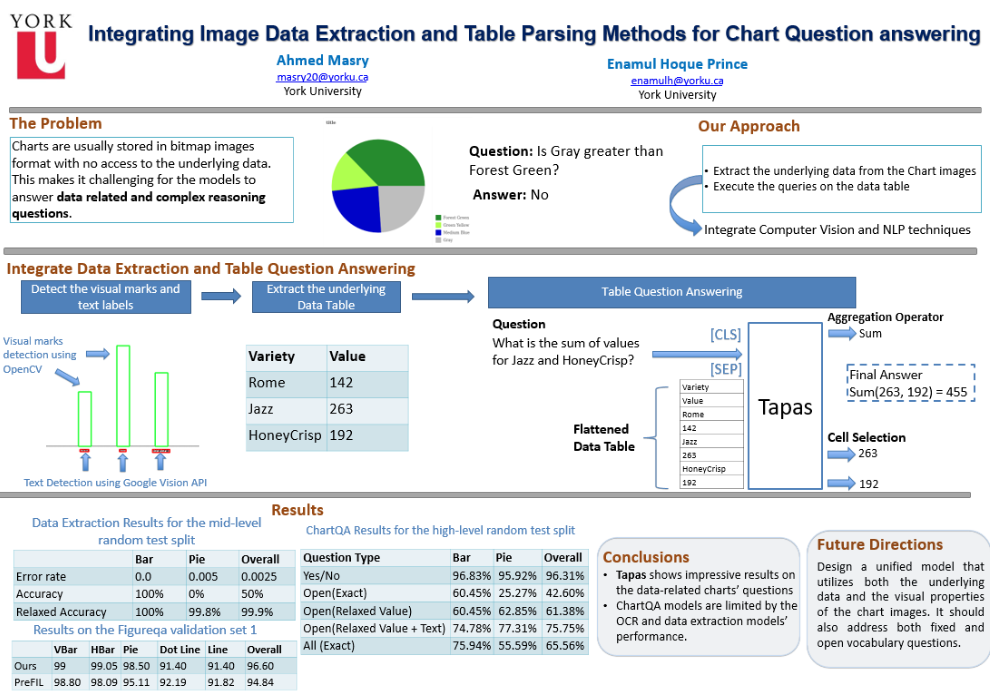
Chart Question Answering Workshop
Best Paper + Best Poster!
Chart Question Answering Workshop
The CQA Challenge
Hayoun Oh

Harvard University
Chart Question Answering Workshop
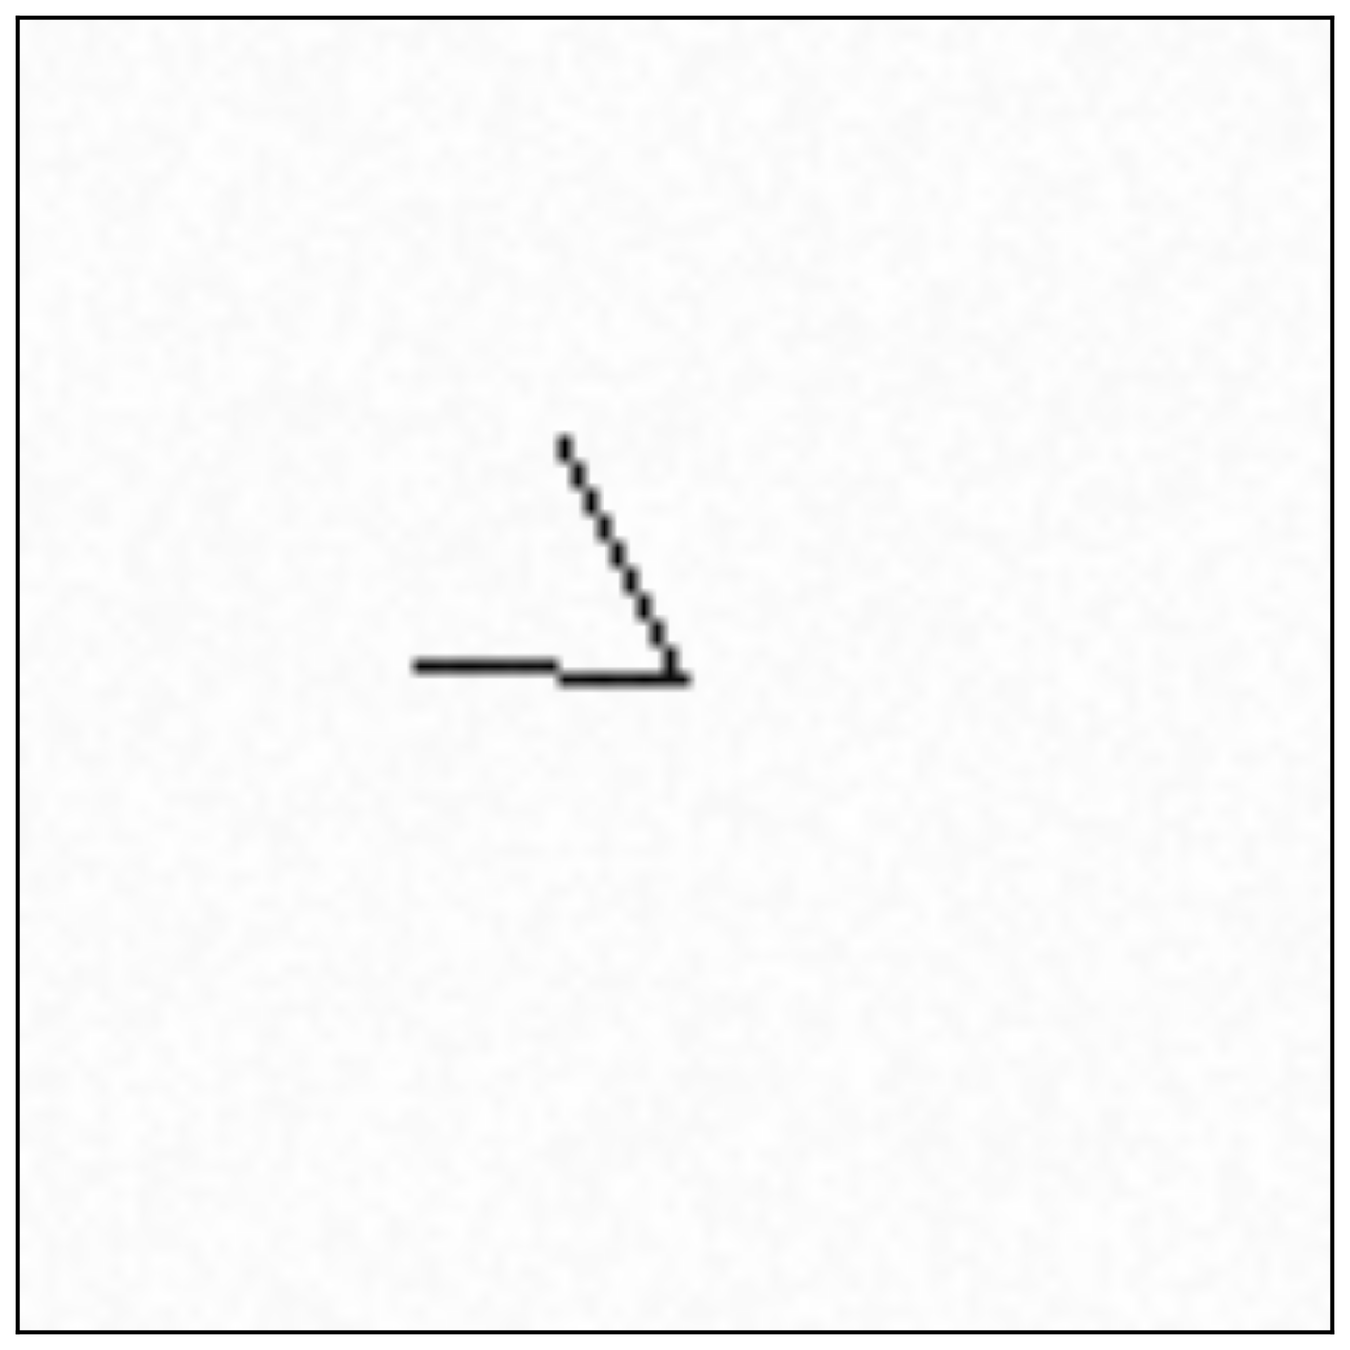


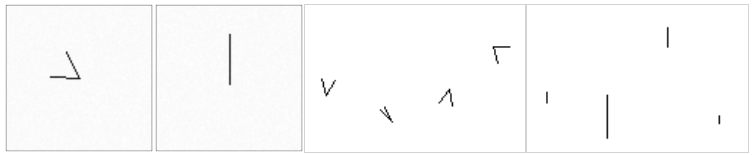
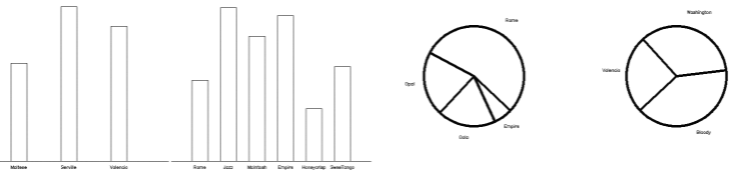
Level 1
Low-level visual encodings inspired
by Cleveland and McGill's 1984/1985
experiments of human perception
Chart Question Answering Workshop
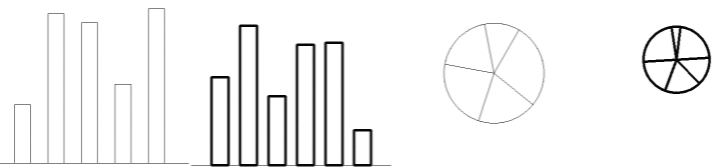
Level 2
Simple bar and pie charts with stroke width variations
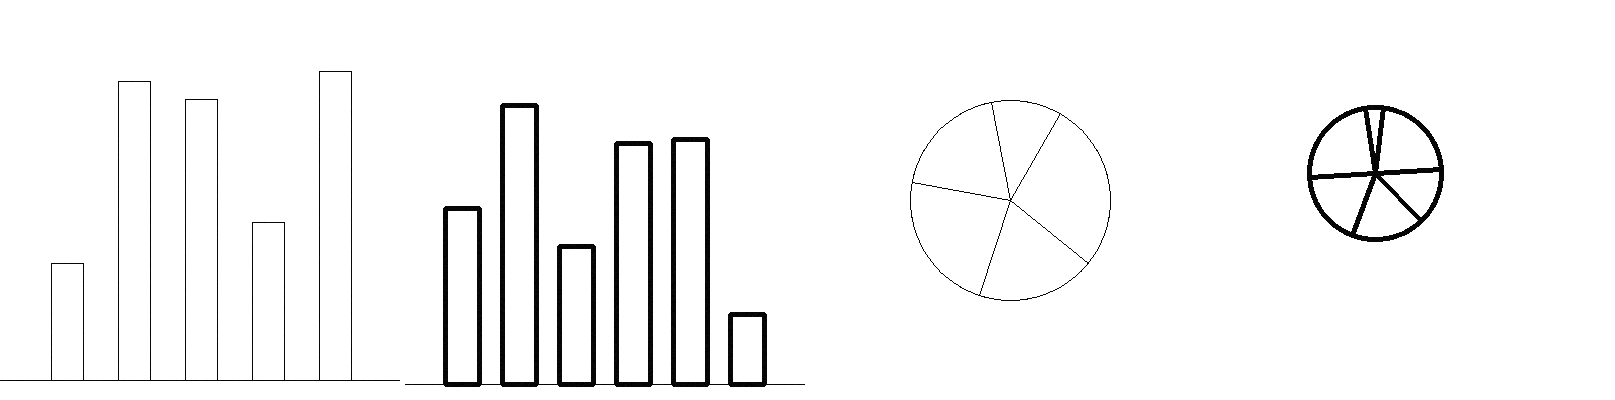
Data provided by Yunhai Wang and his team
Chart Question Answering Workshop
Level 3
Charts include textual information
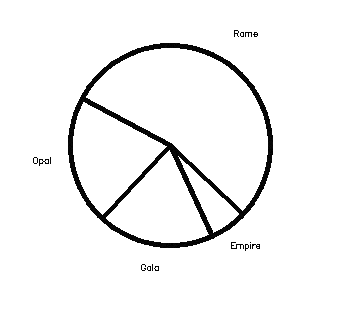
Semantic questions
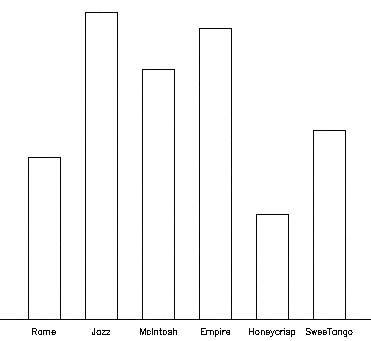
Which variety has the maximum value?
What is the sum of values for Empire and Honeycrisp?
Is Opal bigger than Gala?
Is Opal bigger than the sum of Empire and Gala?
Challenge stays open!
New datasets are coming!
Chart Question Answering Workshop
Coming soon at LE-V-EL.org!
Chart Question Answering Workshop
The Winners!
Chart Question Answering Workshop
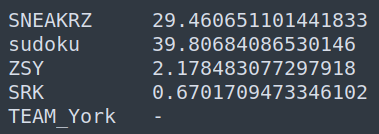
5 Teams
SNEAKRZ
sudoku
ZSY
SRK
TEAM_York
Chart Question Answering Workshop
Level 1
RMSE
Level 2
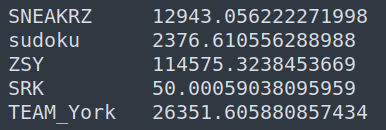
RMSE
Entropy + RMSE + Levenstein Edit Distance
Level 3
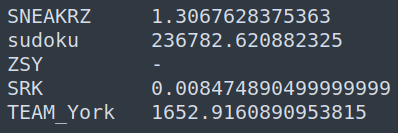
Team SRK!
Chart Question Answering Workshop
Team SRK!
Volodymir Melnyk ( for Level 1 ) and
Andrey Grigoryev ( for Levels 2 and 3 )
Presentation!
Chart Question Answering Workshop


Samira E. Kahou
Ritwick Chaudhry
Dae Hyun Kim
Yunhai Wang
5:35p
5:55p
6:15p
6:35p
continues in