


Be a Biomedical
Scientific Visualization
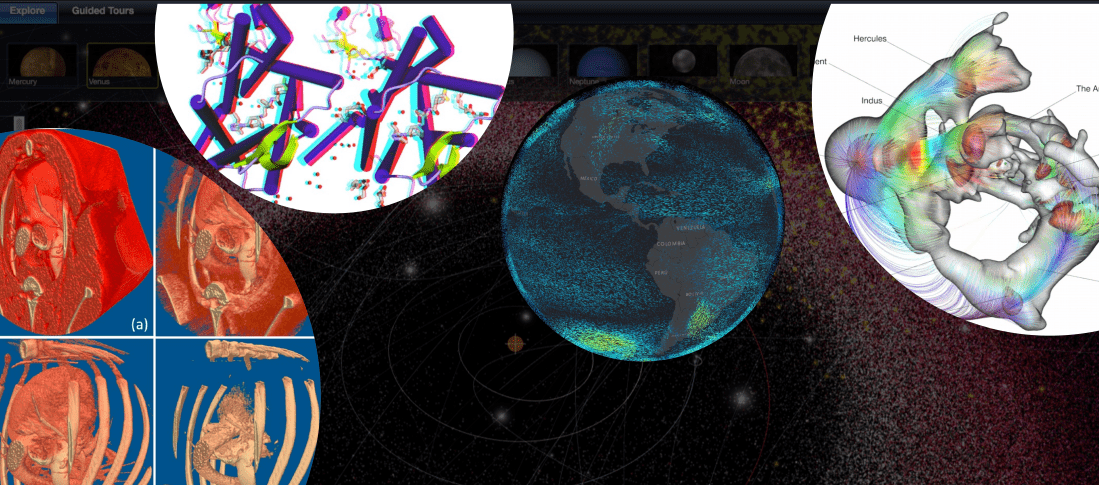
Scientific Visualization
Information Visualization
Data Visualization
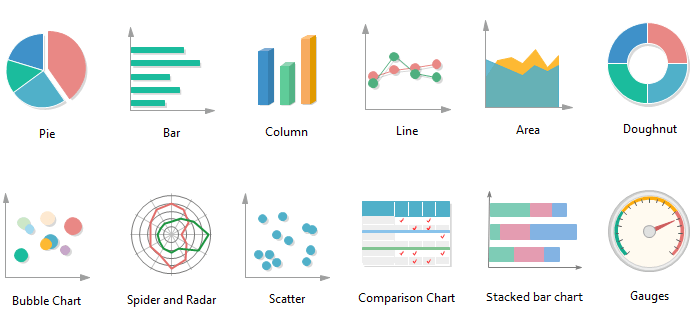
Charts
as building blocks
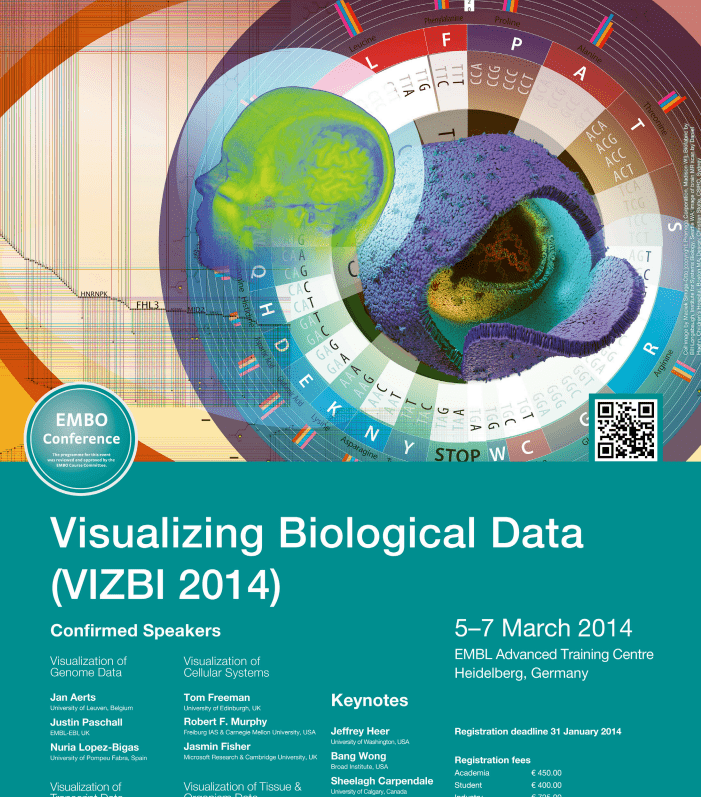
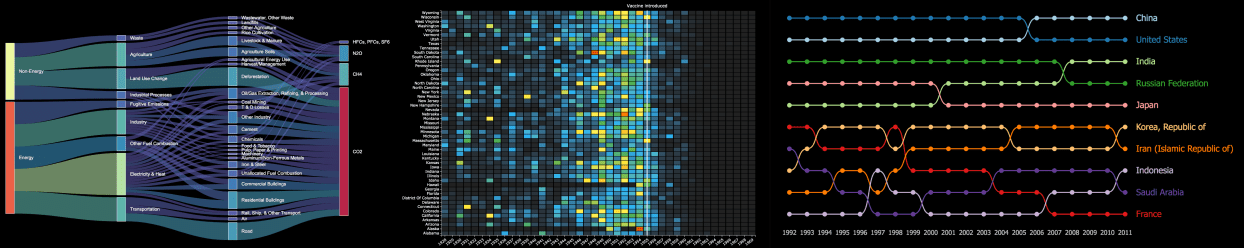
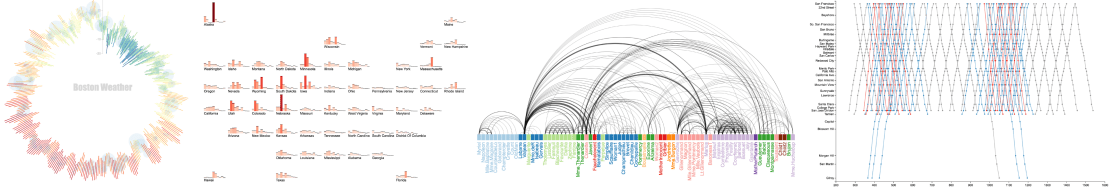
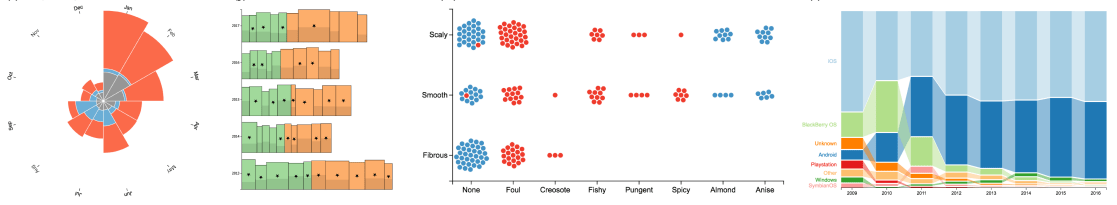
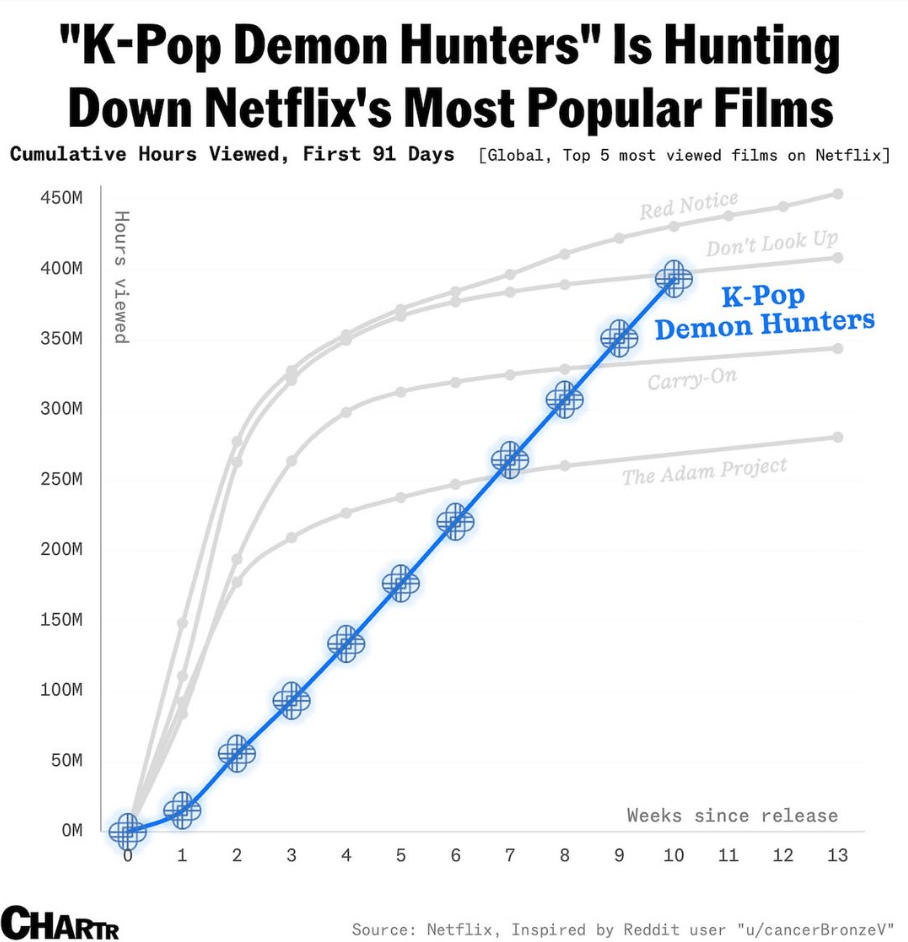
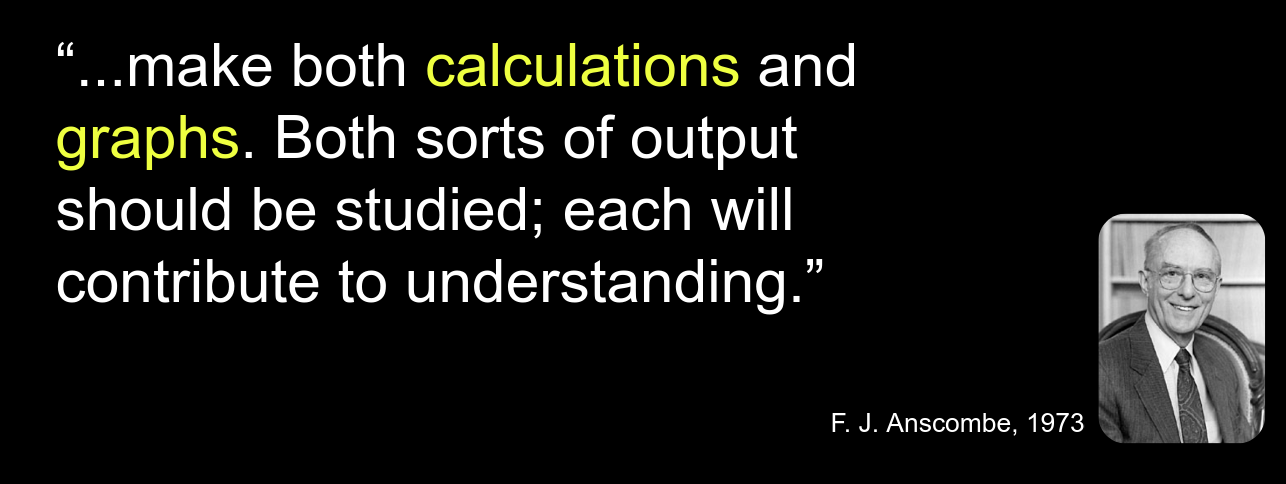
Let's look at some examples
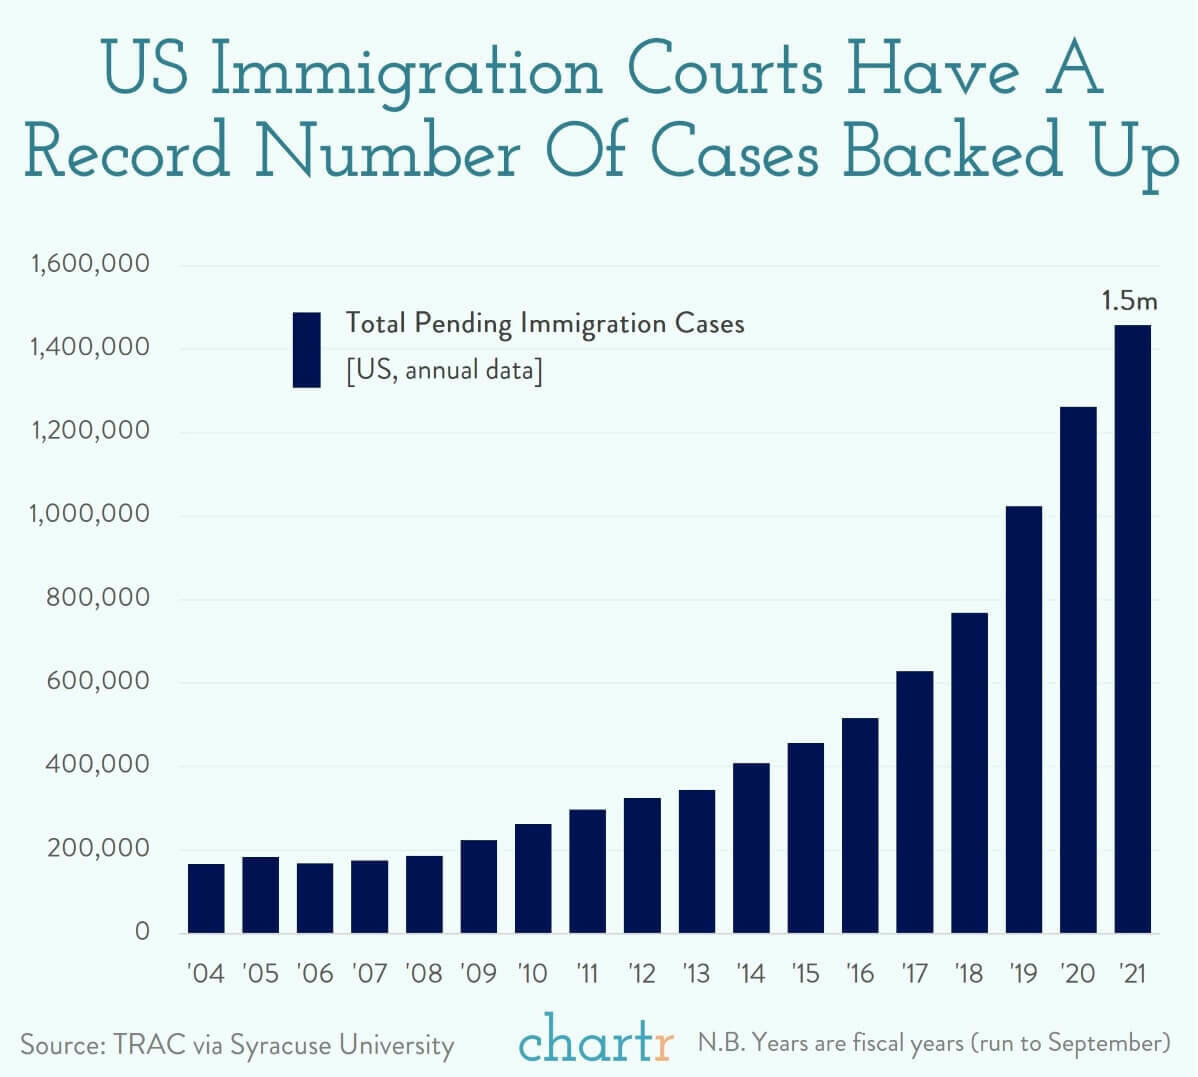
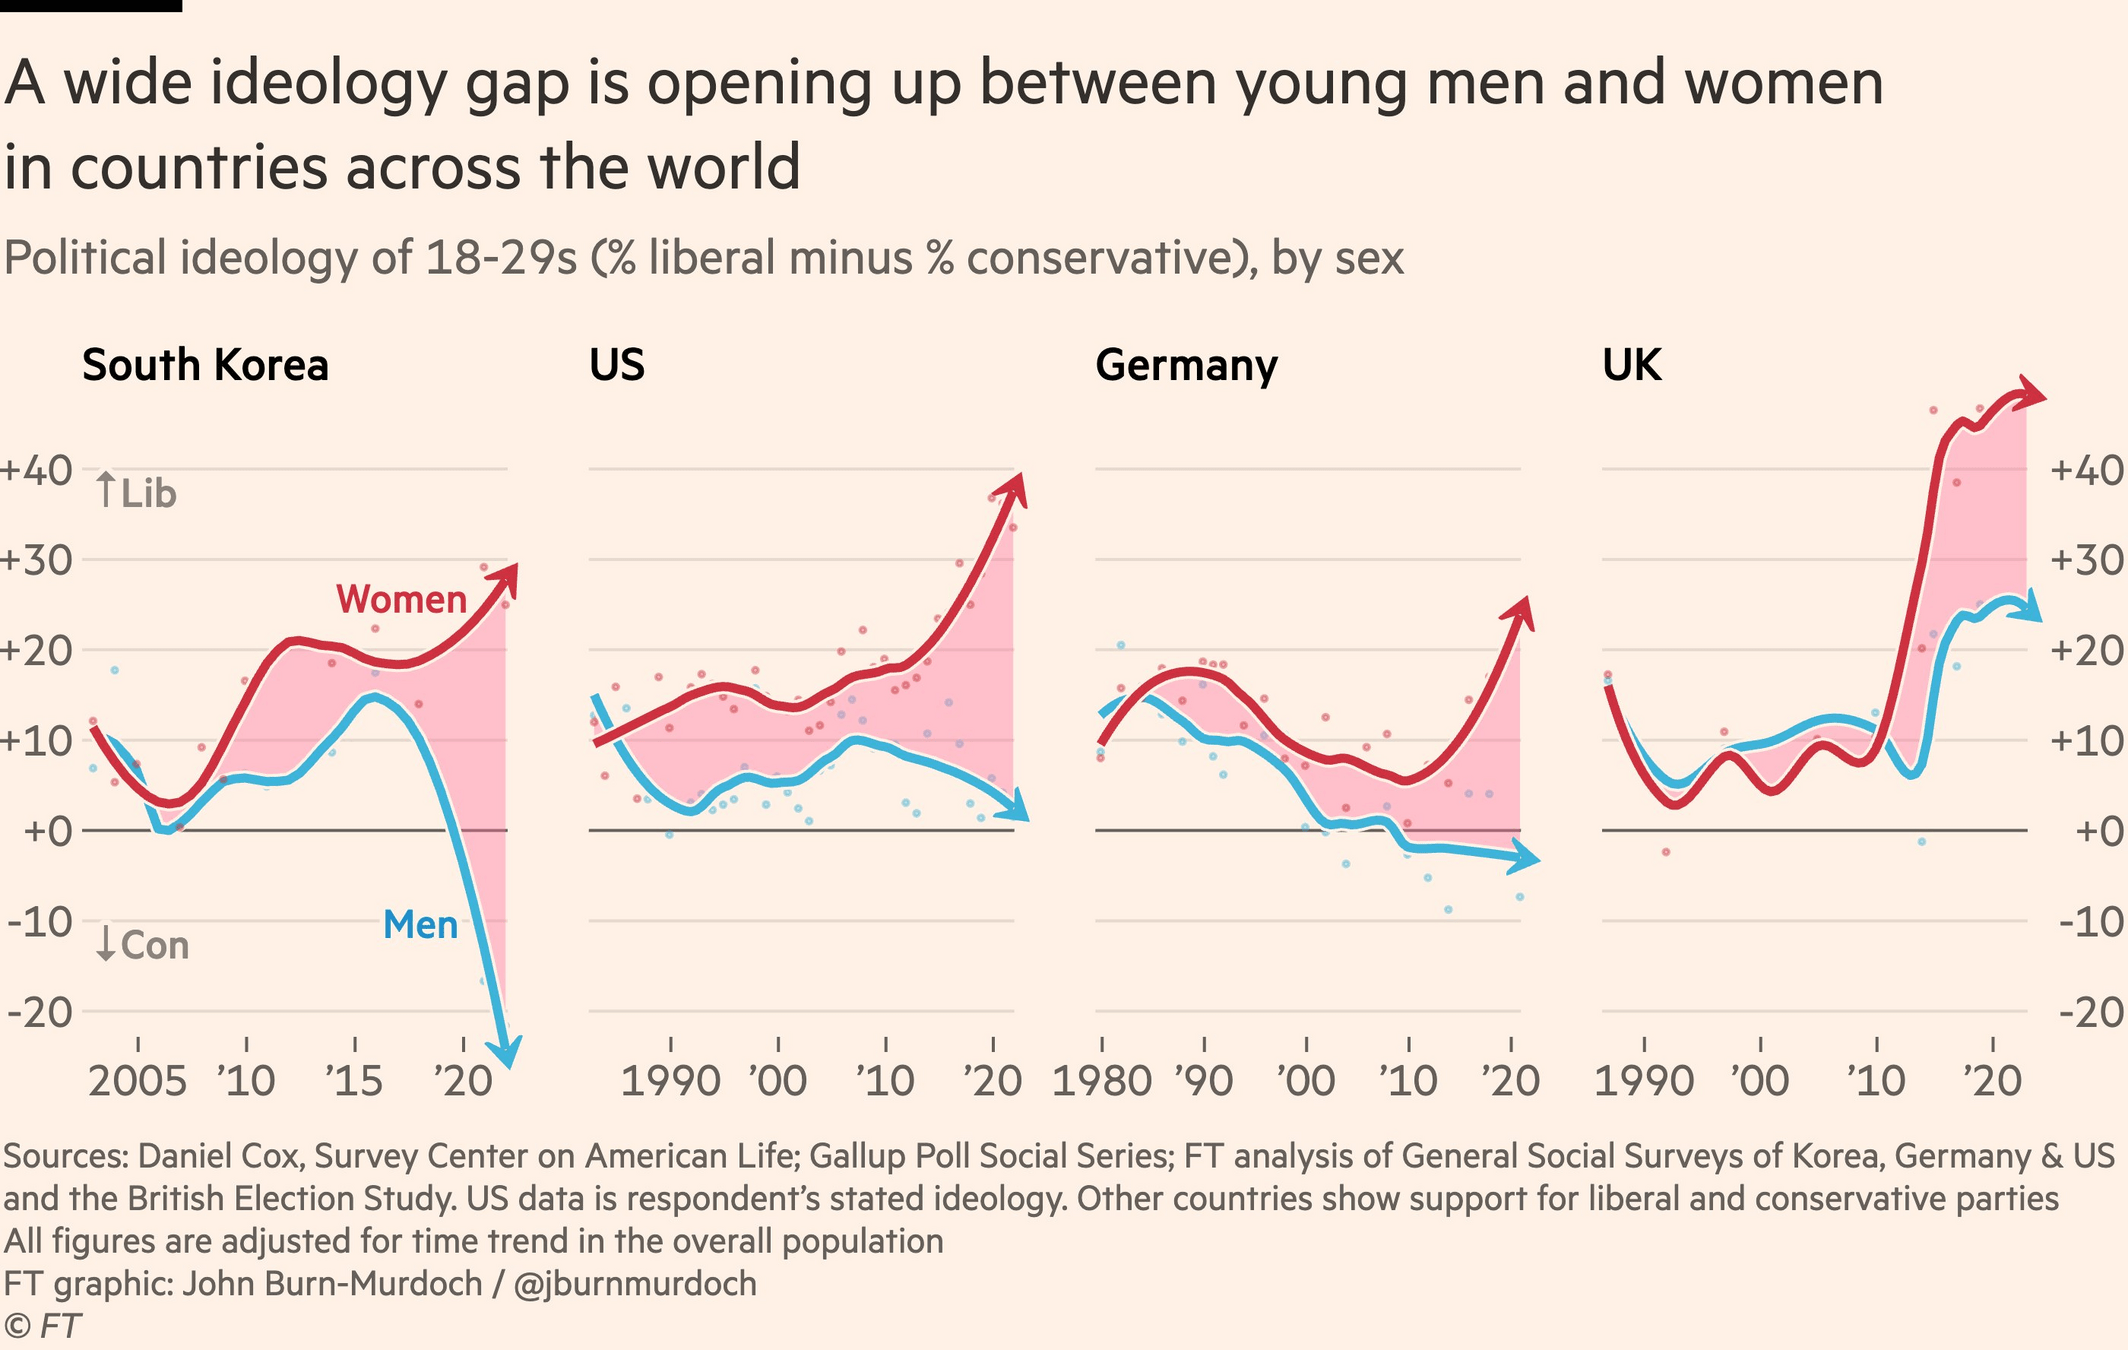
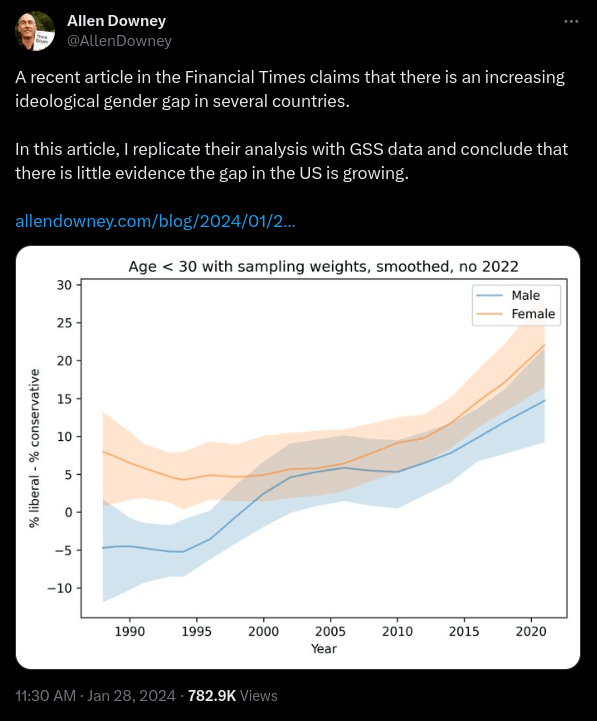
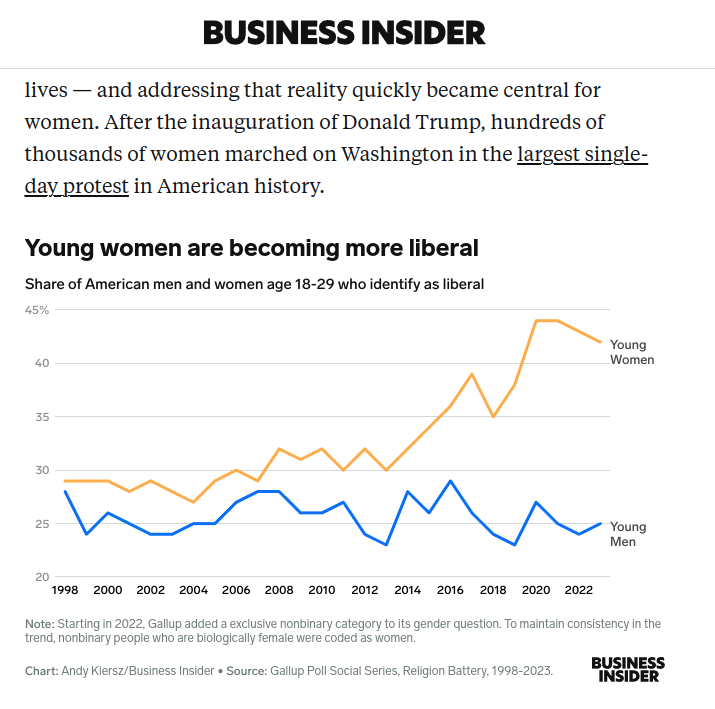
Can you find more recent data/plots?

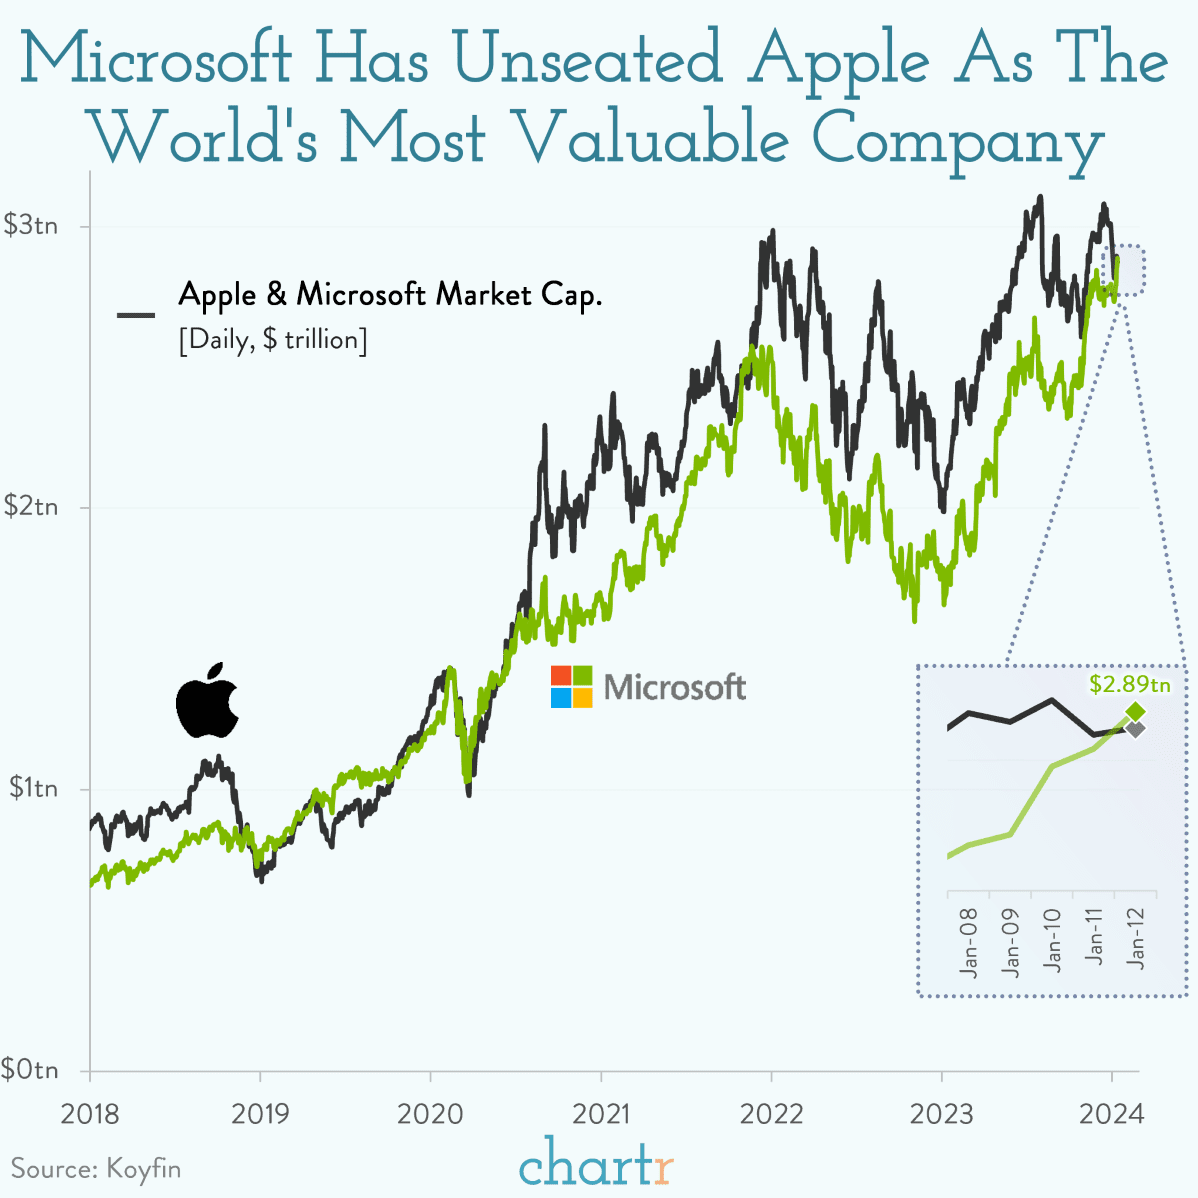
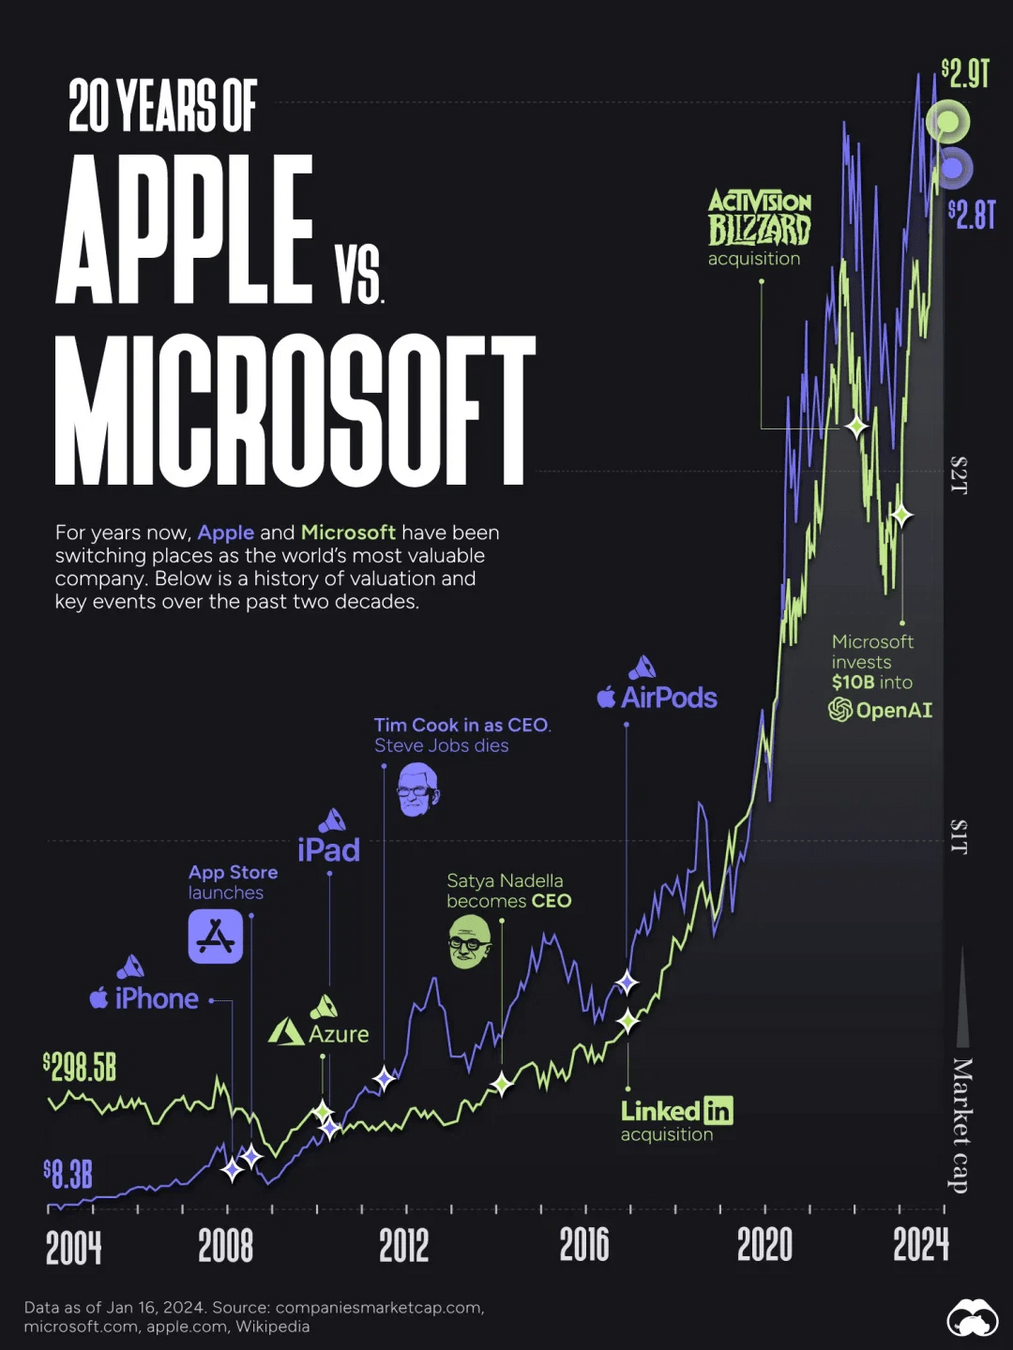
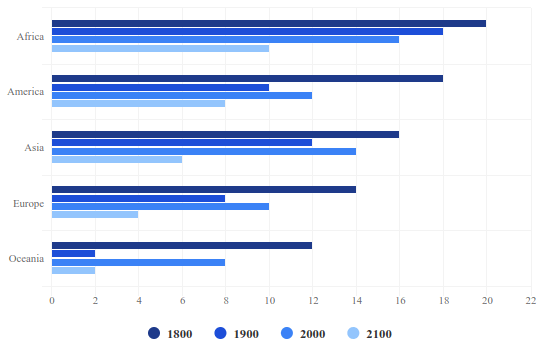
Which is better?
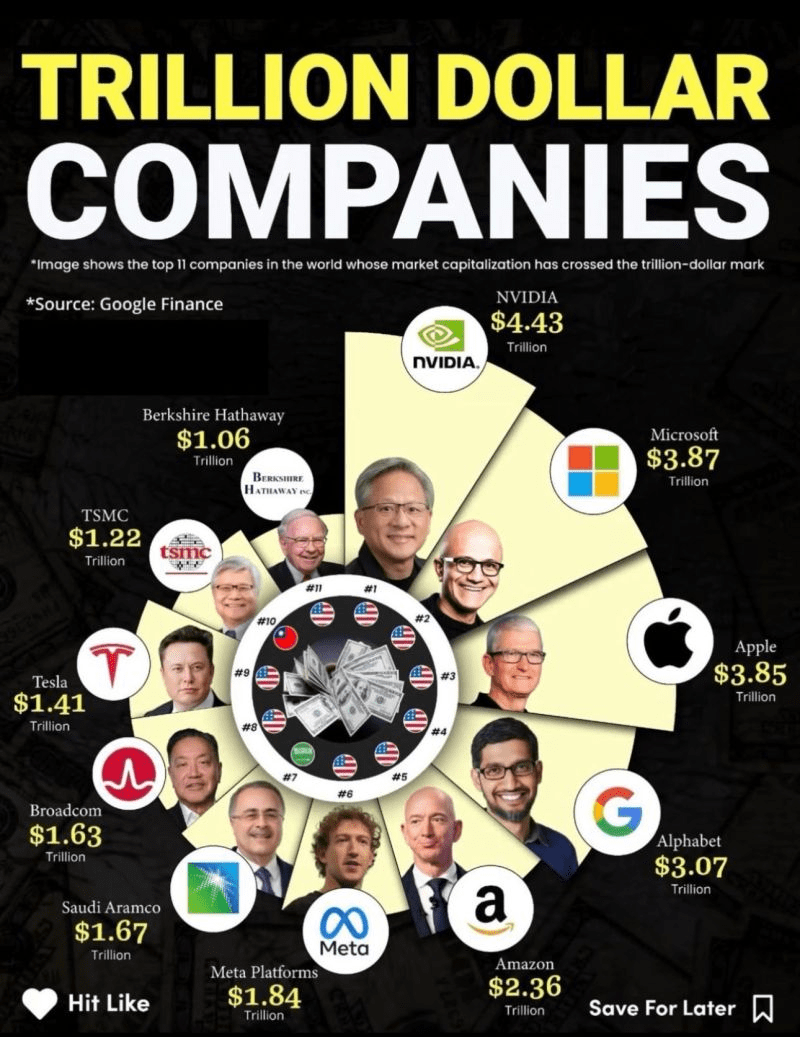
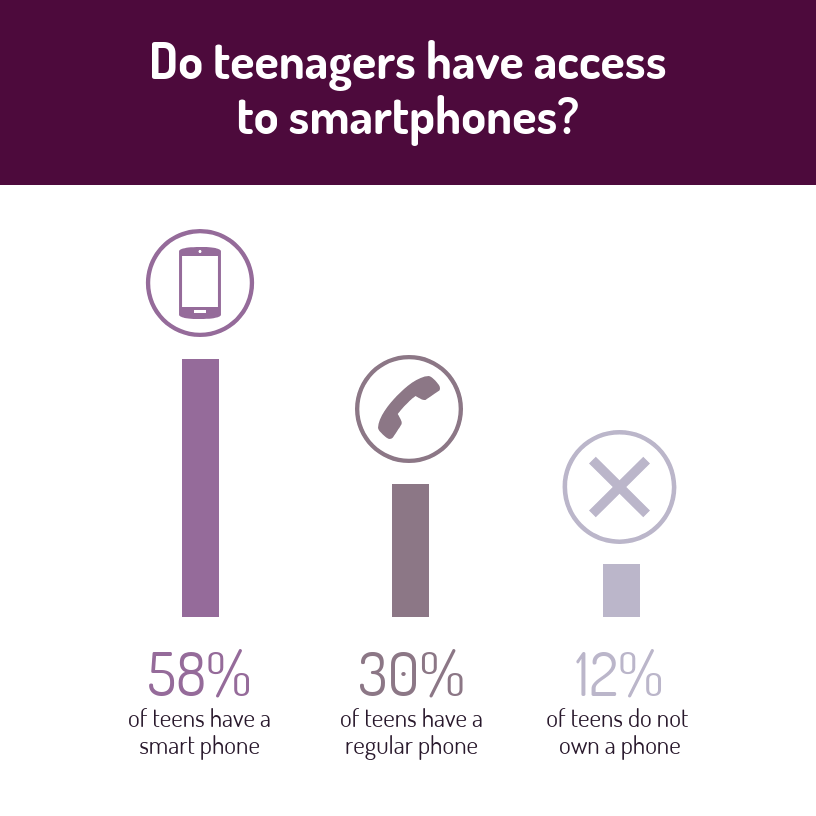
Infographic / Radial Bar Chart
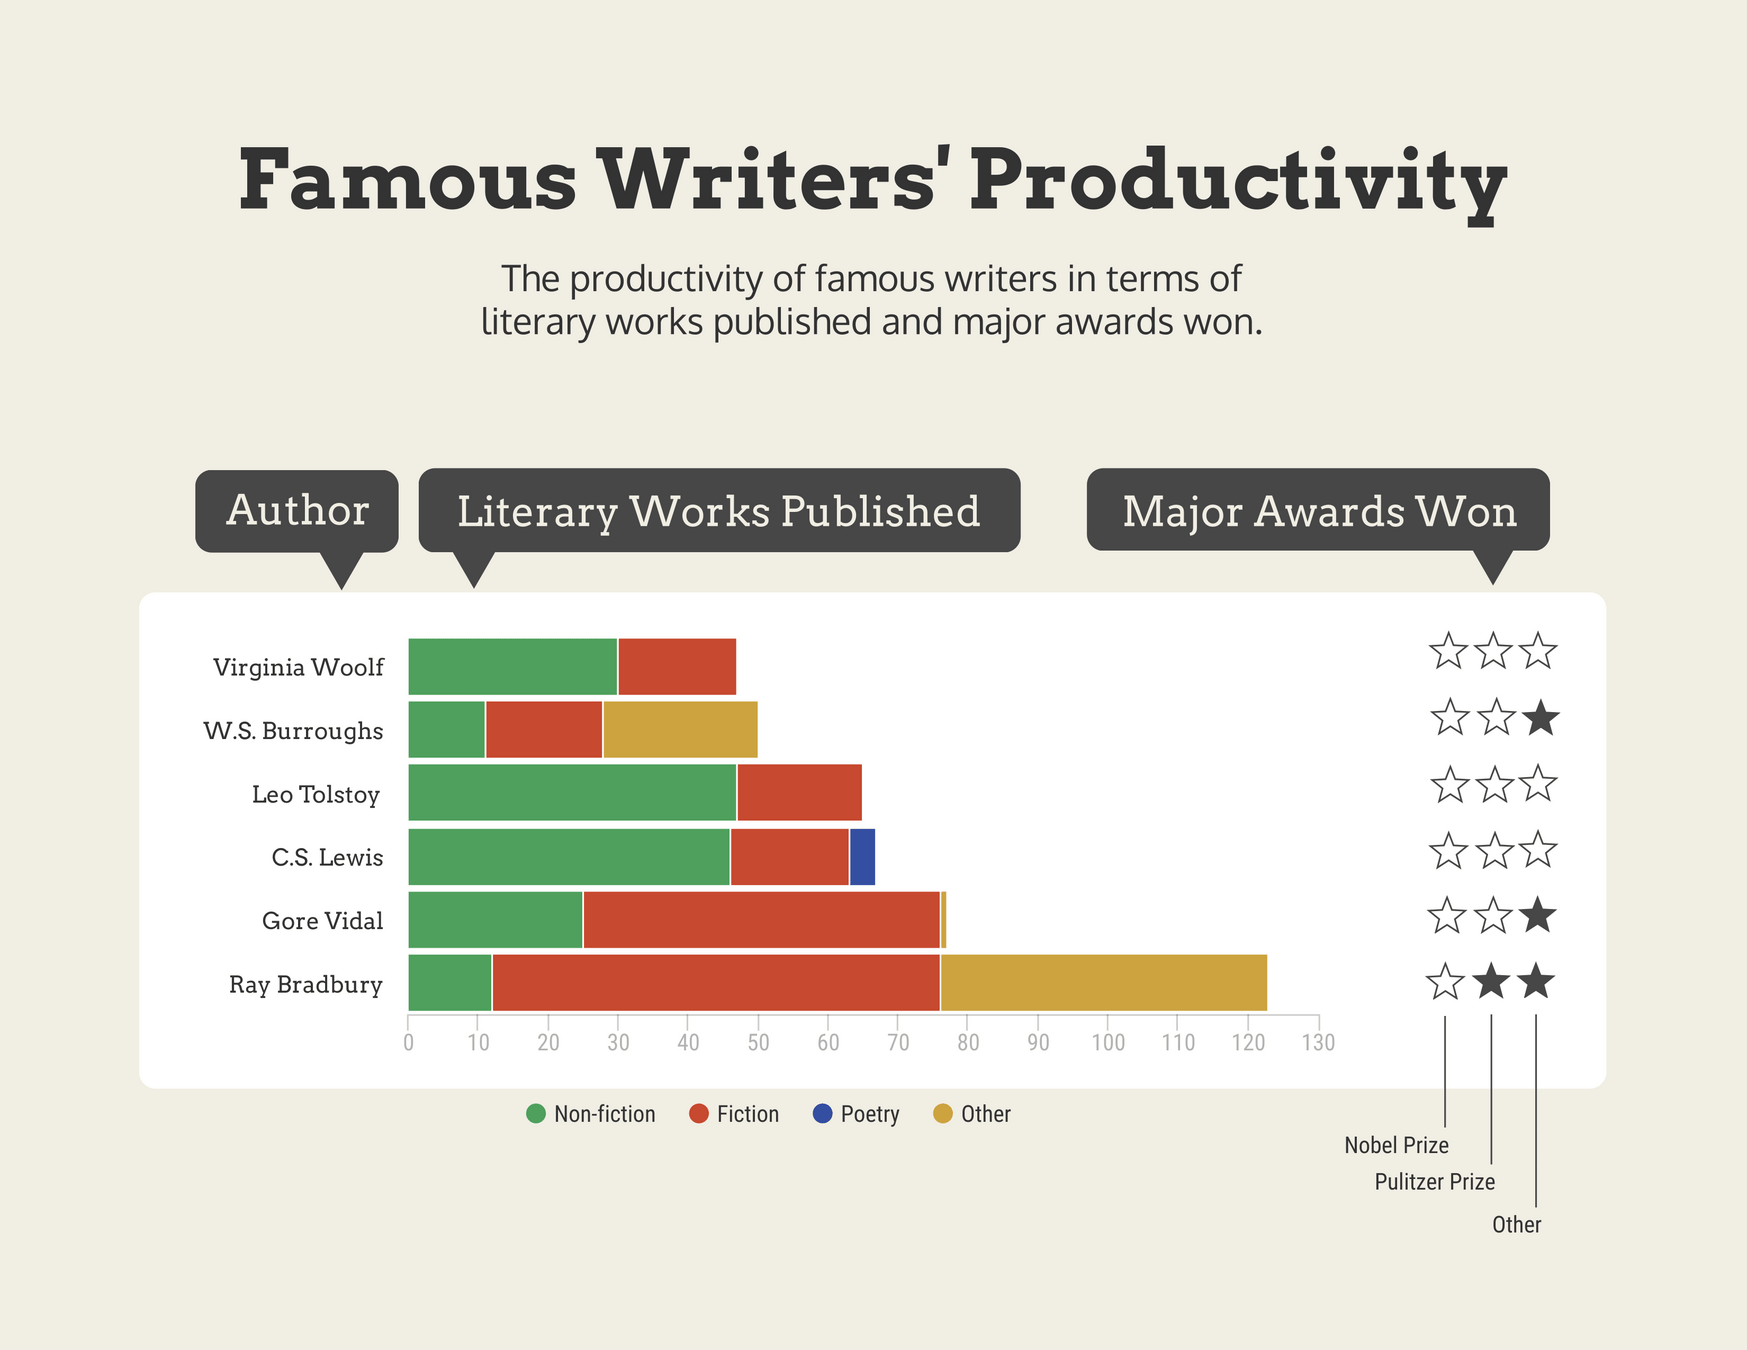
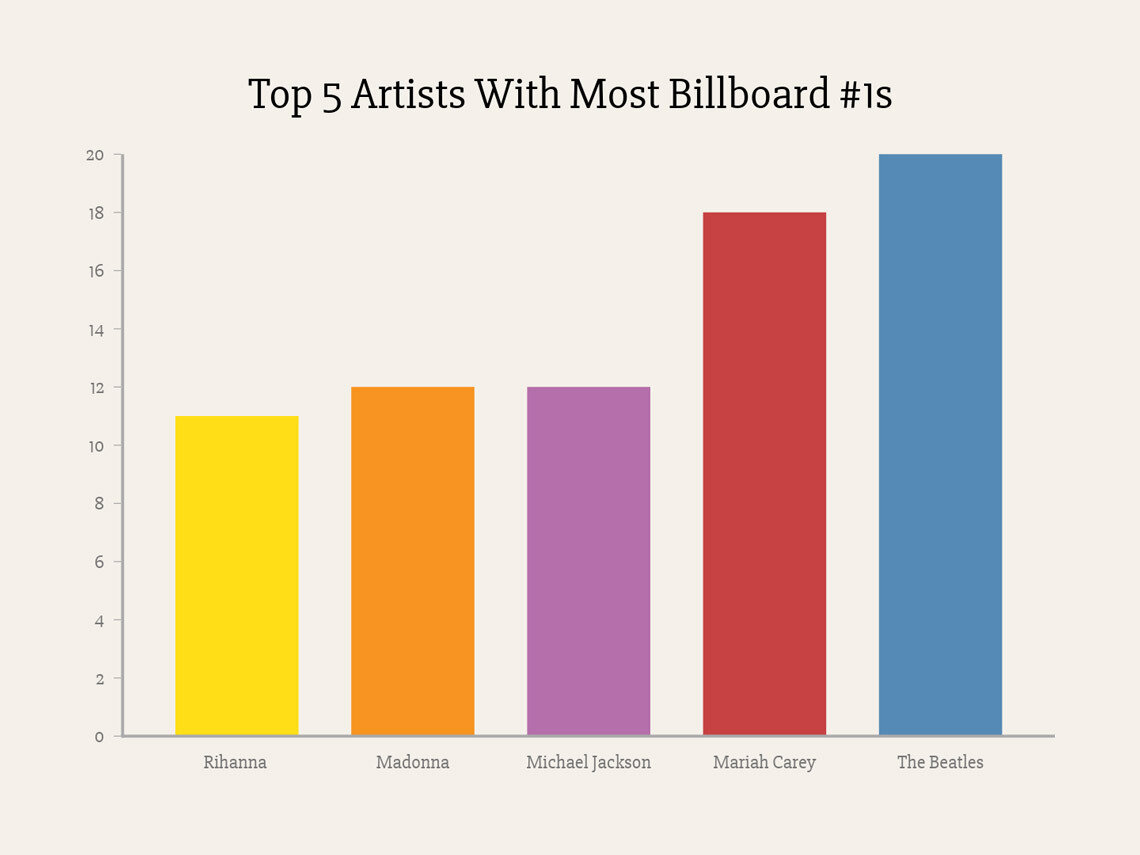
What type of chart is this?

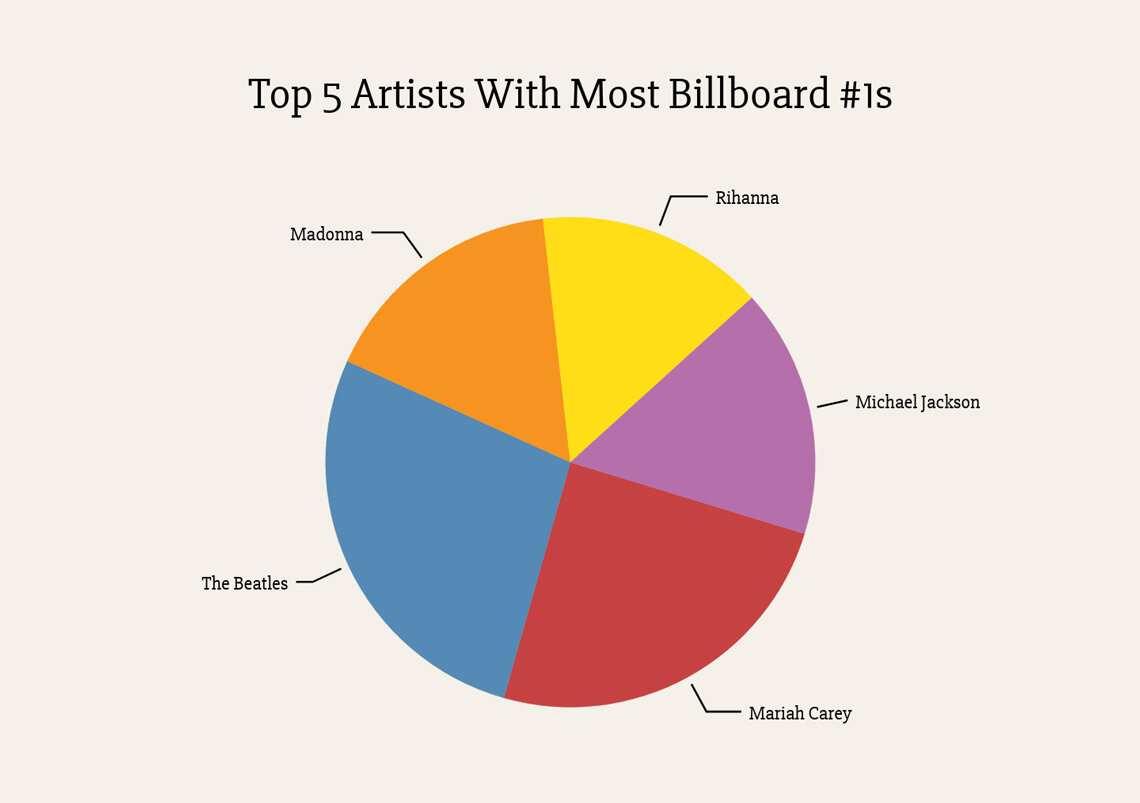
Who has the most #1s?
Who has the least?
My name is
Daniel Haehn

Ham
n
M / W
Class 2:30p - 3:45p
Office Hours 11:30a - 1:00p
M / W
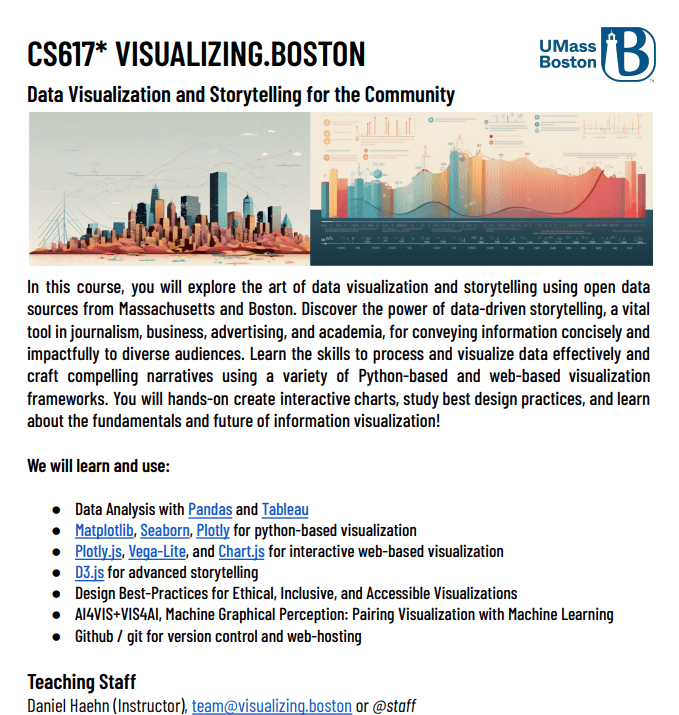
Teaching Staff
Avanith Kanamarlapudi
Edward Gaibor

Blake Moody


#introductions
Syllabus

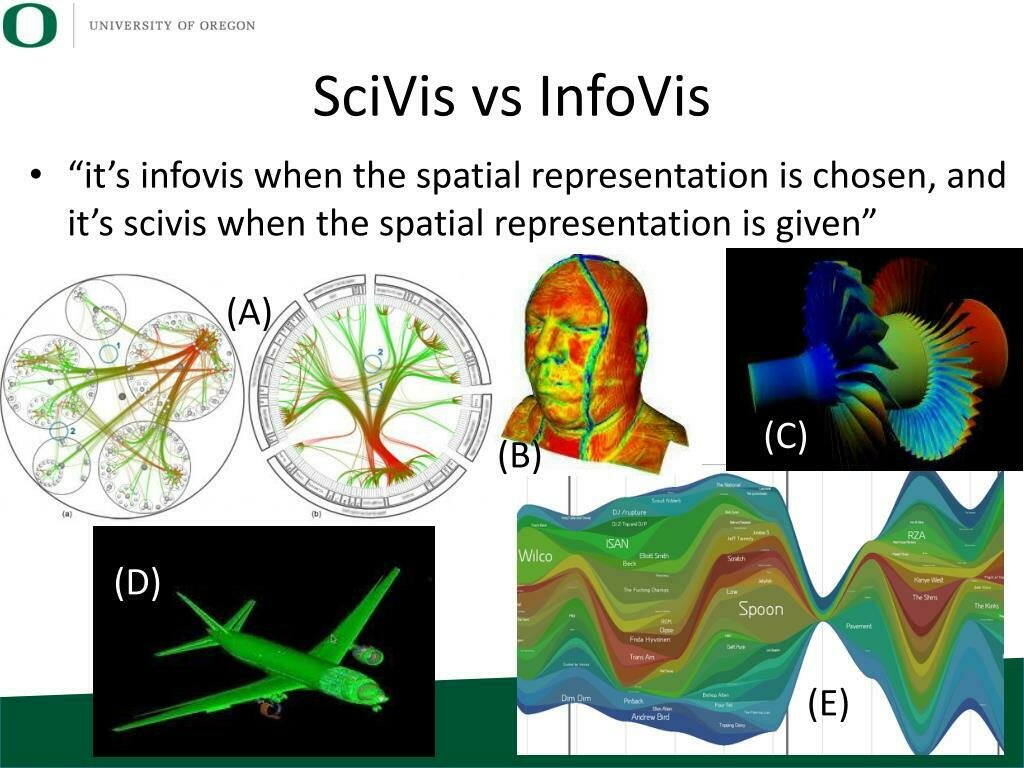
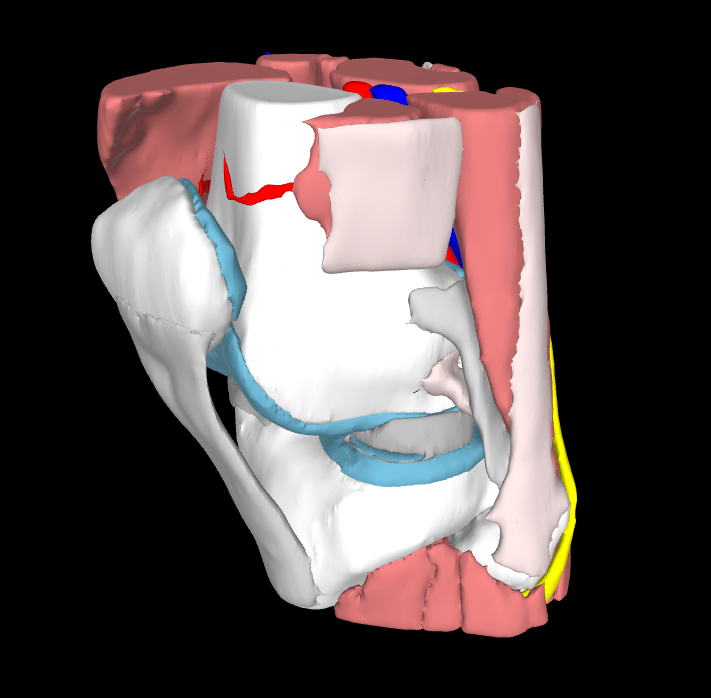
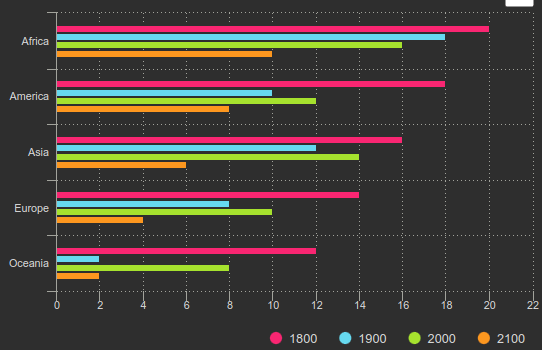
Scientific Visualization == black background
Information Visualization == white background
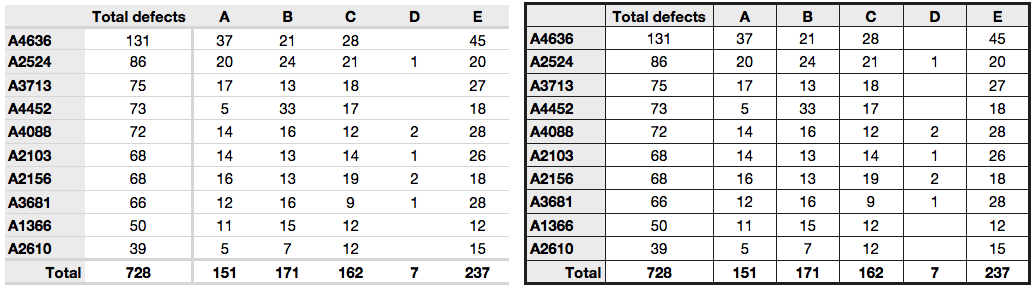
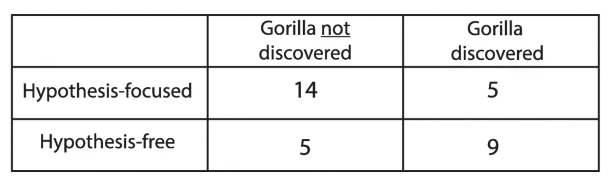
Tables are visualizations too!
this is one is better
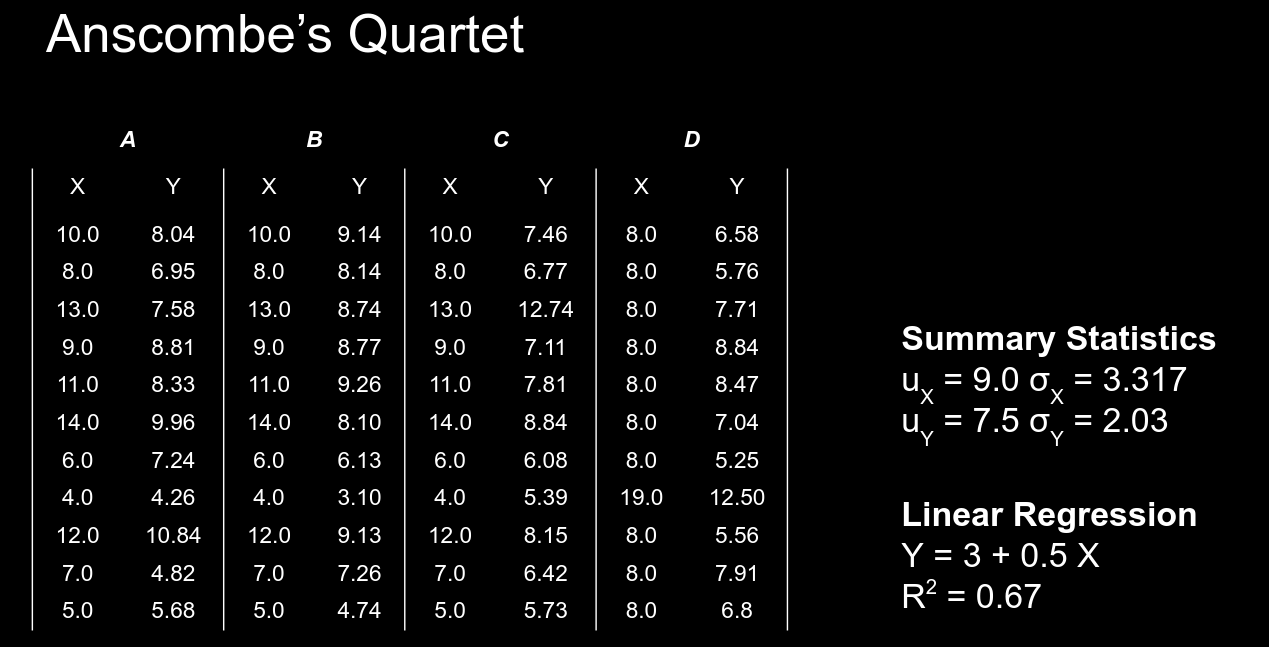
mean
stddev
whats this?
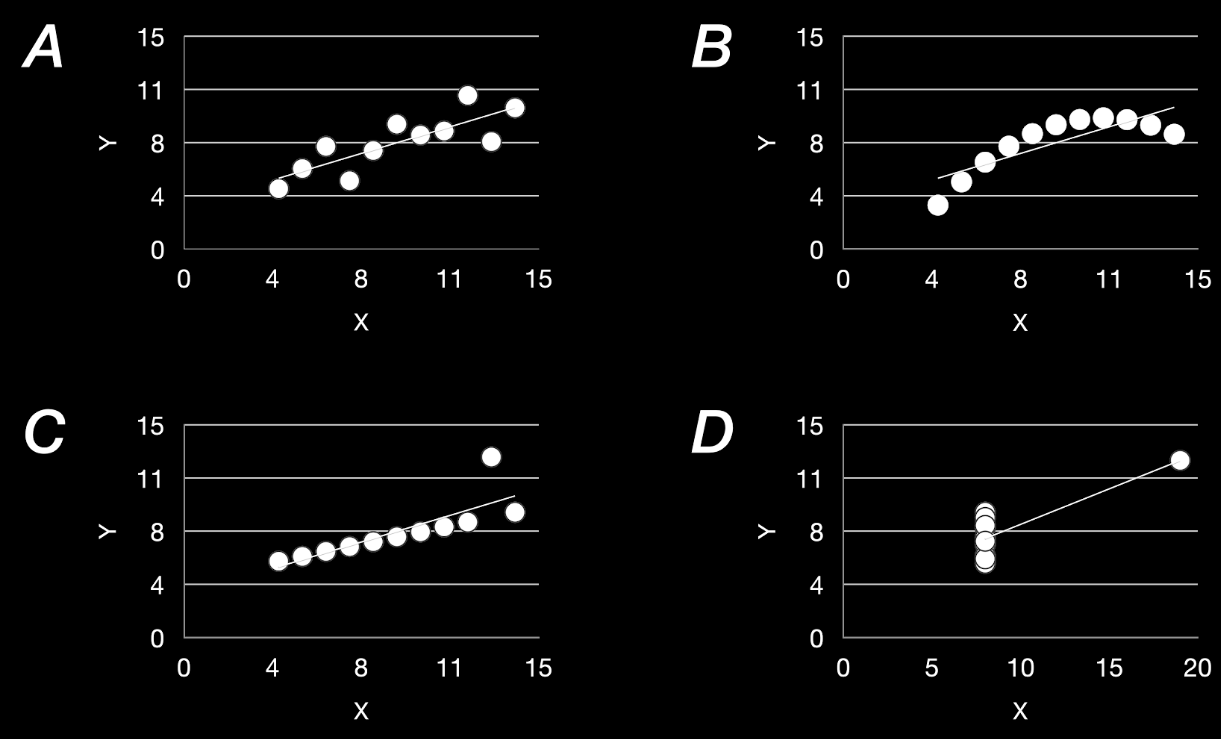

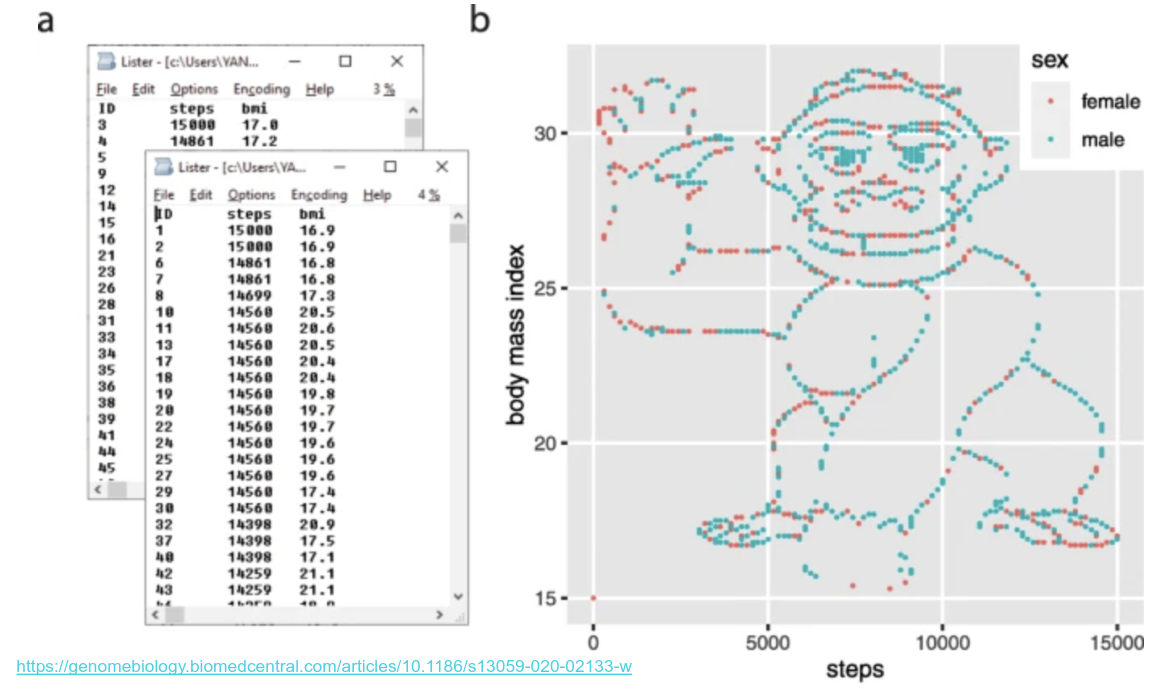
Visualizations should reduce the cognitive load when looking at data!

Exploratory
Explanatory
Data Analysis
understand the data
commmunicate to audience
how and why?
what happened?
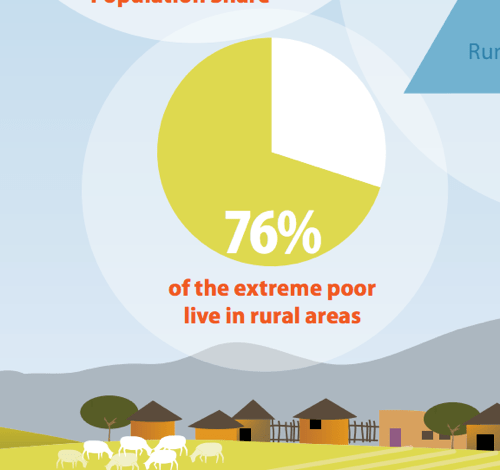
What's wrong with this chart?
Source: World Bank

1. Create a folder YOUR_NAME
2. Upload cool (or bad!) visualizations that you find
At the beginning of every class we will randomly select a student to showcase one of their visualizations and we will discuss as a group!

if you get selected!
Homework

Which technologies are used by FT and BI?
