Welcome back!


Due Today!


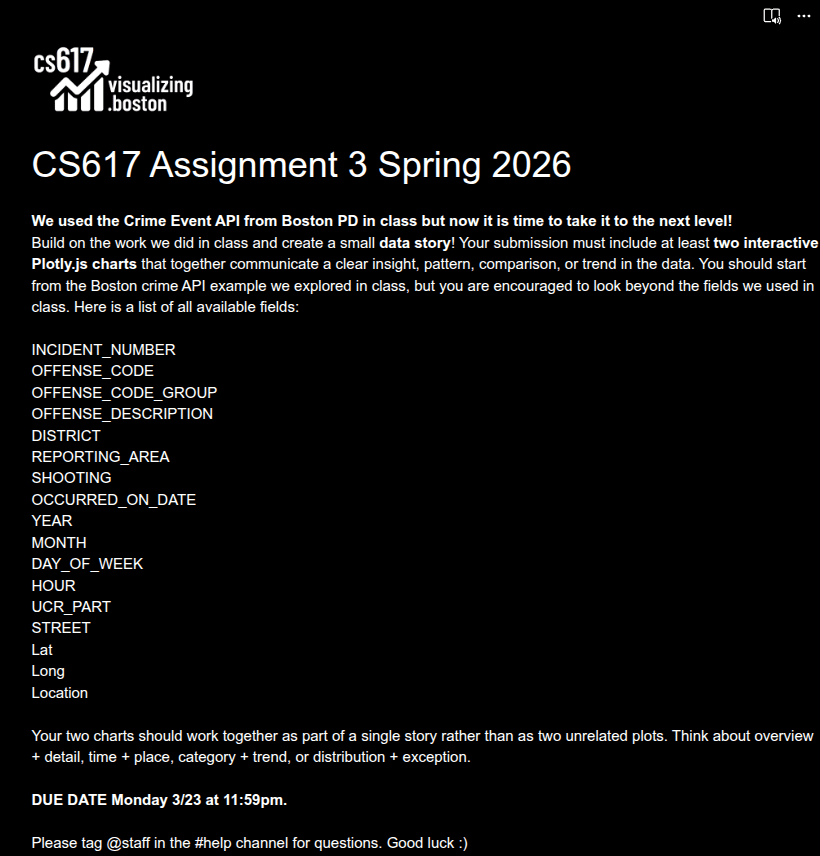
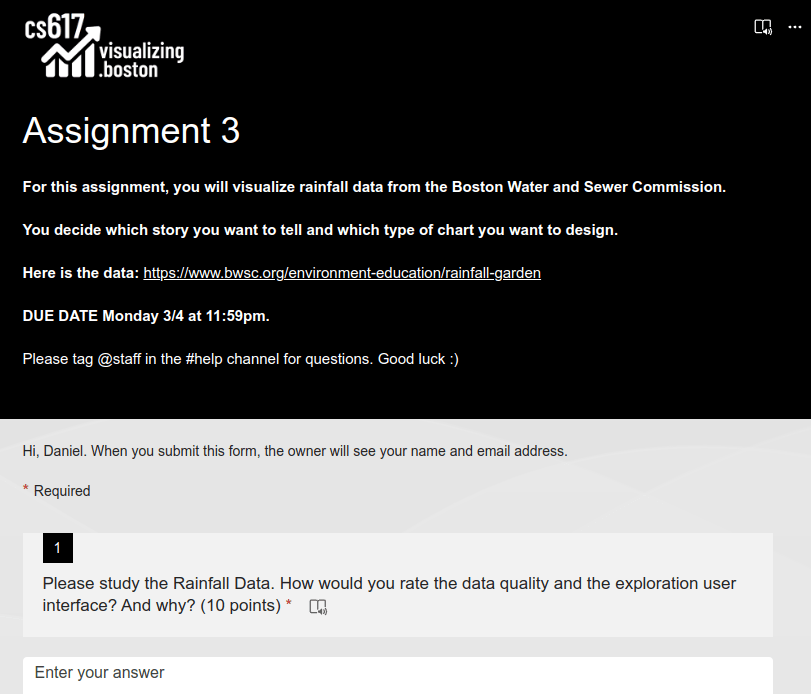
Homework


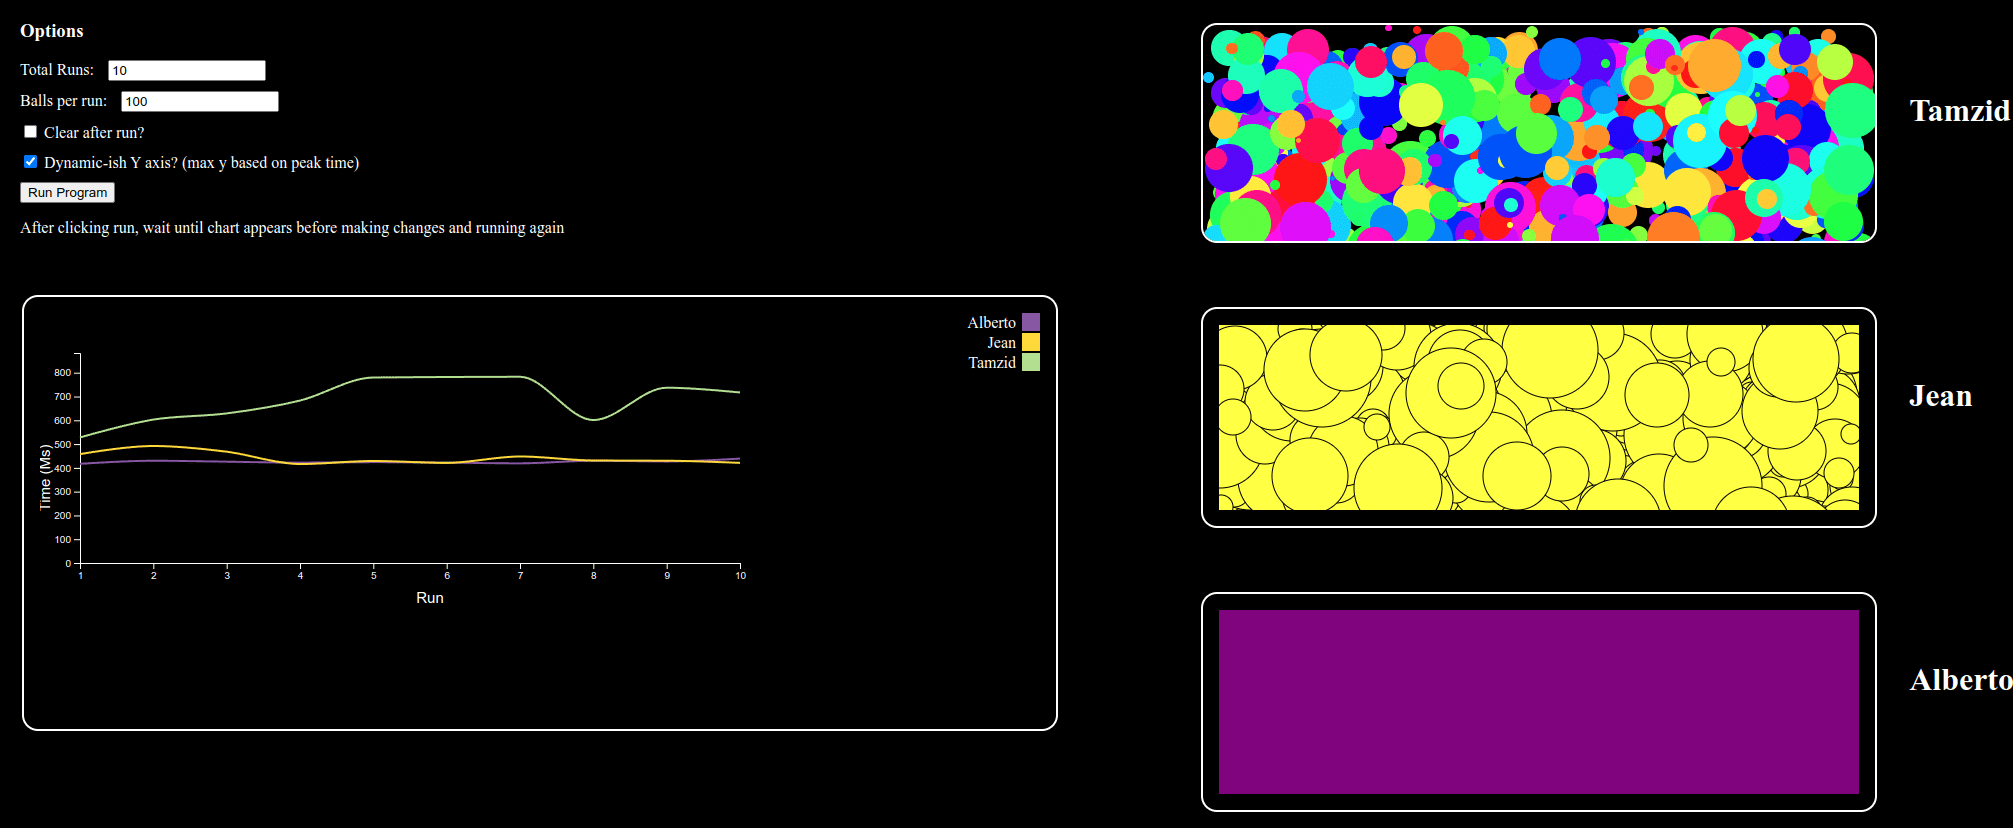
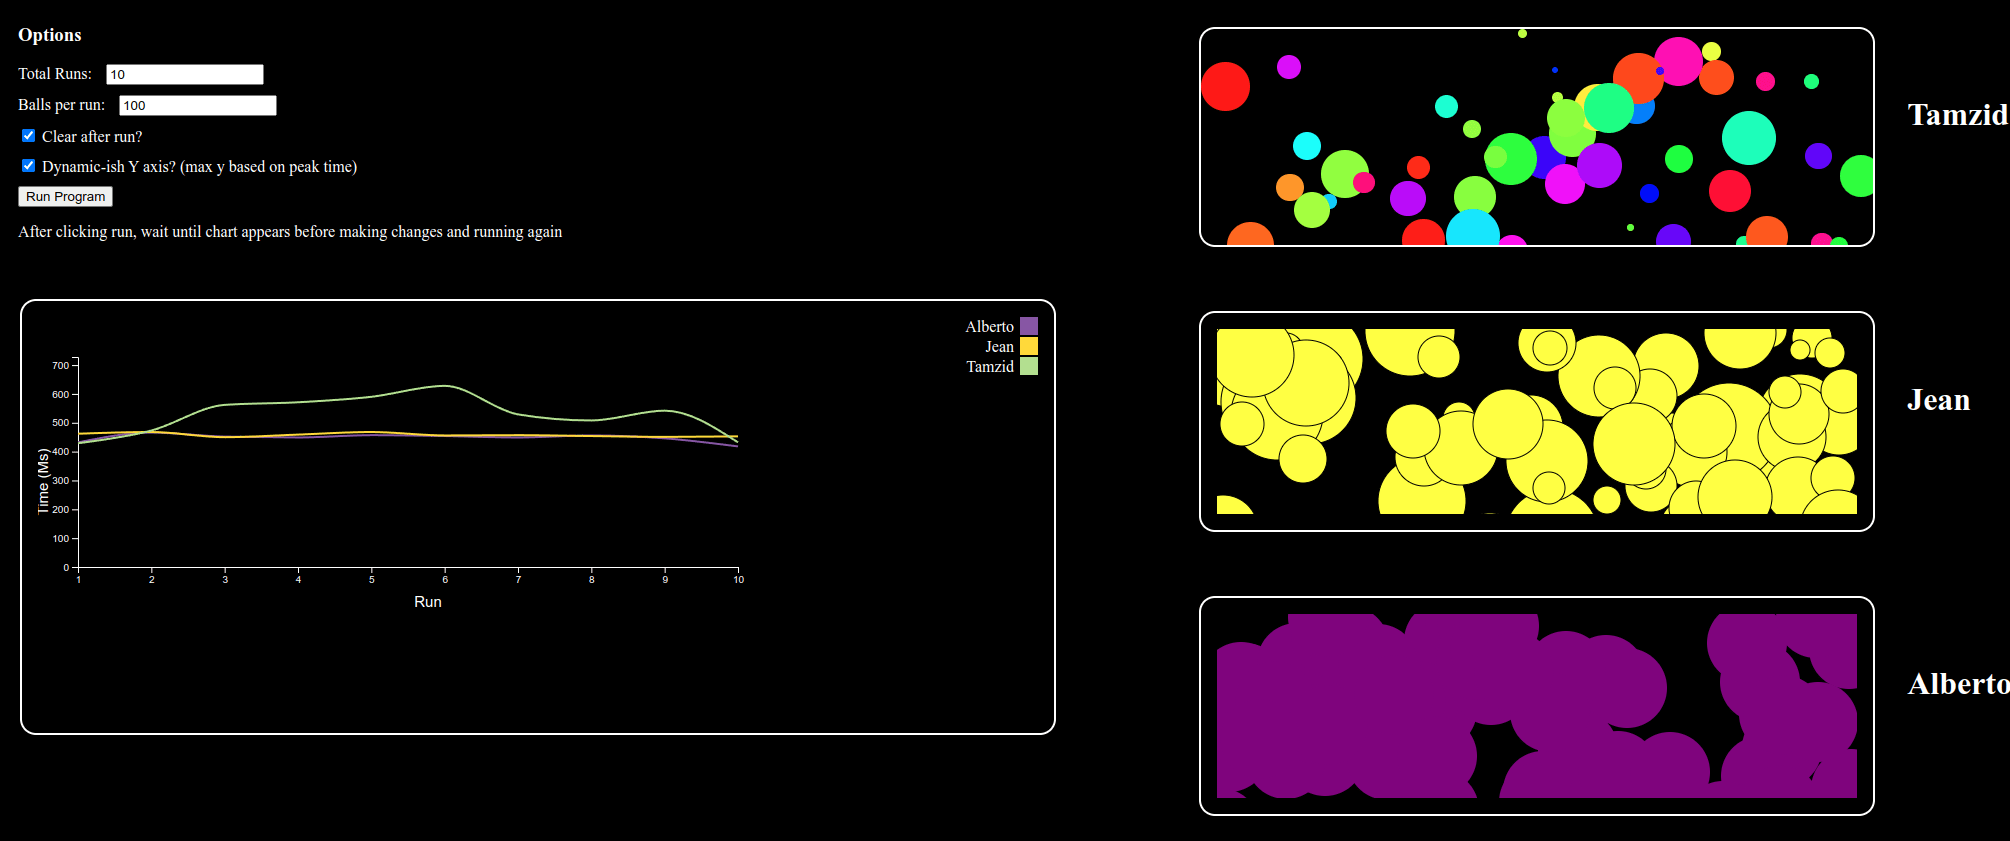
Create a new circle every second until 100 randomly positioned circles are on the screen with D3!

???
Homework

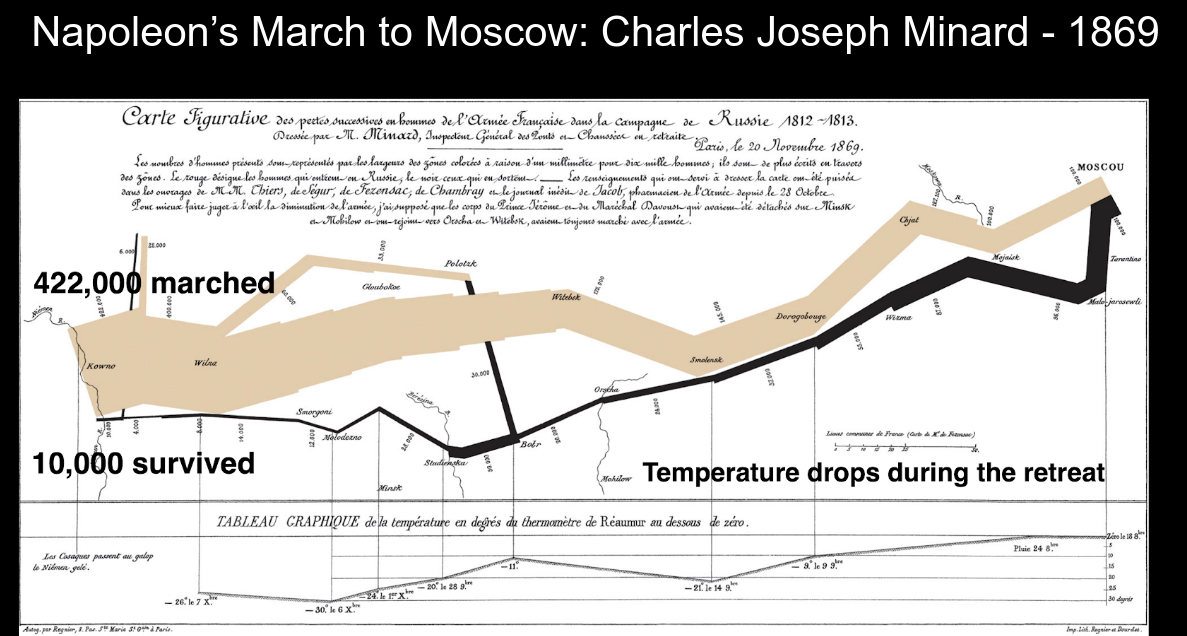
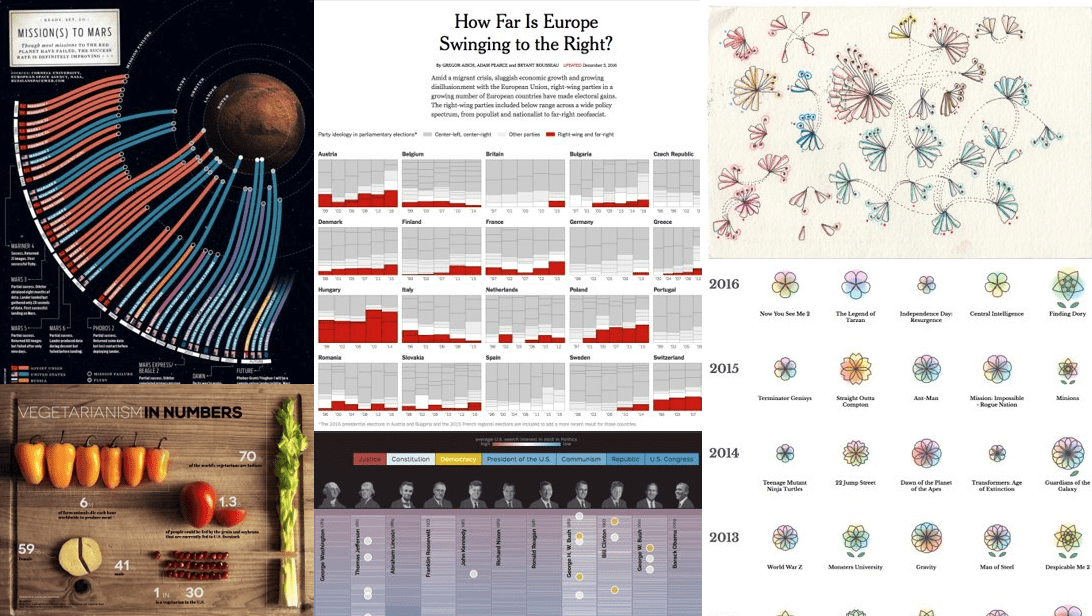
Sankey Diagram
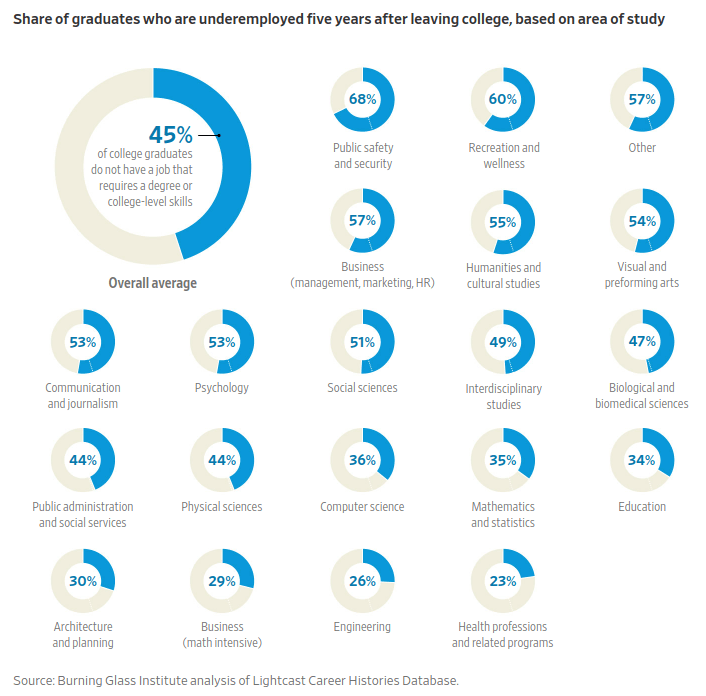
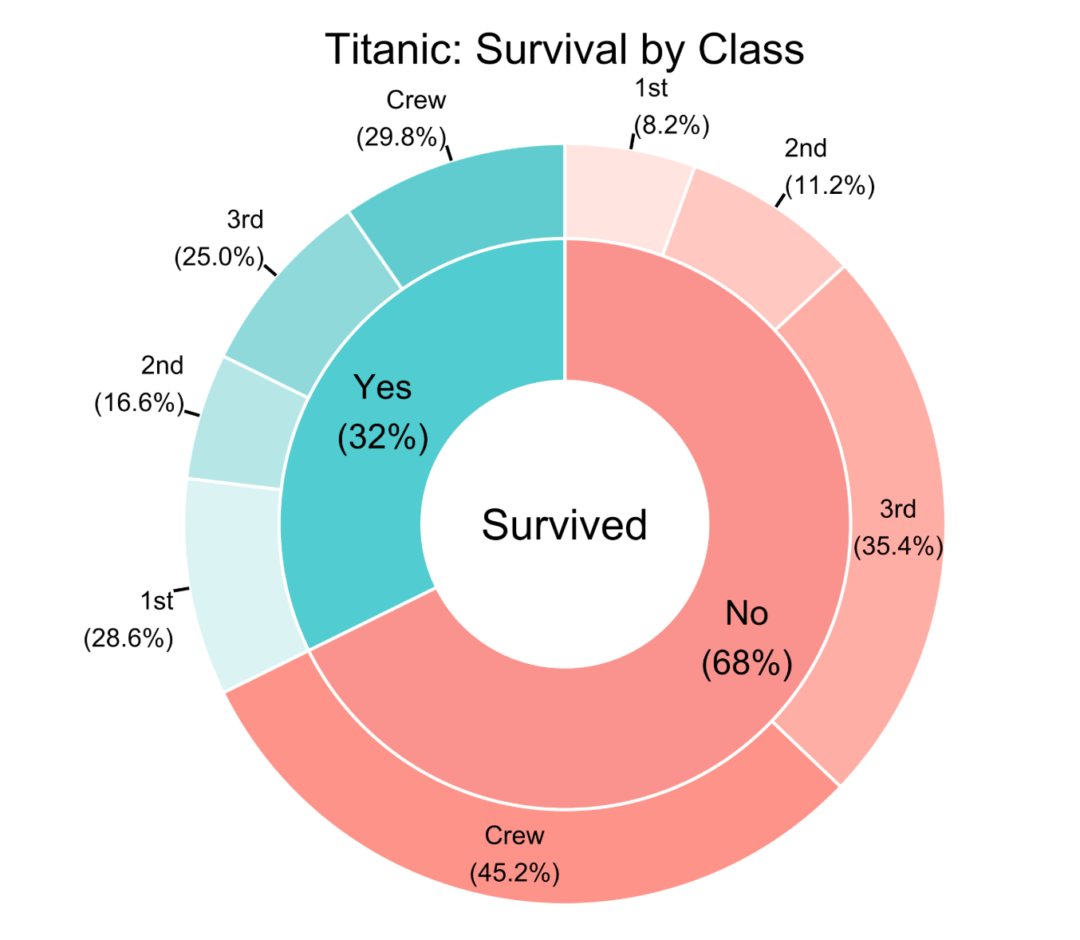
Donut Chart
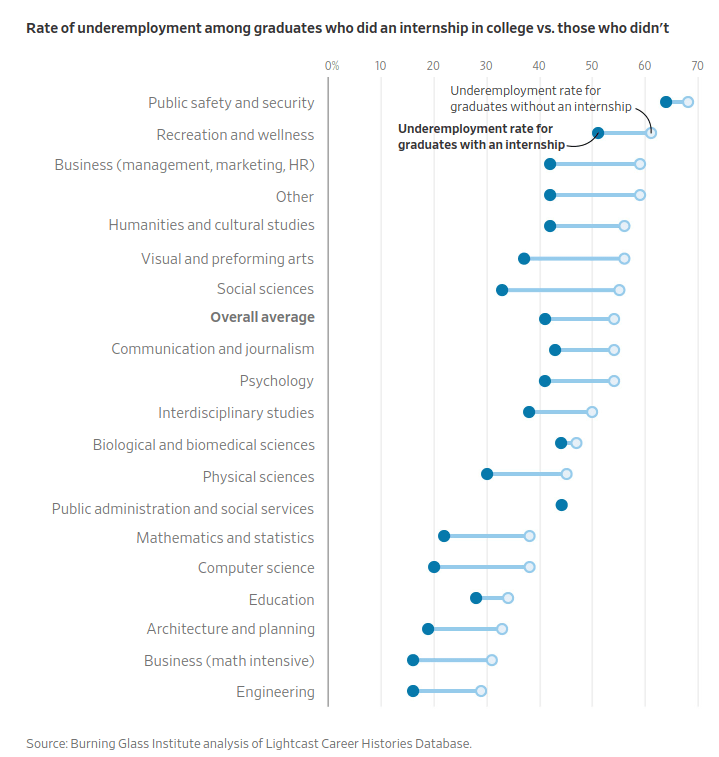
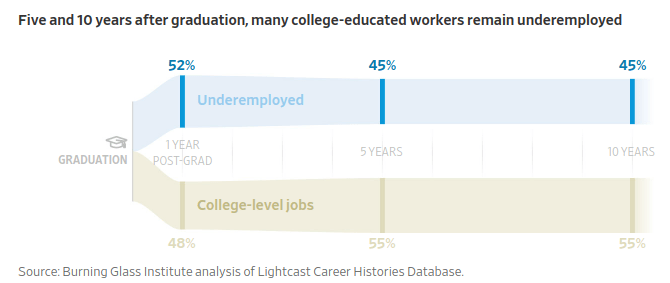
Dumbell Plot

Connected Dot Plot
Ranged Dot Plot
Horizontal Range
Min-Max Plot
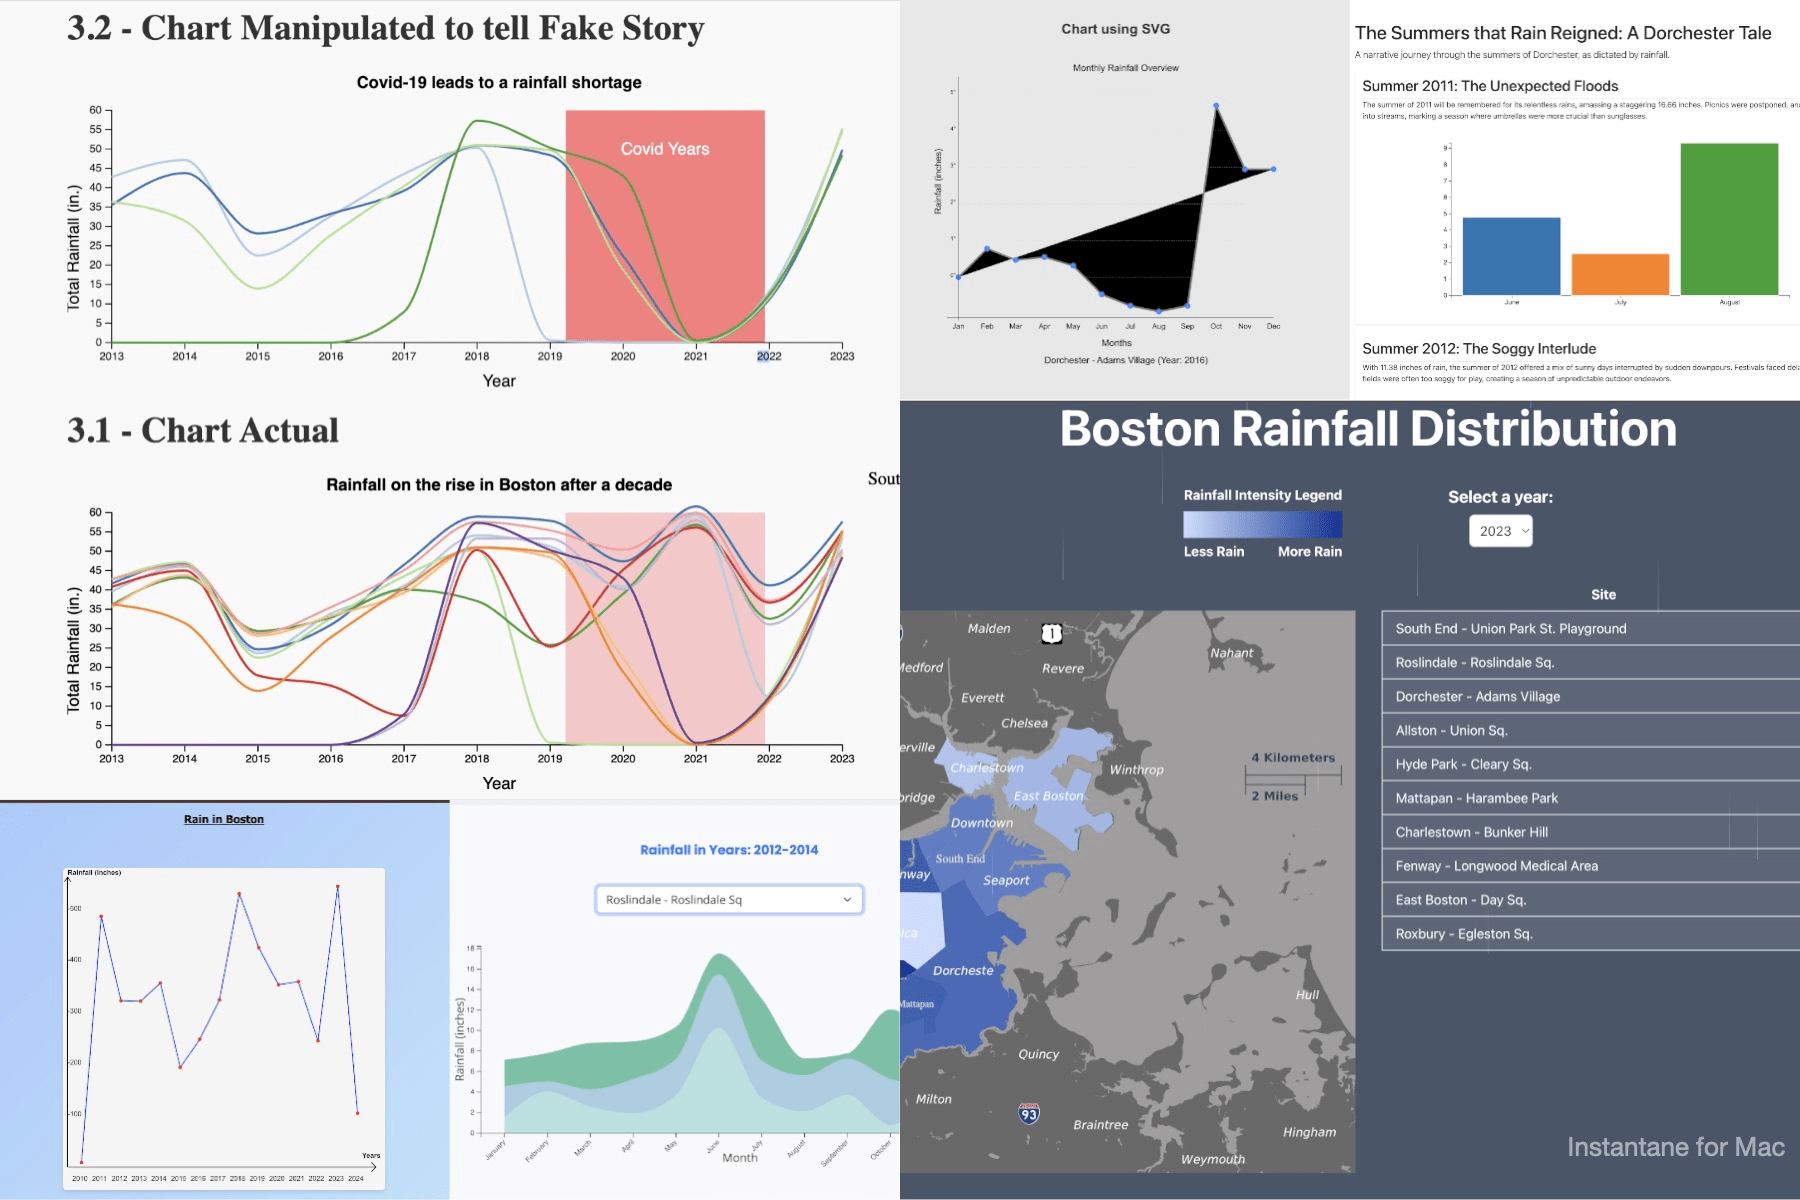
Homework
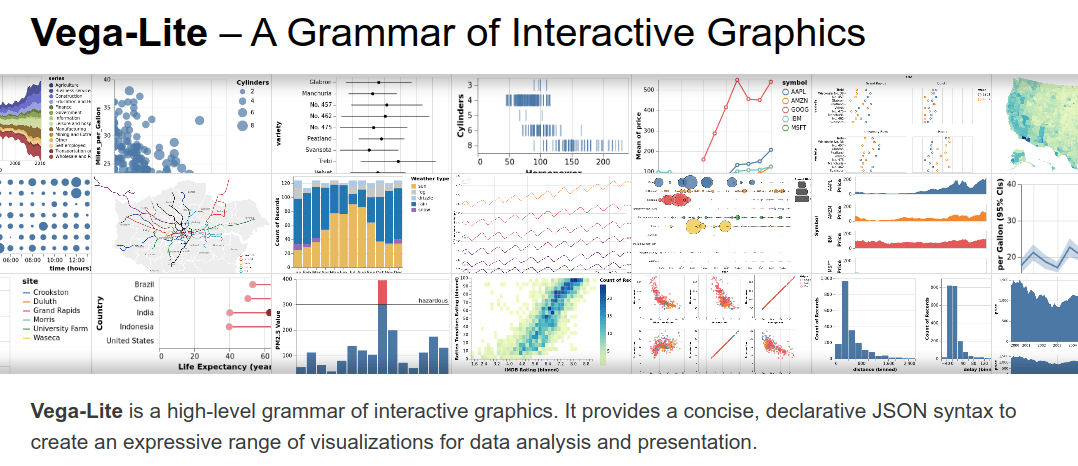
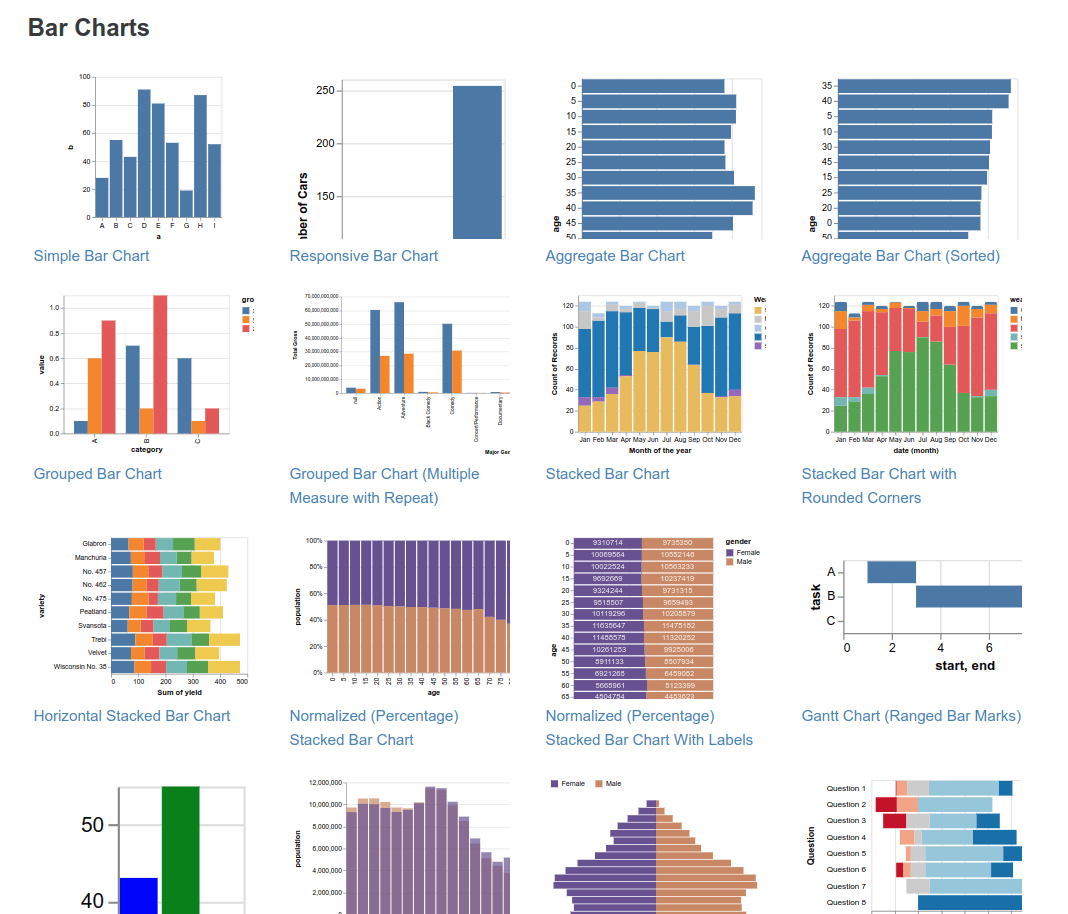
Re-Create your assignment 3 submission with Vega-Lite!


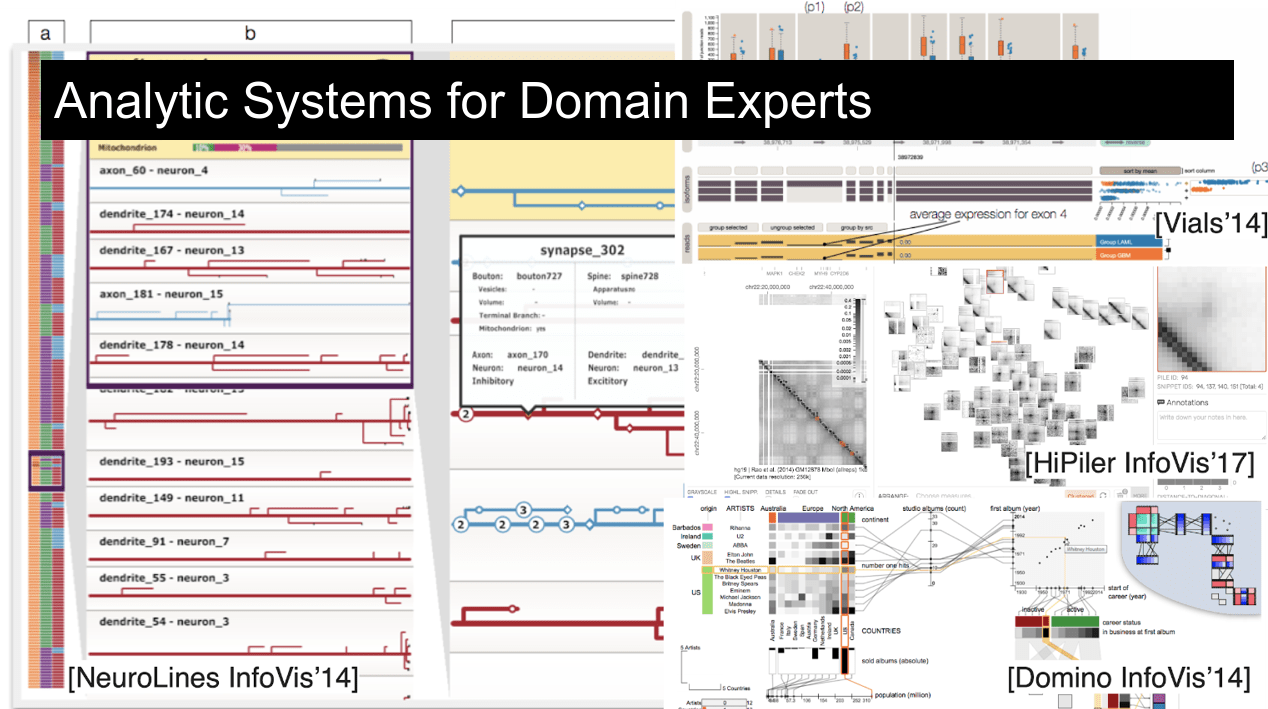
Fritz Lekschas

Last time via Zoom!
Fritz Lekschas
Thank you!!

Homework
Re-Create your assignment 3 submission with Vega-Lite!


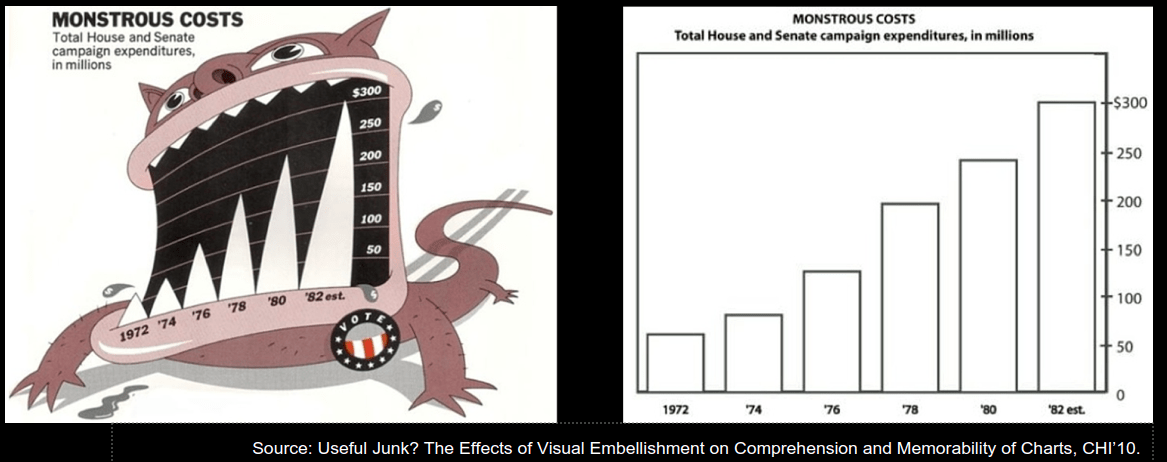
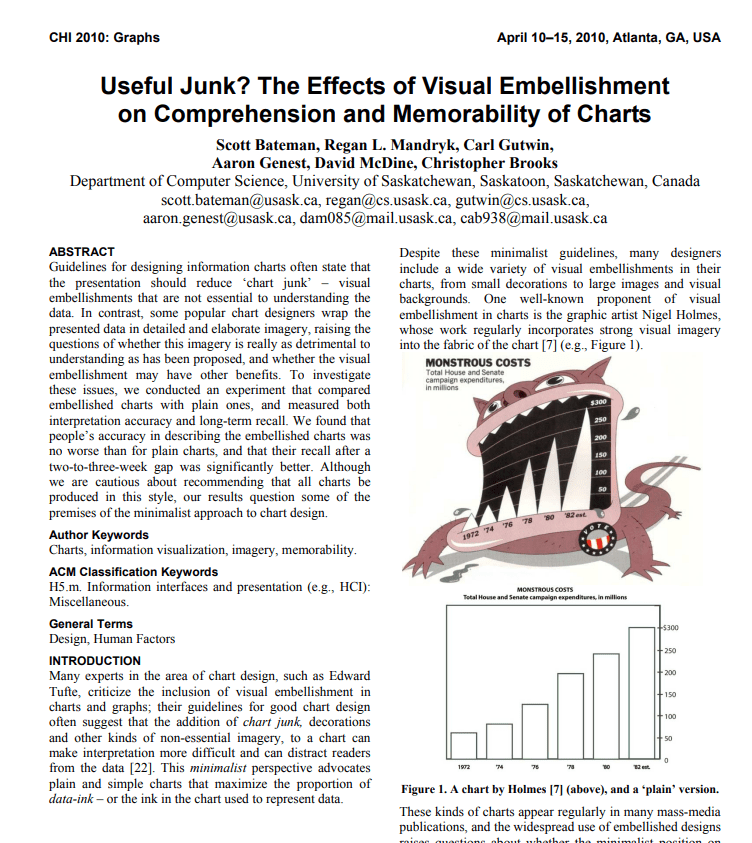
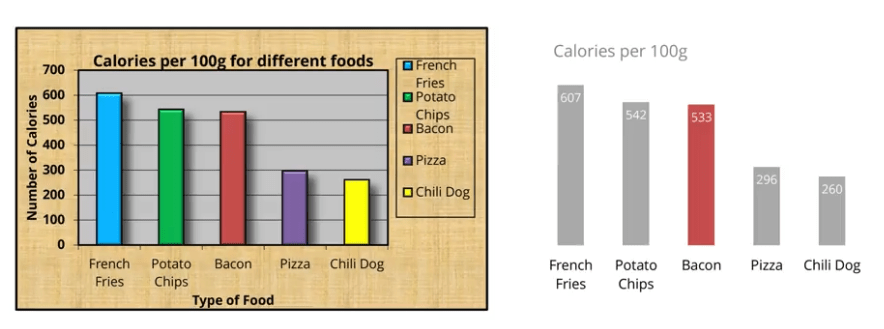
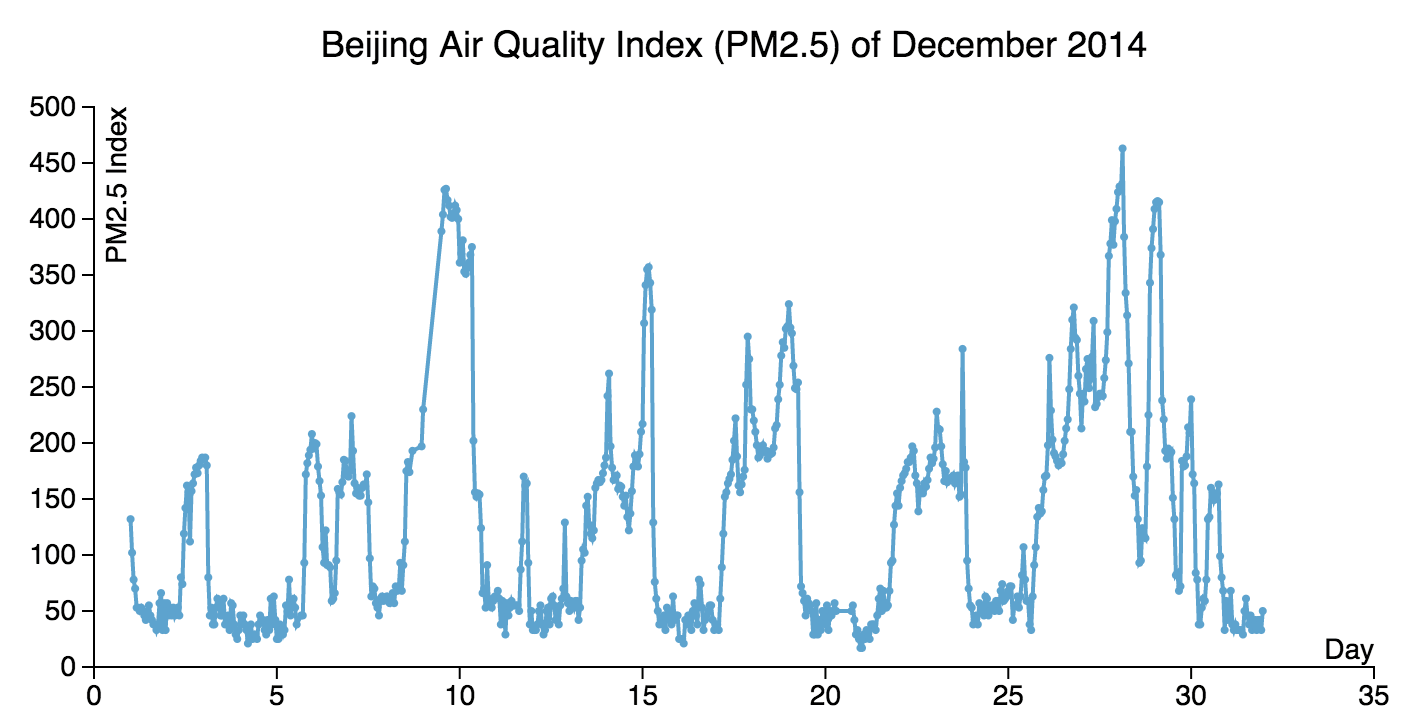
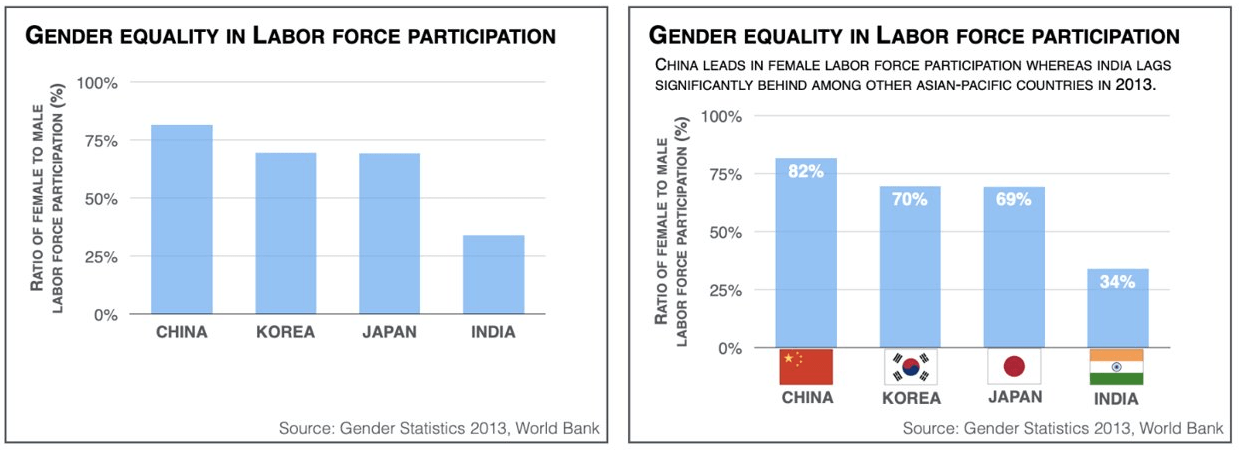
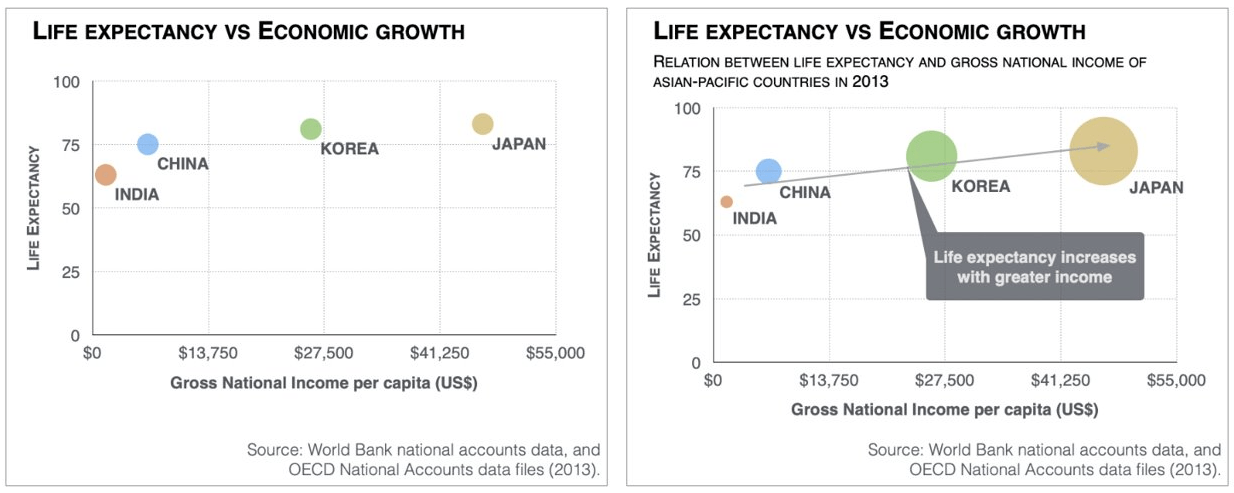
Tufte: Data-Ink Ratio
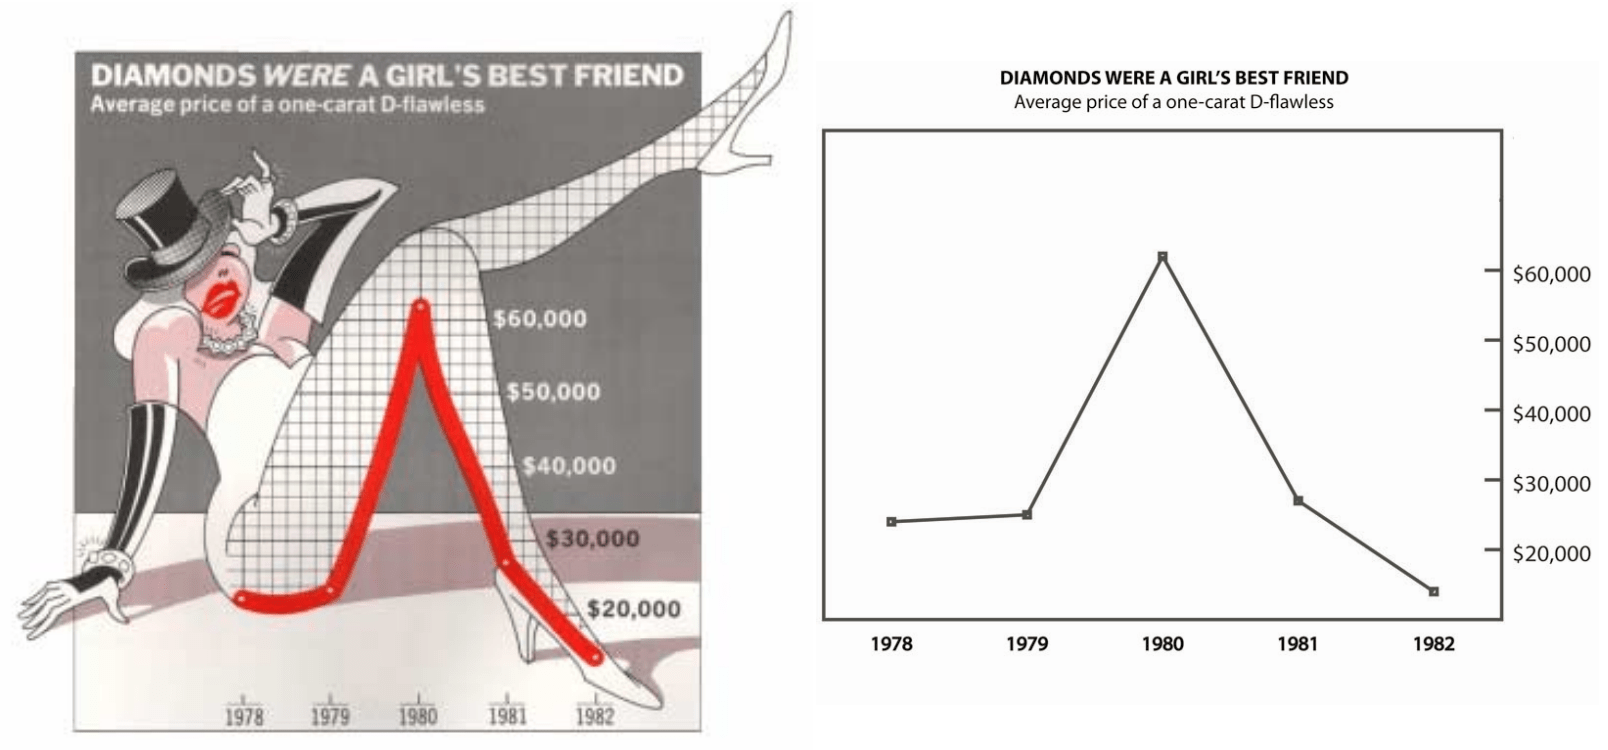

Tufte: Data-Ink Ratio
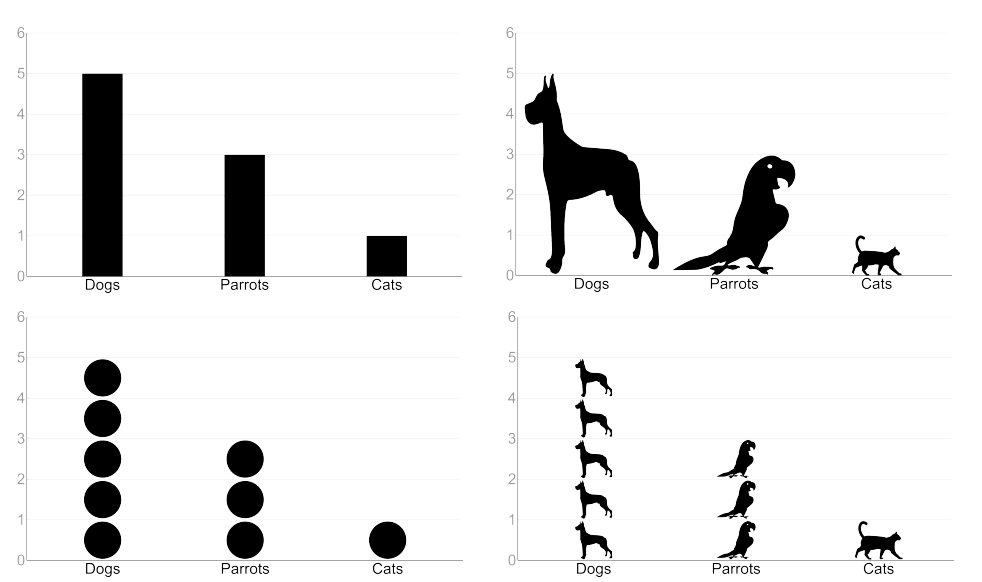
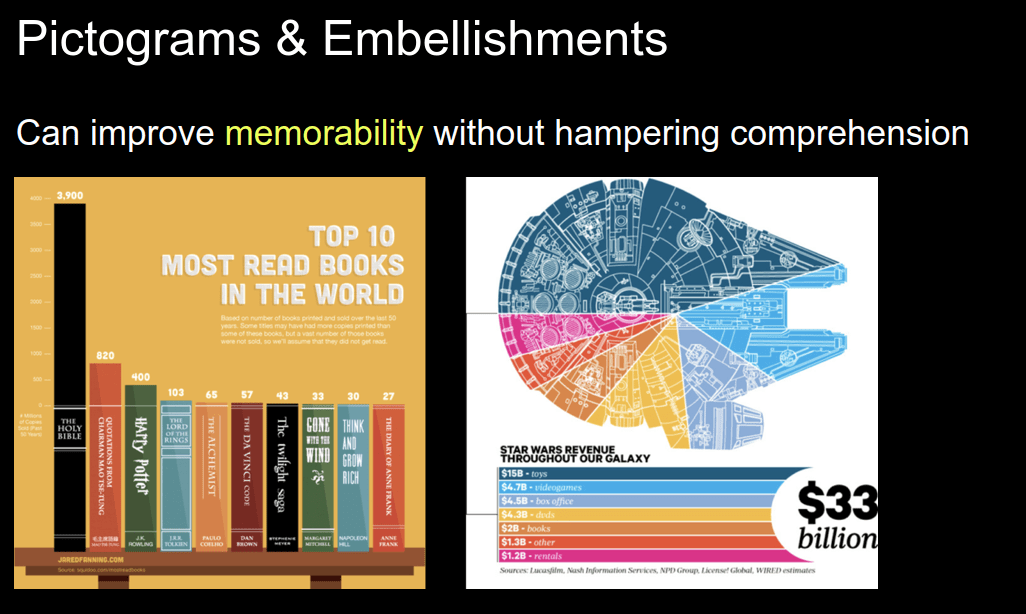
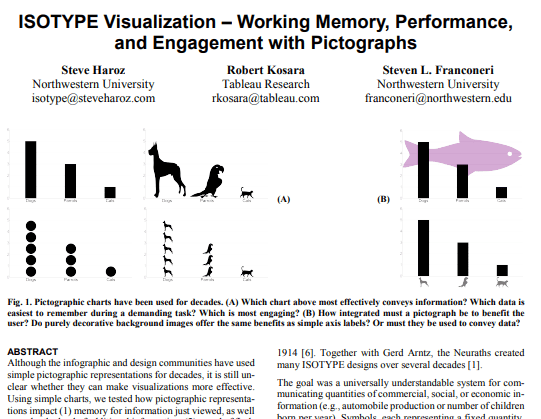
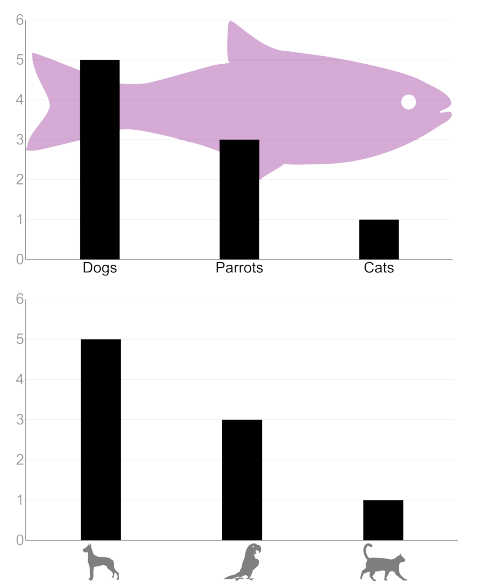
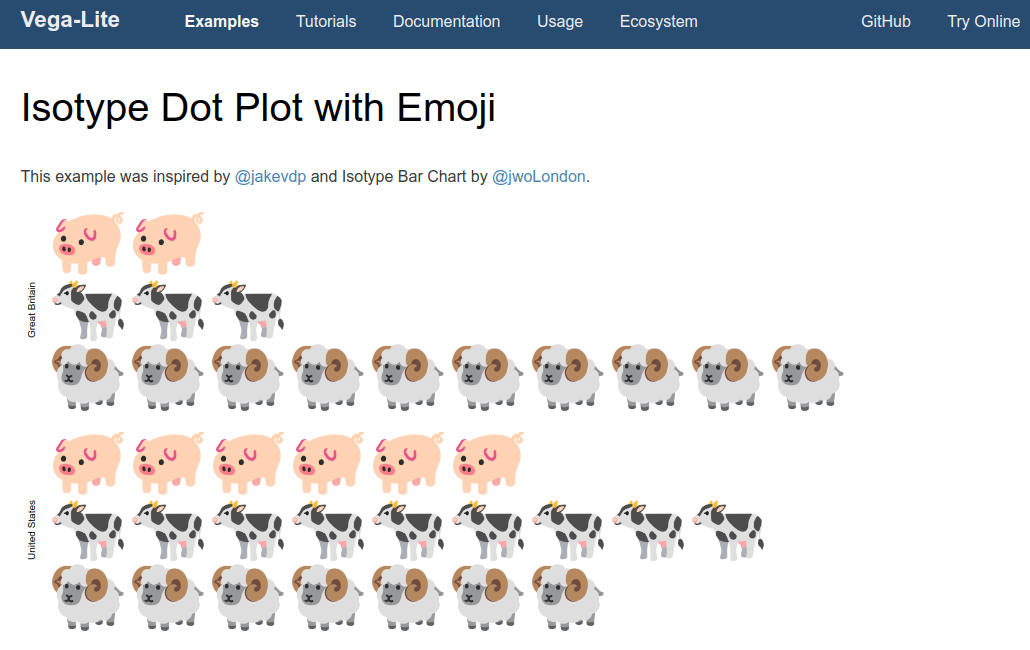
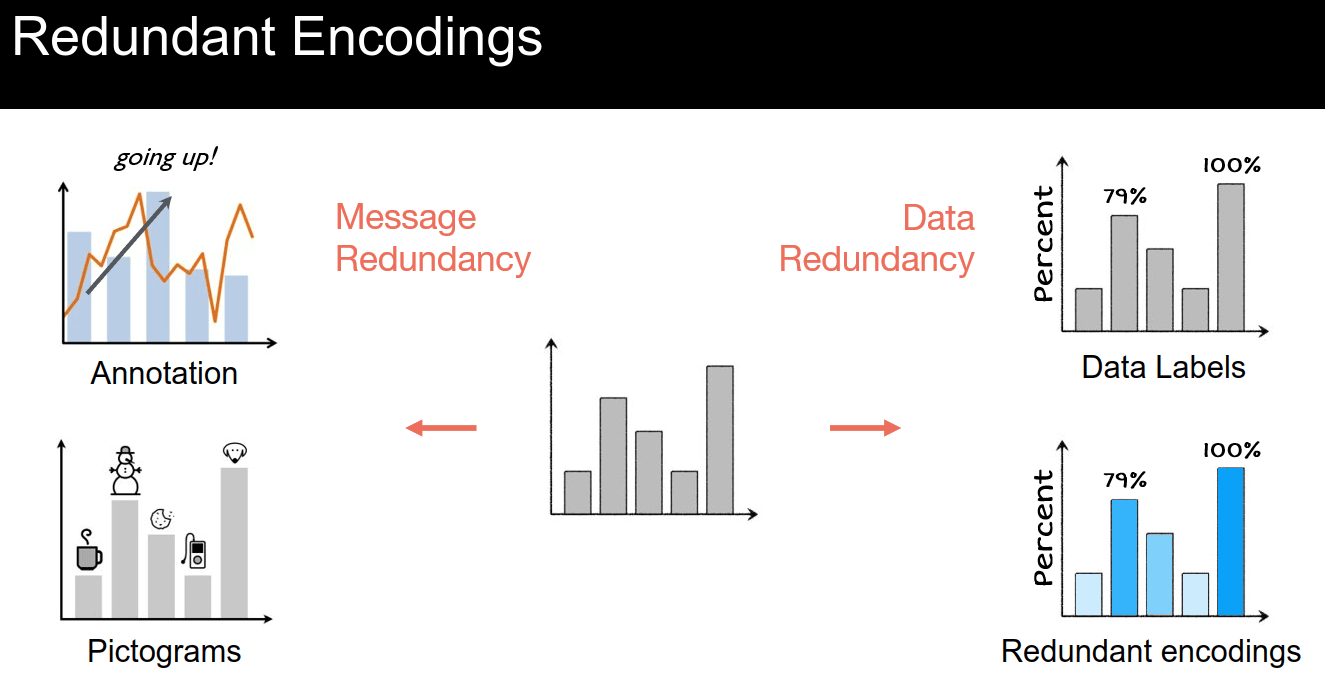
Pictographs / Icons
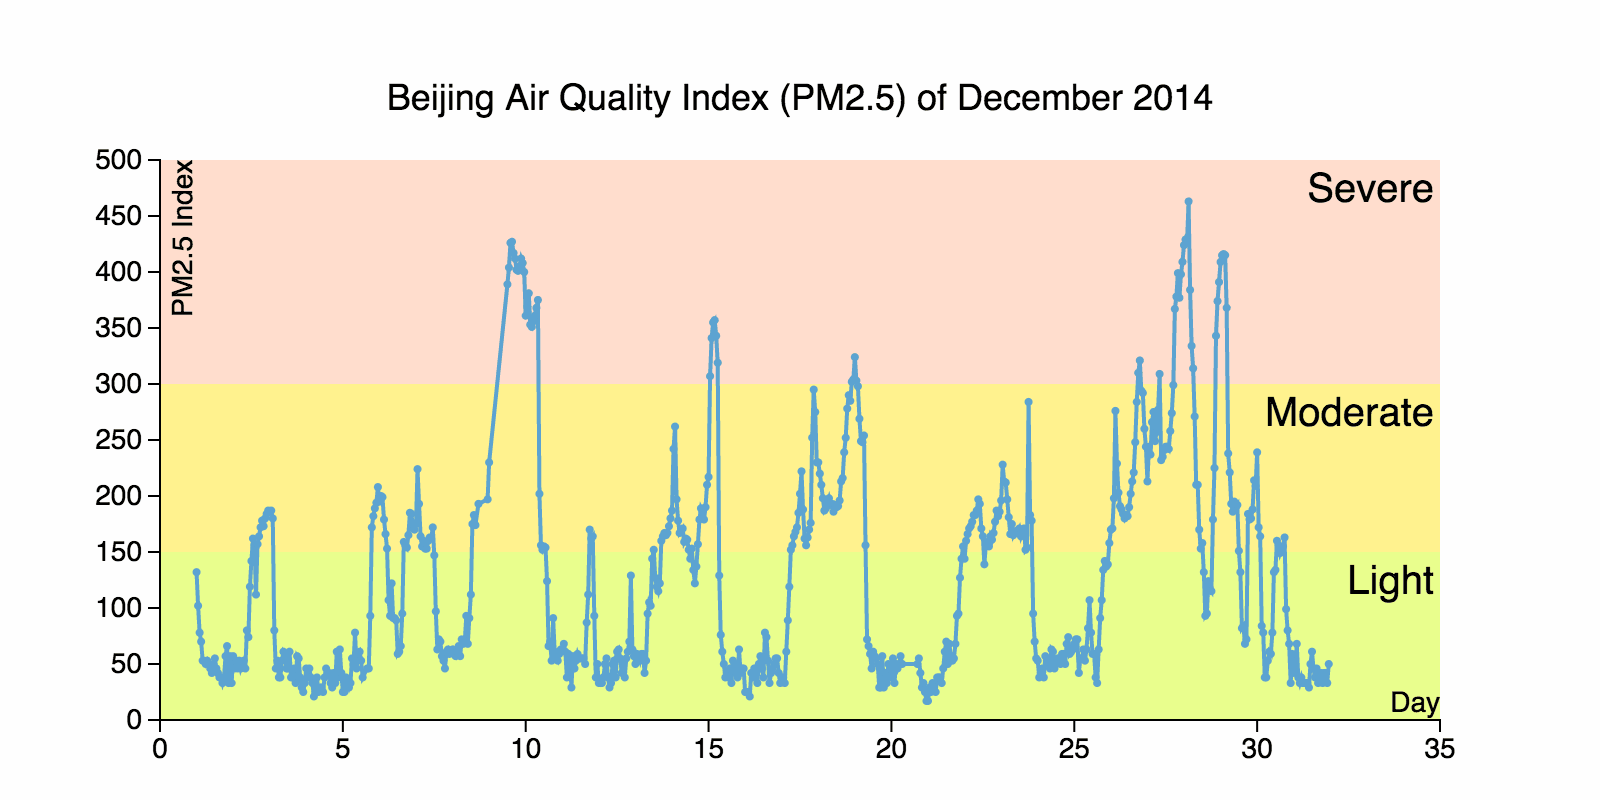


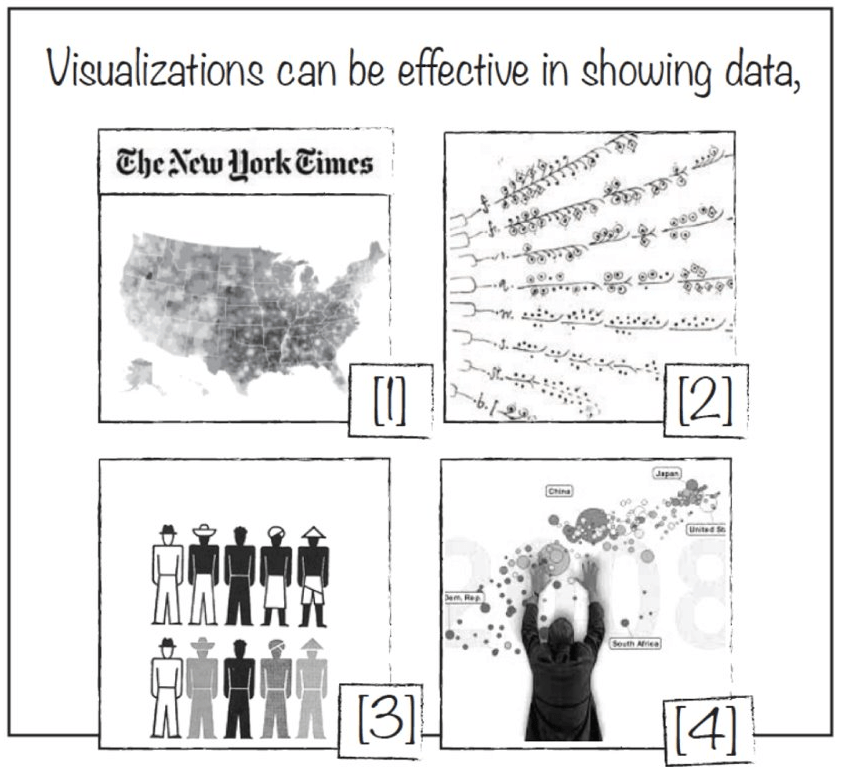
Style


Transitions
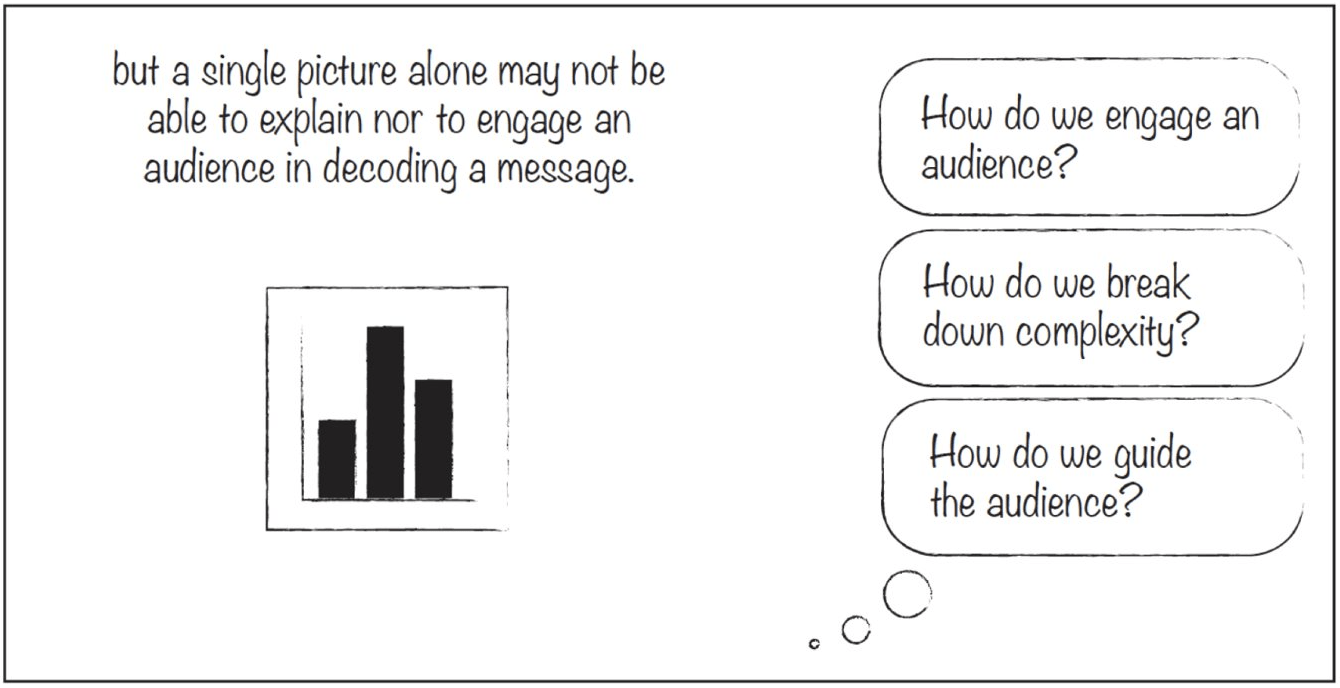
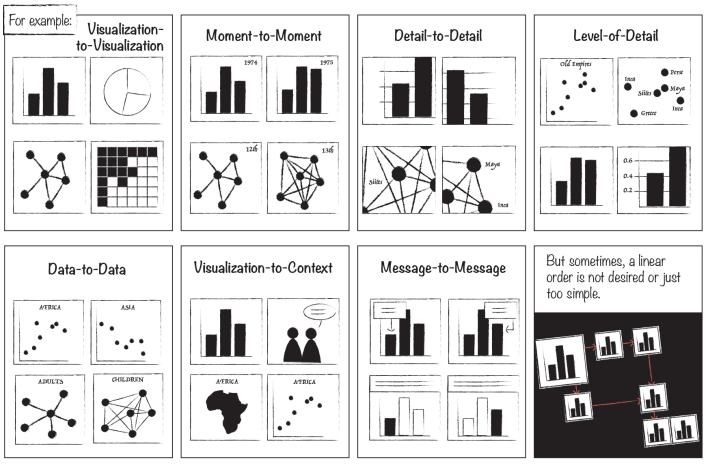
to break down the complexity
and progressively reveal different aspects
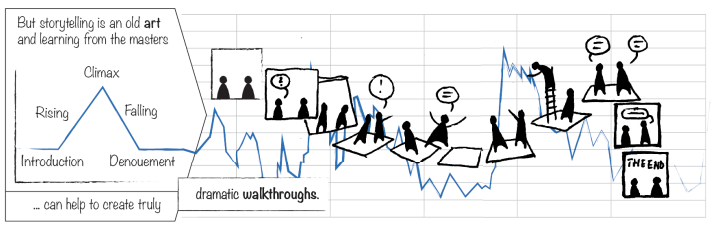
Freytag's Pyramid


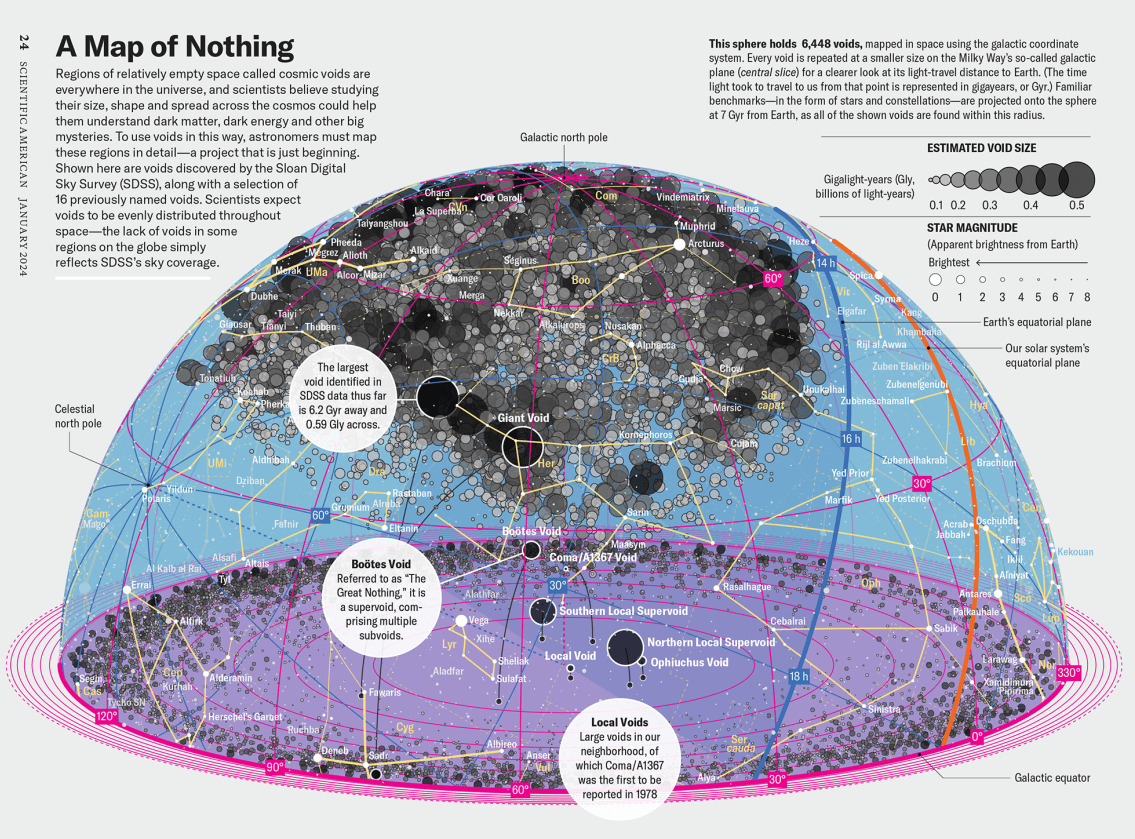
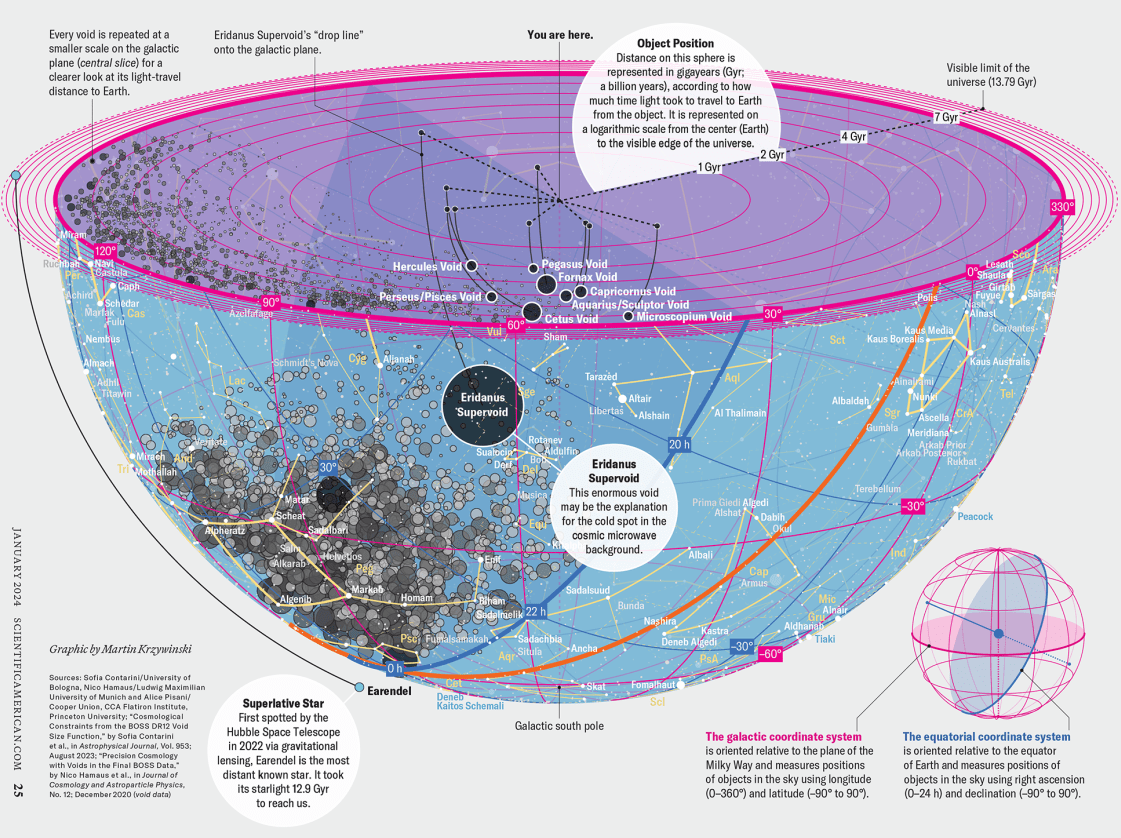
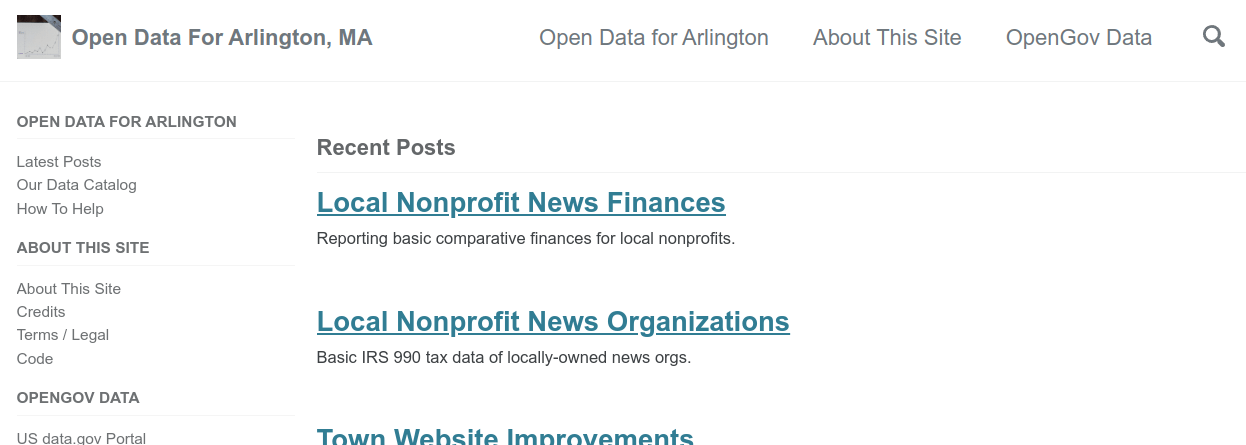
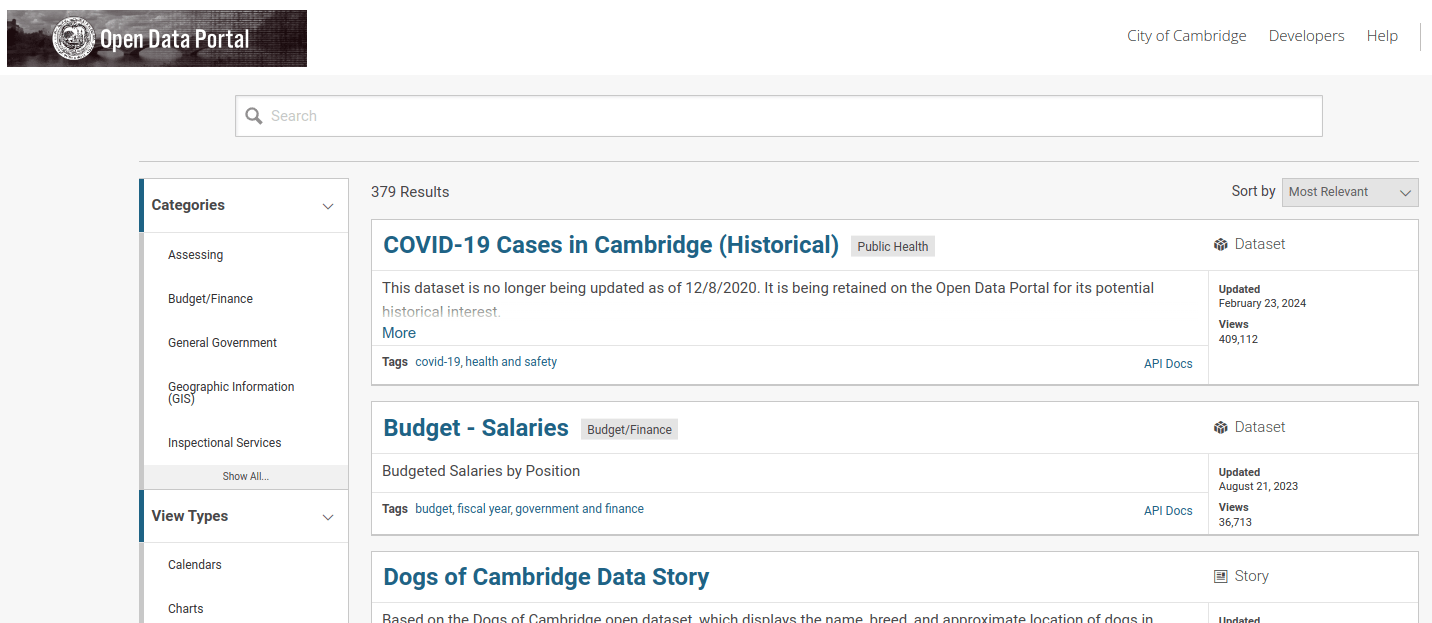
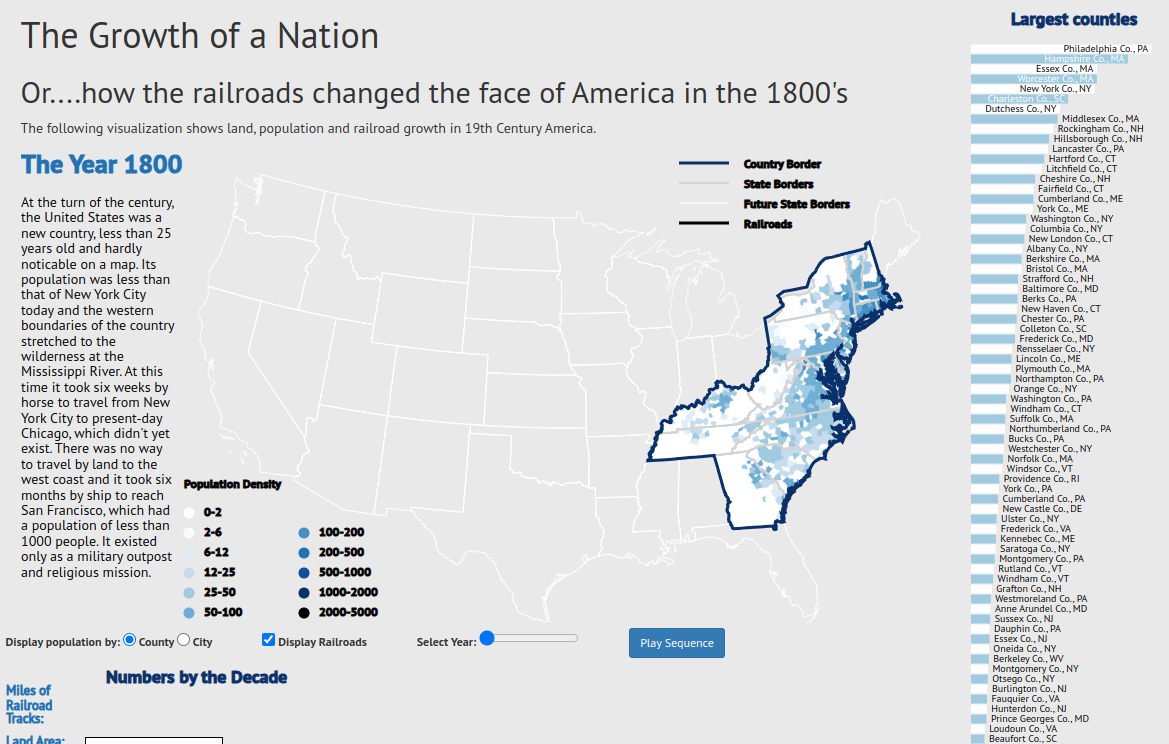
local / regional data
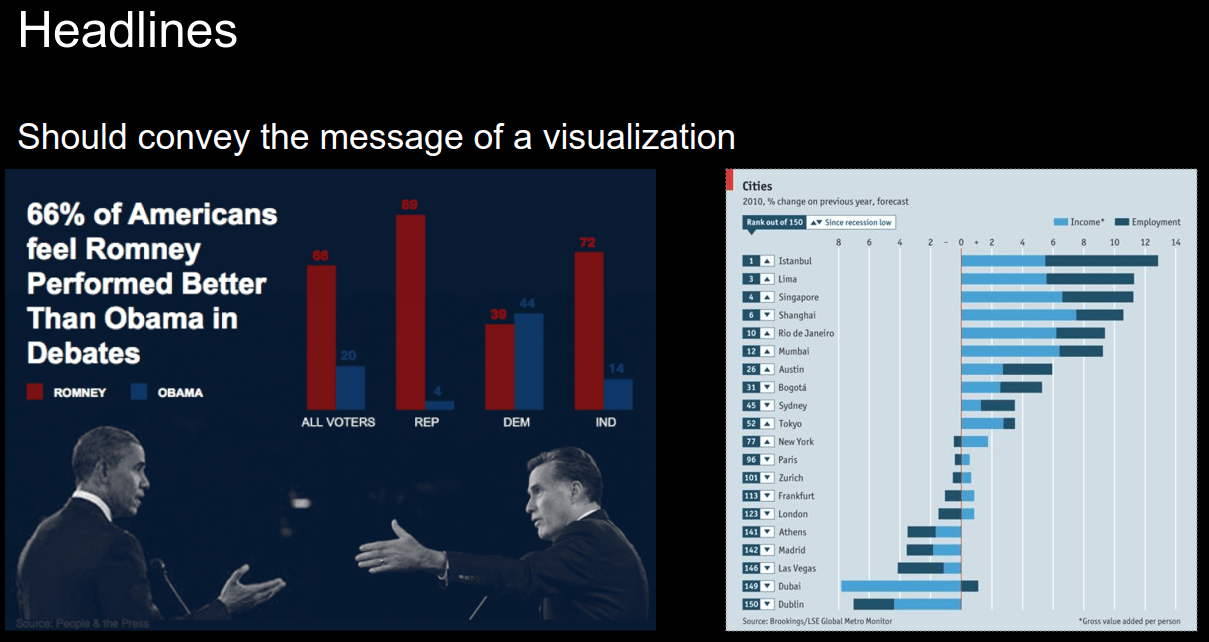
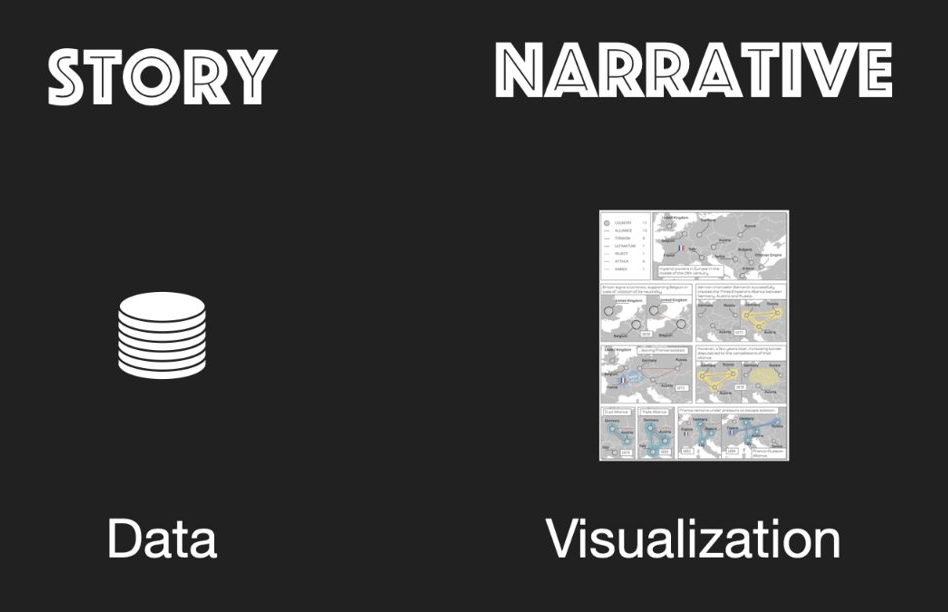
visualize
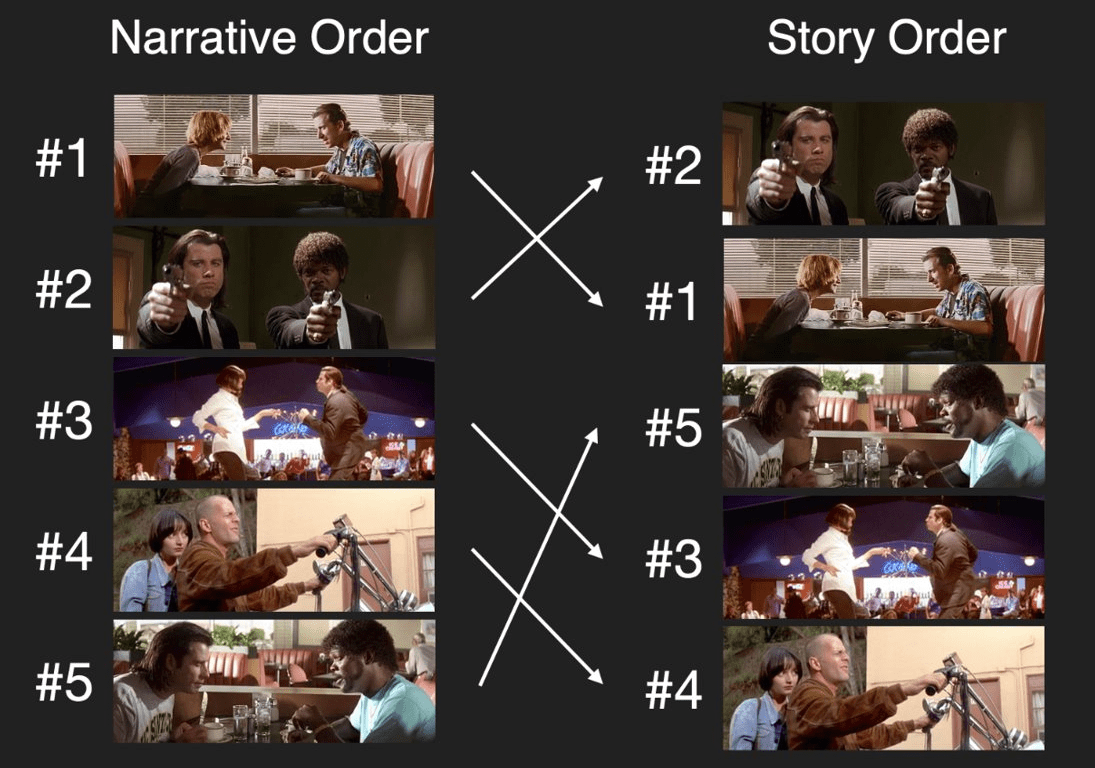
to tell a story!

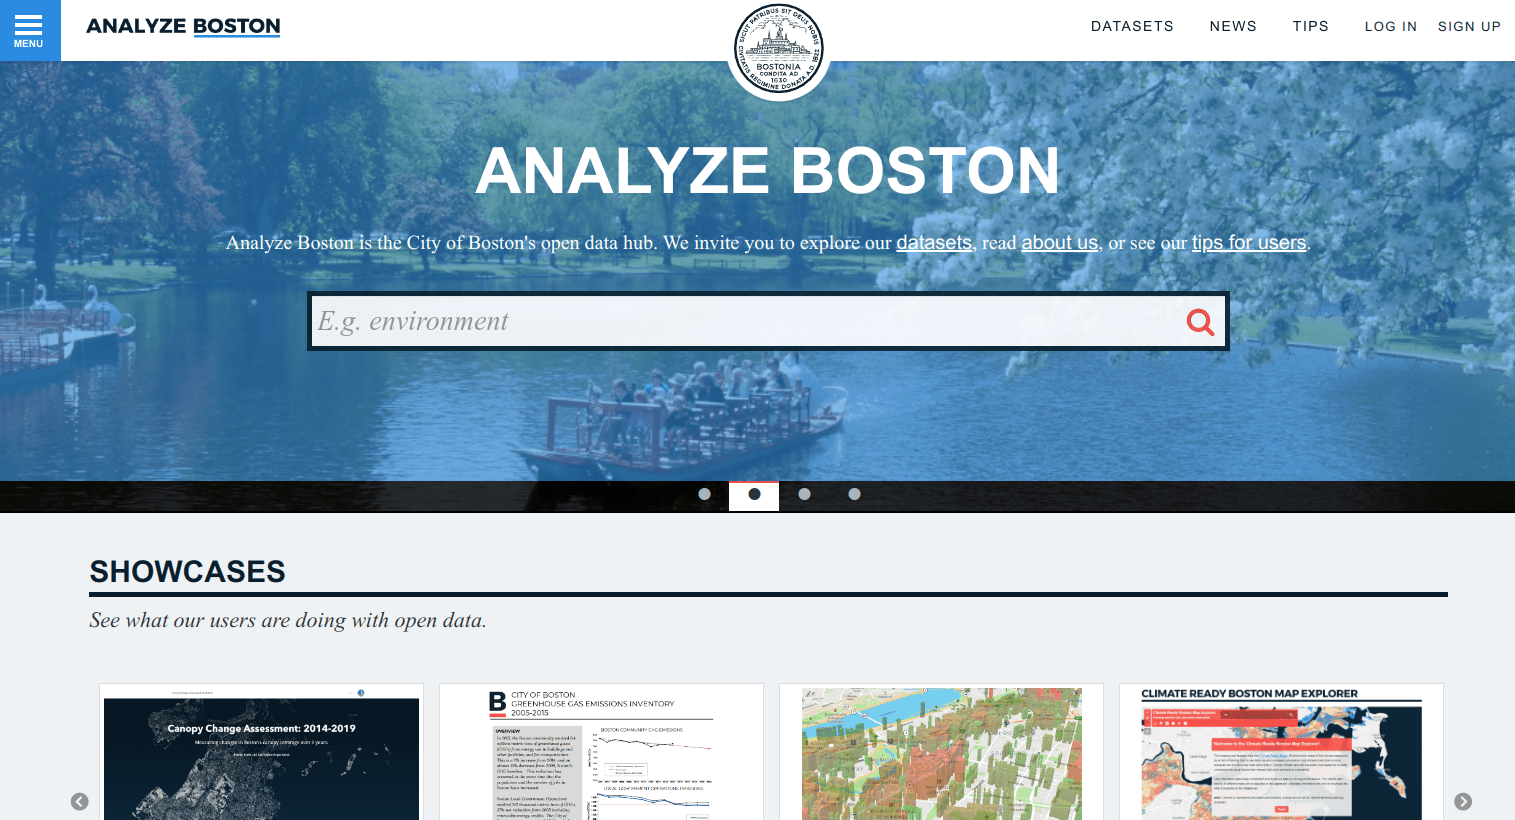


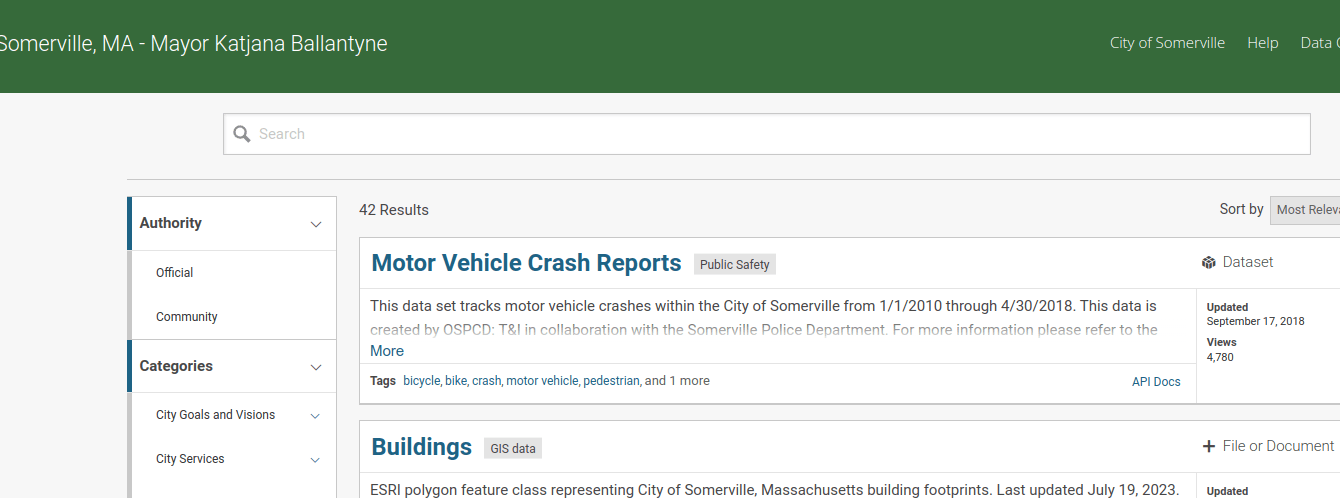

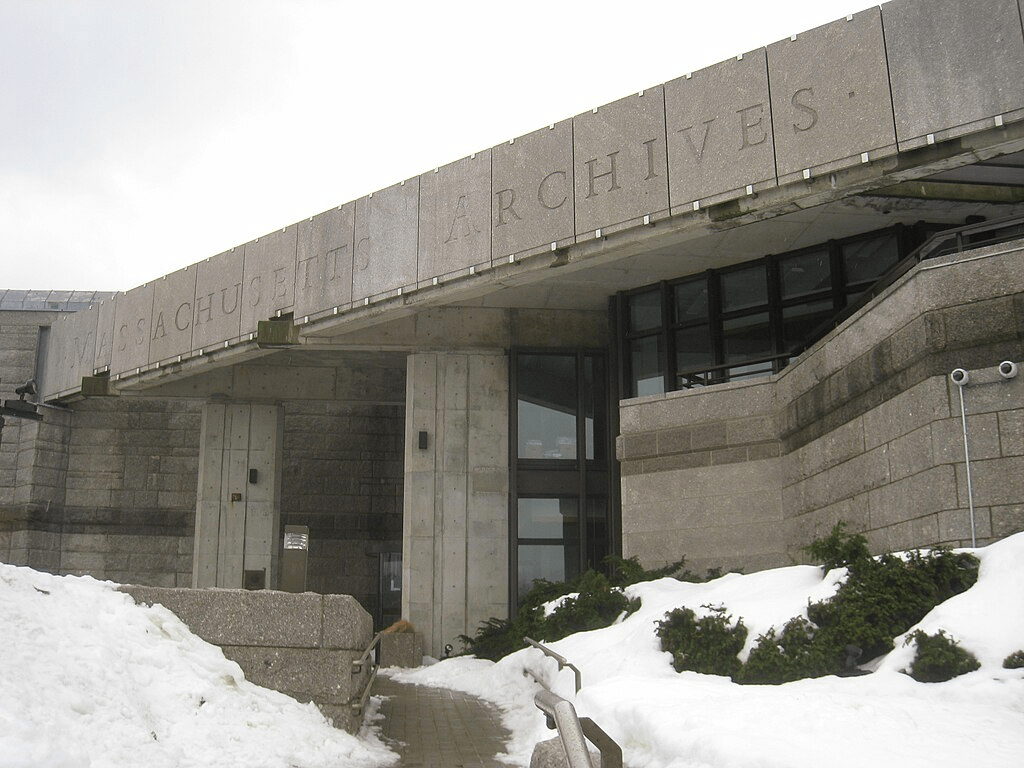
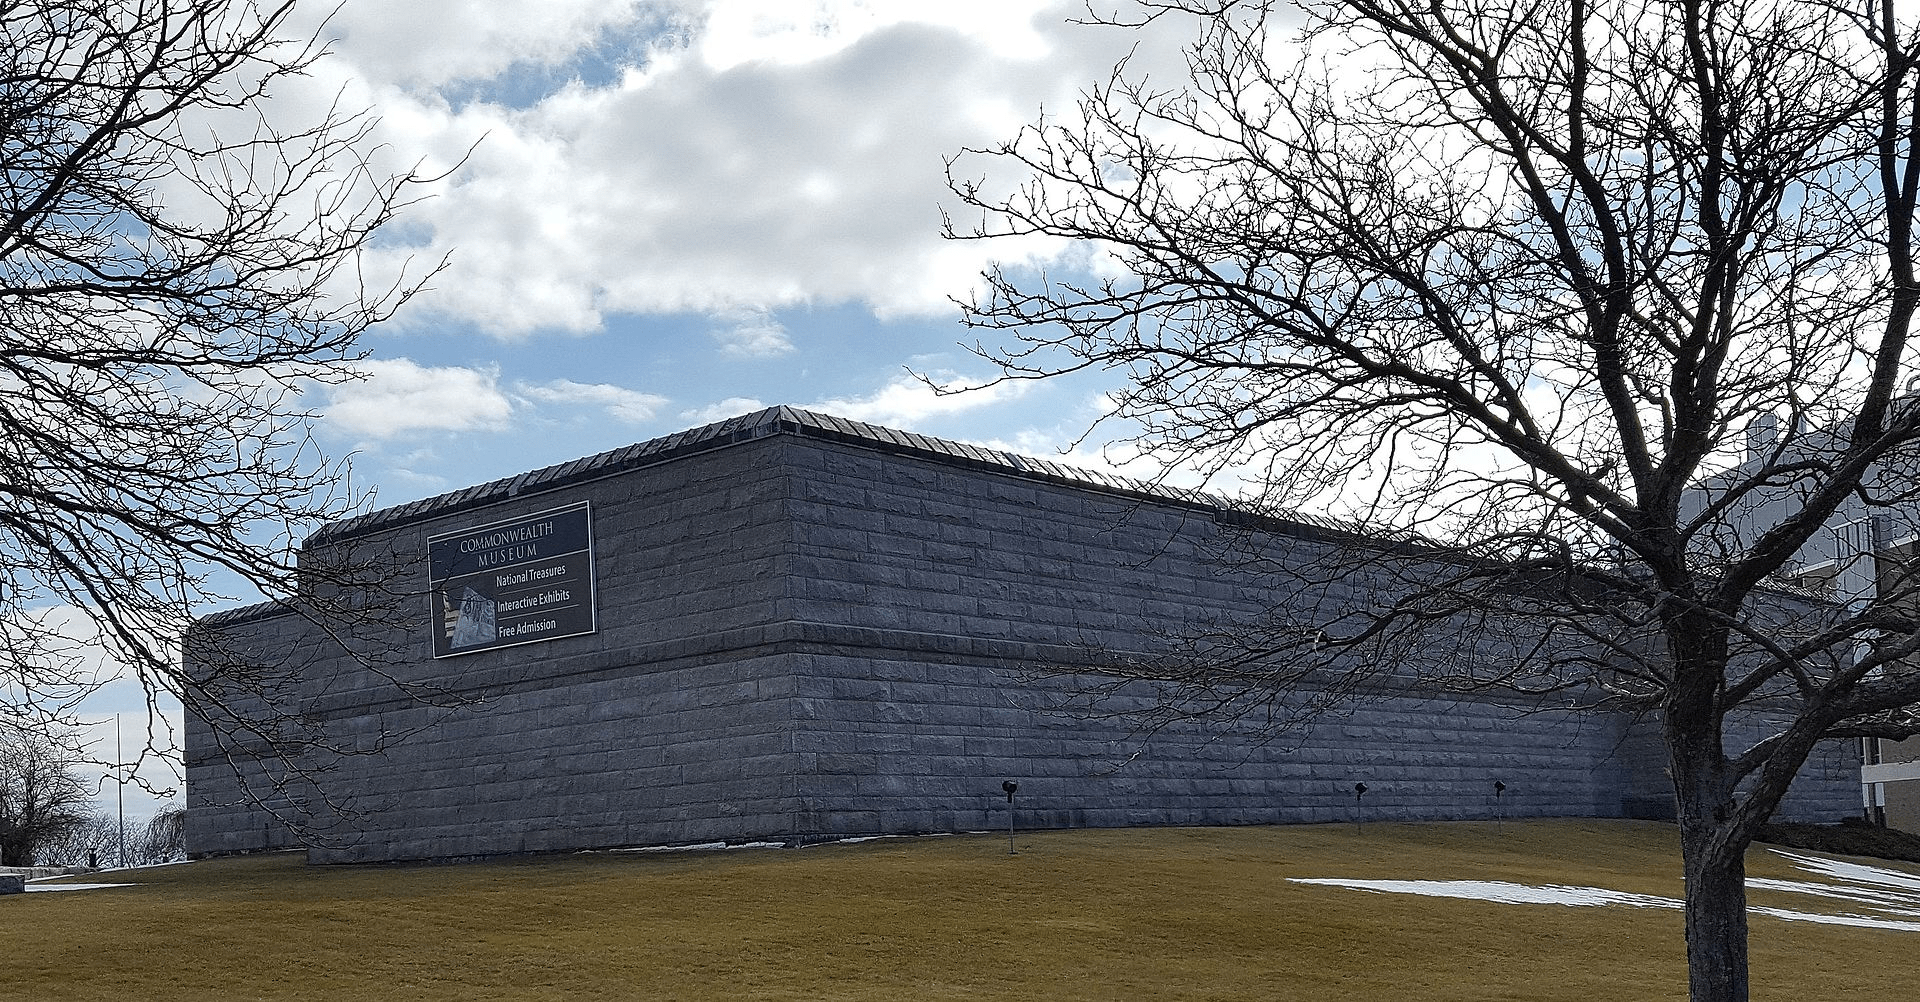
Field Trip
4/2
Homework
Homework

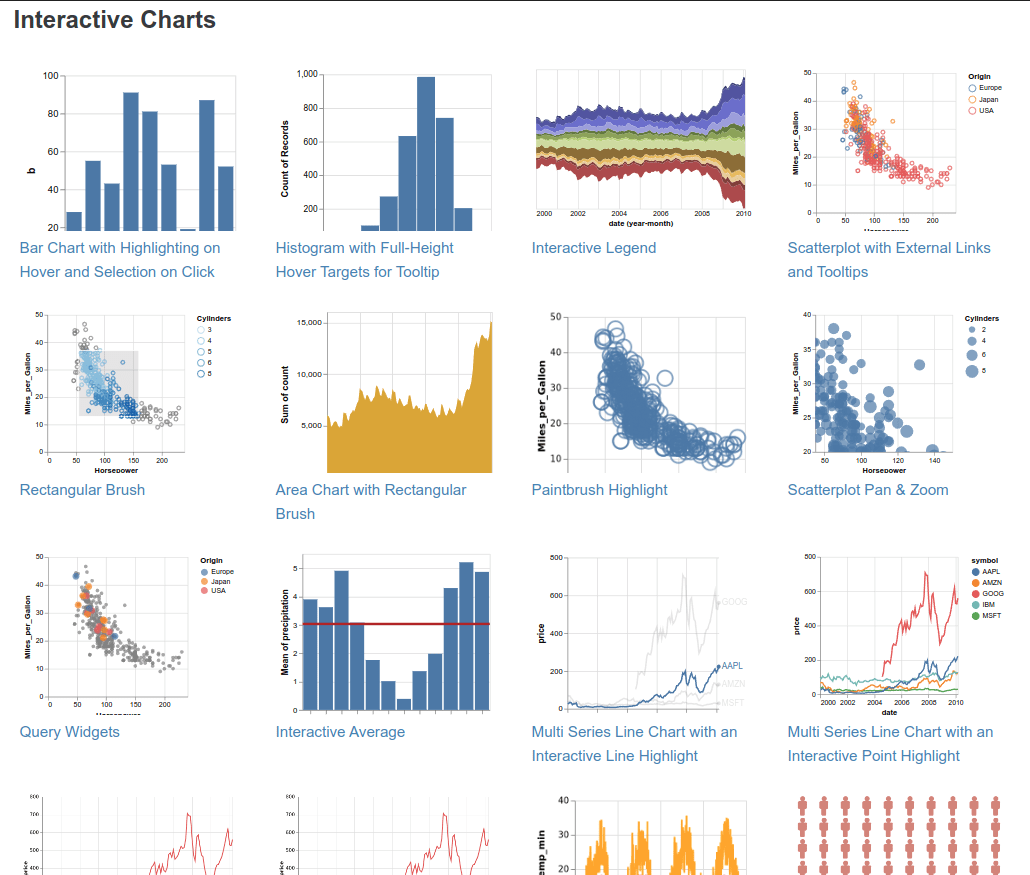
Study an interactive Vega-Lite chart!