

local / regional data
visualize
to tell a story!


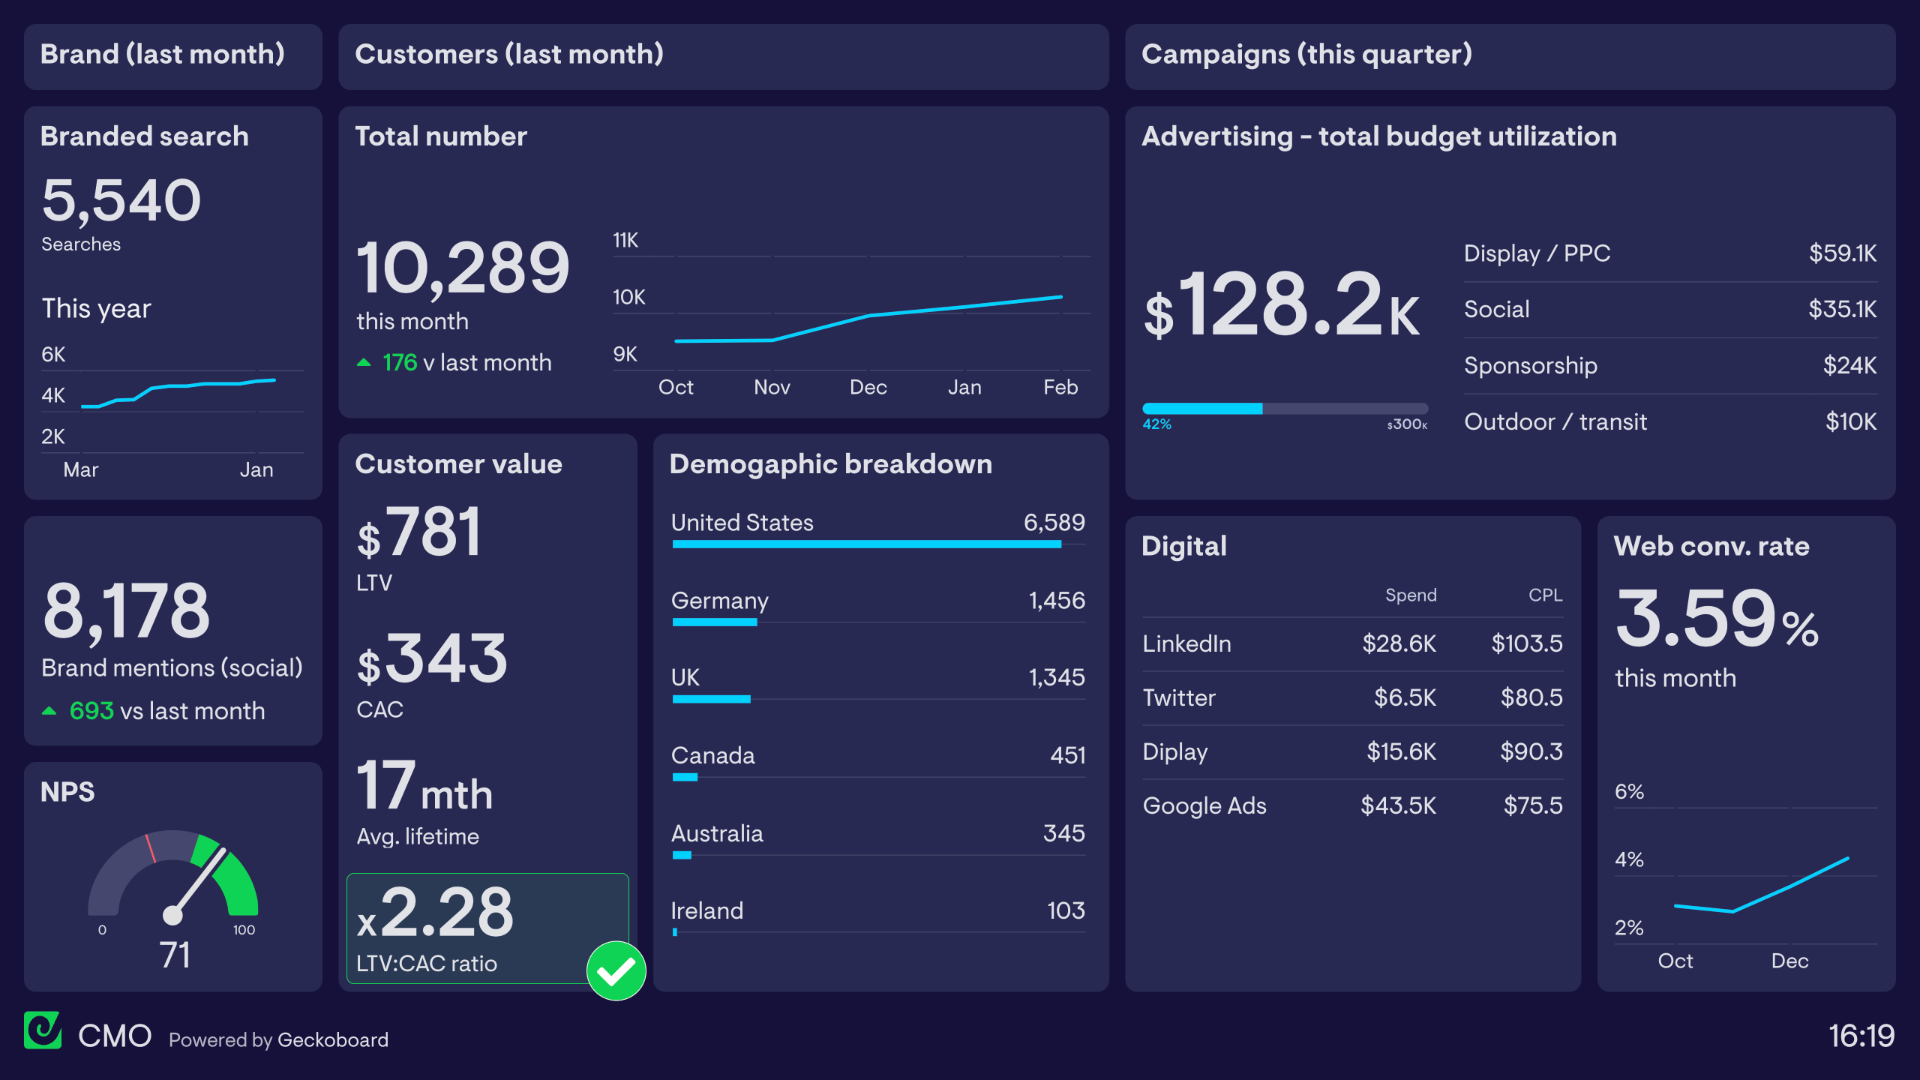
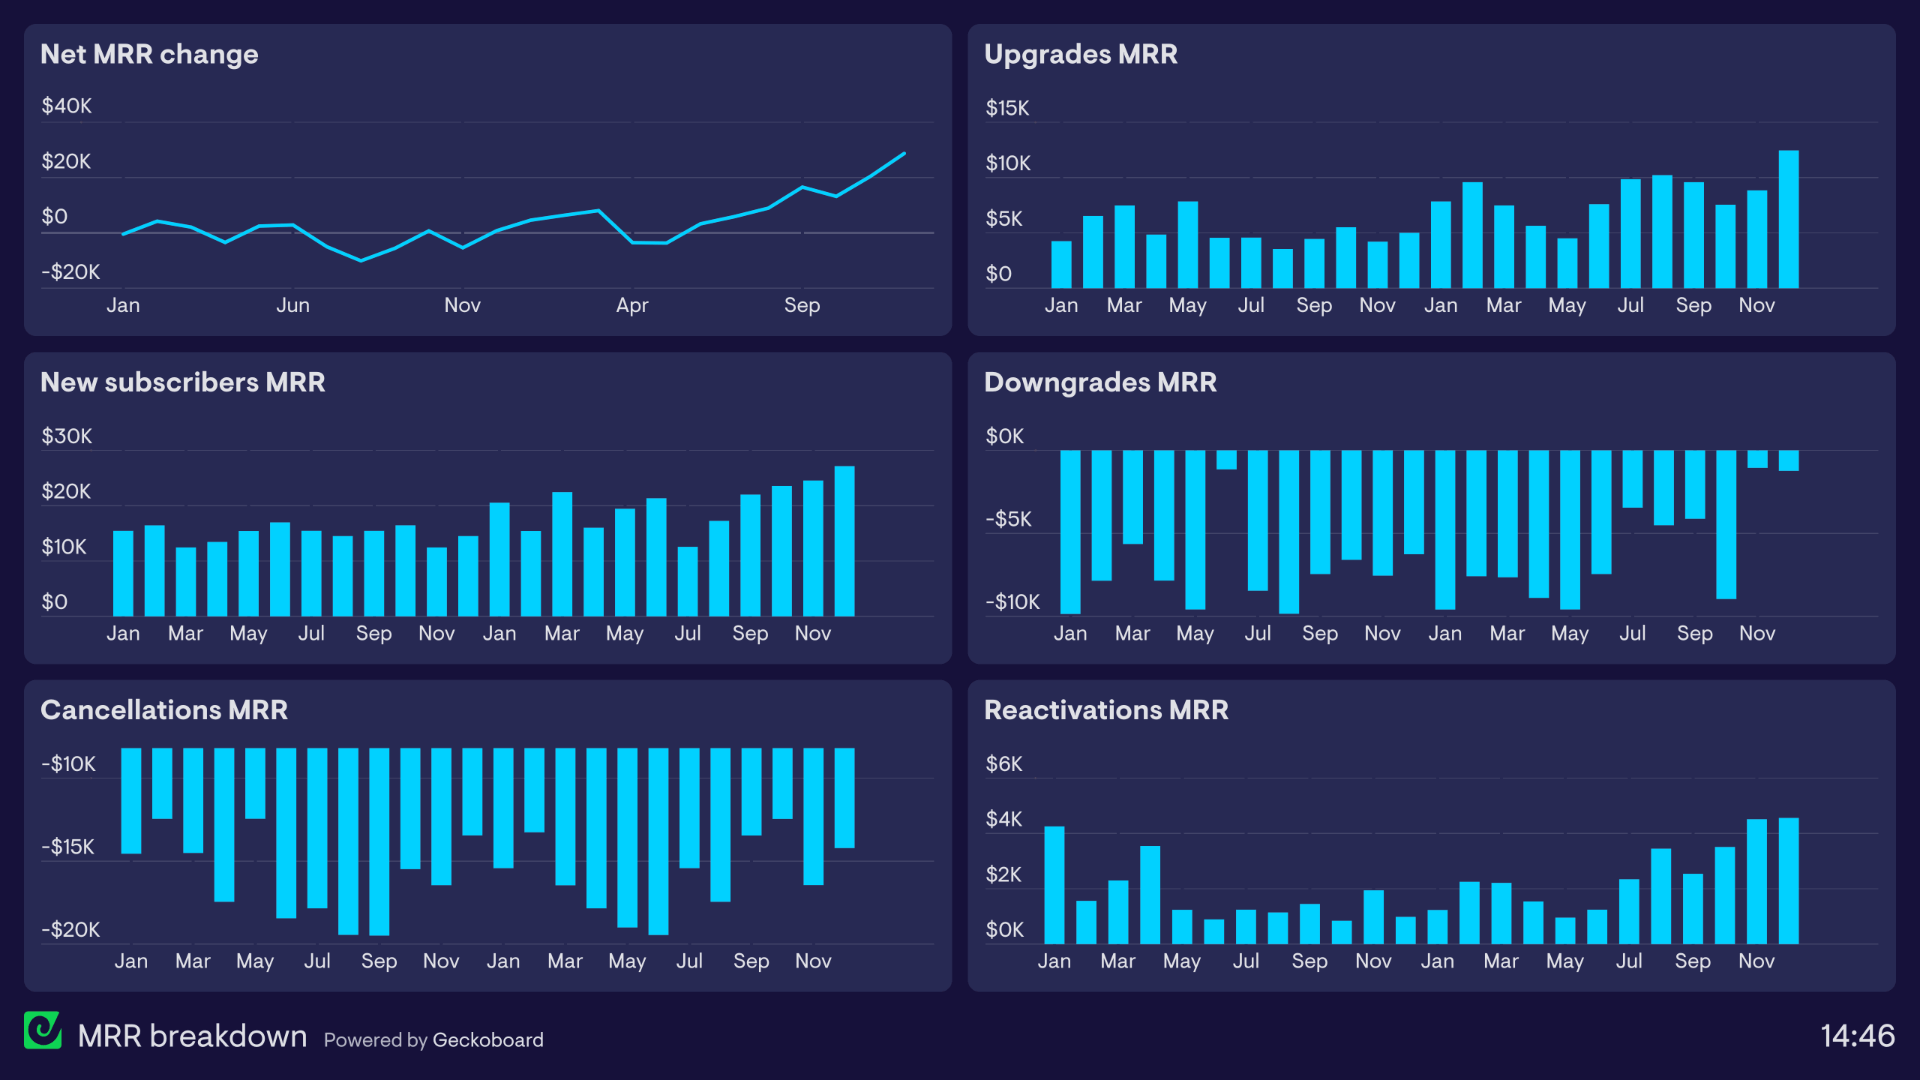
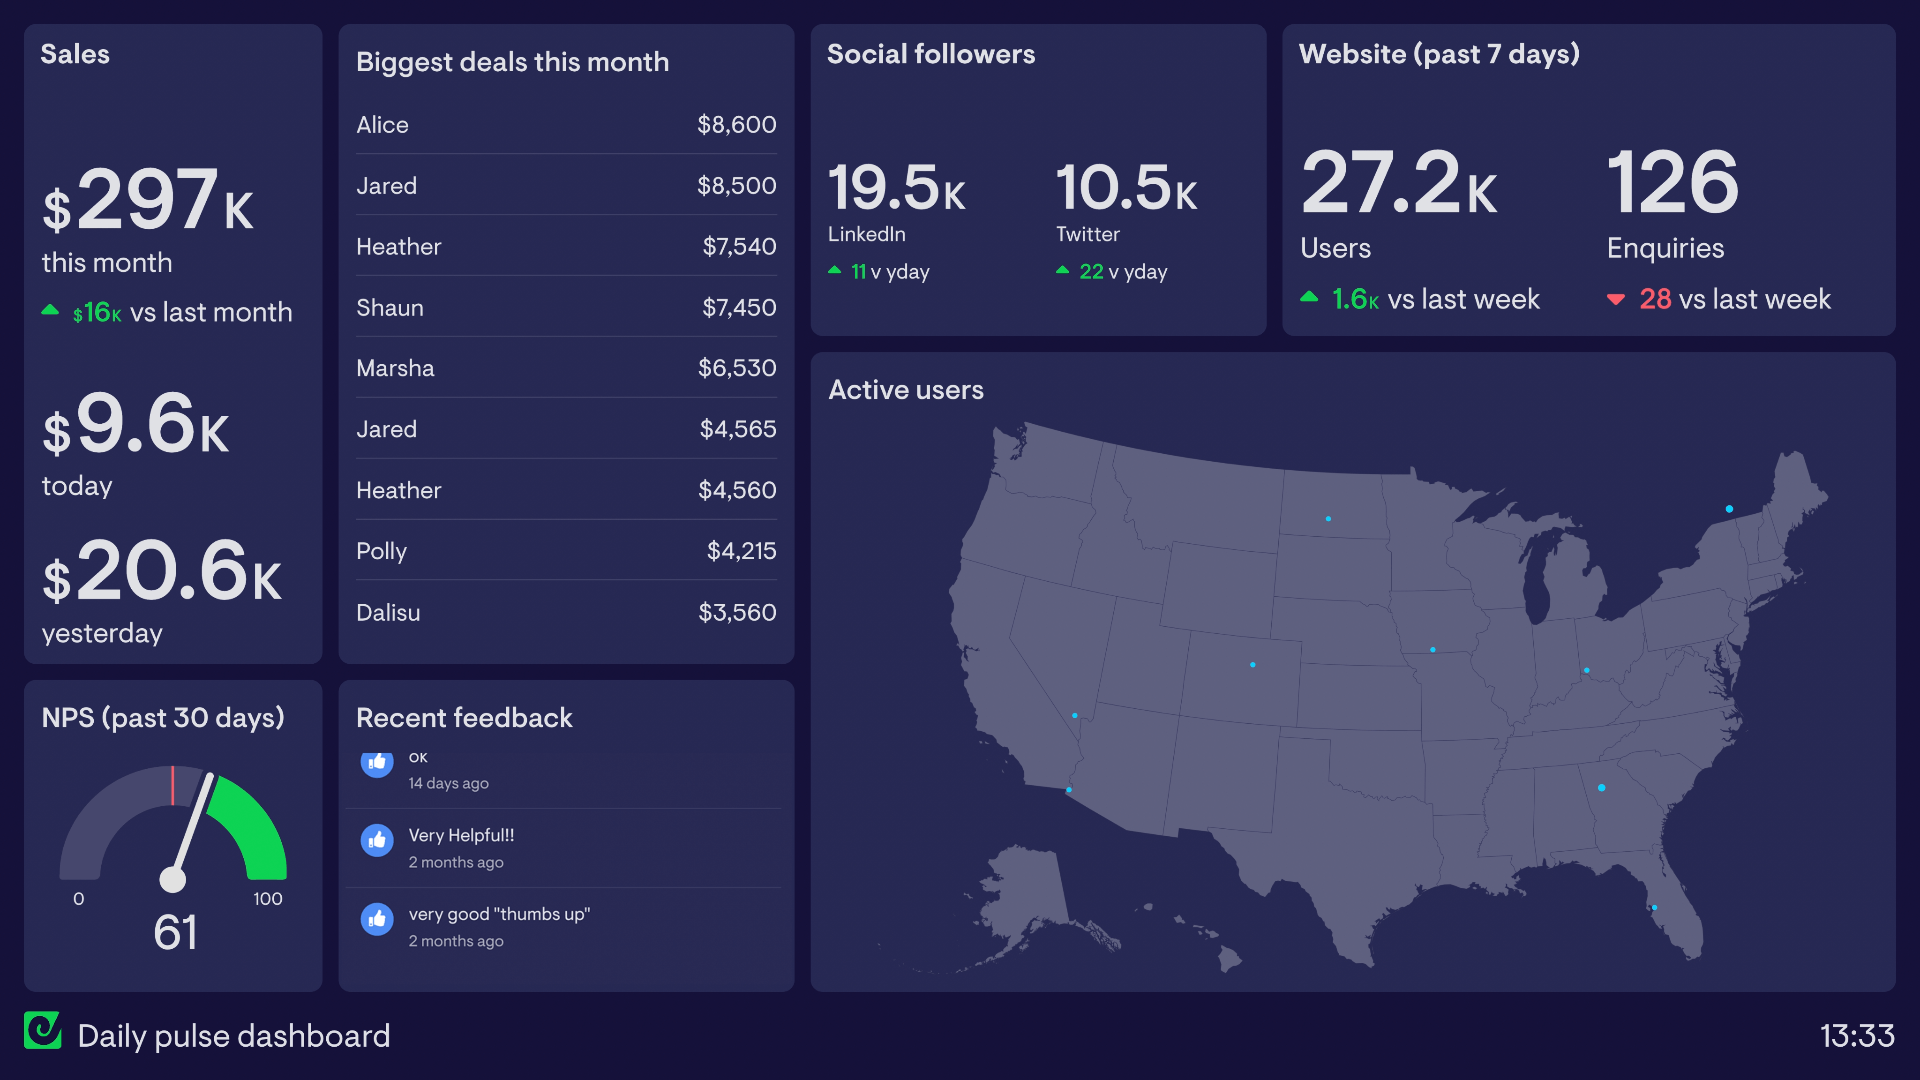
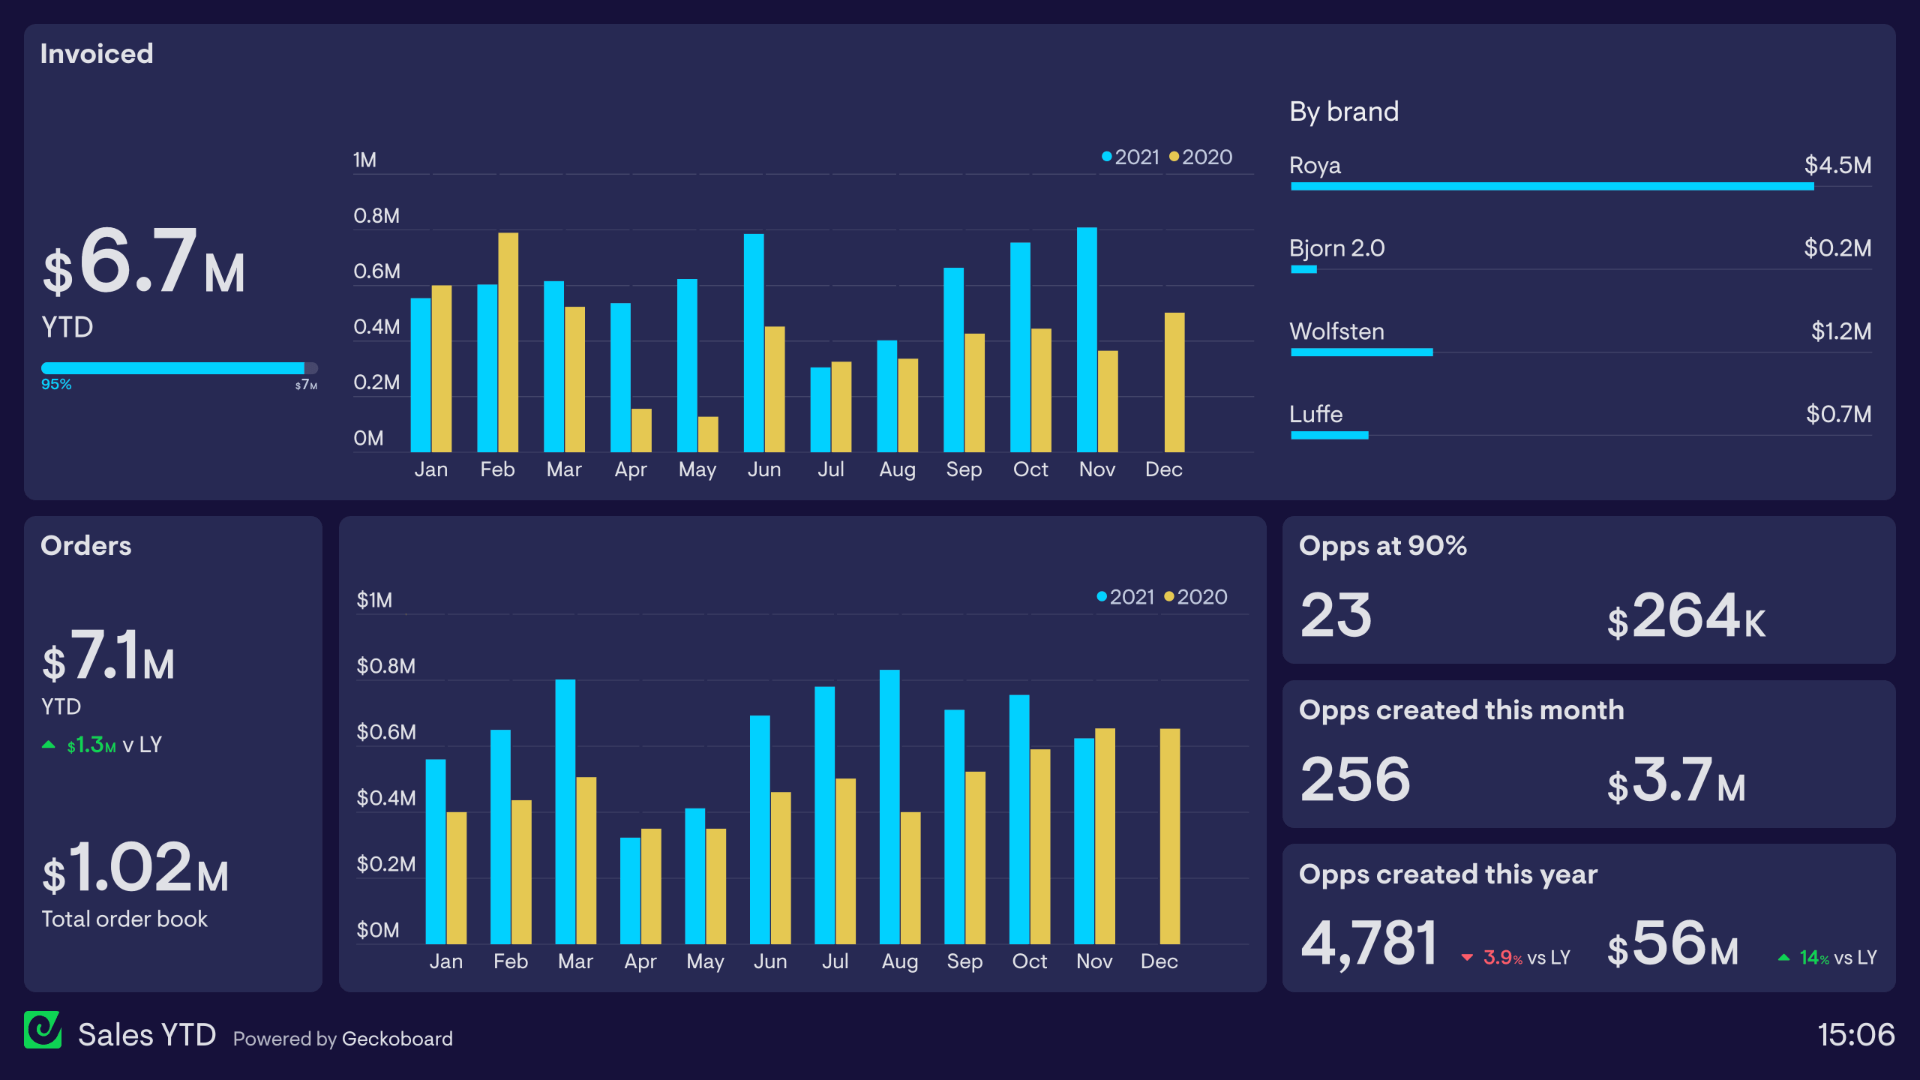
Dashboards!
KPI: Key-Performance-Indicators
Homework

Find examples of beautiful dashboards!


Homework

Find examples of beautiful dashboards!


<html>
<head>
  <script src="https://cdn.jsdelivr.net/npm/vega@latest"></script>
  <script src="https://cdn.jsdelivr.net/npm/vega-lite@latest"></script>
  <script src="https://cdn.jsdelivr.net/npm/vega-embed@latest"></script>
</head>
<body>
  <div id="vis"></div>

  <script>


    chart1 = {

      "params": [{
          "name": "zoom",
          "select": "interval",
          "bind": "scales"
        }],

      "vconcat": [

          {
            "width": 1000,
            "data": {"url": "https://vega.github.io/vega-lite/data/seattle-weather.csv"},
            "mark": "circle",
            "title": "Seattle",
            "encoding": {
              "x": {
                "field": "date",
                "timeUnit": "monthdate",
                "title":"Date",
                "axis": {"format": "%b"}
              },
              "y": {
                "field": "temp_max",
                "scale": {"domain": [-5, 40]},
                "type": "quantitative",
                "title": "Max. Temperature (C)"},
              "size": {
                "title": "Precipitation",
                "field": "precipitation",
                "scale": {"domain": [-1, 50]},
                "type": "quantitative"
              },
            },
          },
          {
            "width": 1000,
            "data": {"url": "https://cs617.org/data/boston_weather.csv"},
            "mark": "circle",
            "transform": [{
              "filter": {"field": "time",
                       "range": [  {"year": 2012, "month": 1, "date": 1},
                                  {"year": 2016, "month": 12, "date": 31}]},
              }],
            "title": "Boston",
            "encoding": {
              "x": {
                "field": "time",
                "timeUnit": "monthdate",
                "title":"Date",
                "axis": {"format": "%b"}
              },
              "y": {
                "field": "tmax",
                "scale": {"domain": [-5, 40]},
                "type": "quantitative",
                "title": "Max. Temperature (C)"
              },
              "size": {
                "title": "Precipitation",
                "field": "prcp",
                "scale": {"domain": [-1, 50]},
                "type": "quantitative"
              },
            },

          }

        ]

    };

    vegaEmbed("#vis", chart1, {actions: false});

  </script>
</body>
</html>


From last time
+ RateMyProf

From last time
+ RateMyProf
+ Departments


Coach vs. Faculty


Homework

Think about your final project topic!
