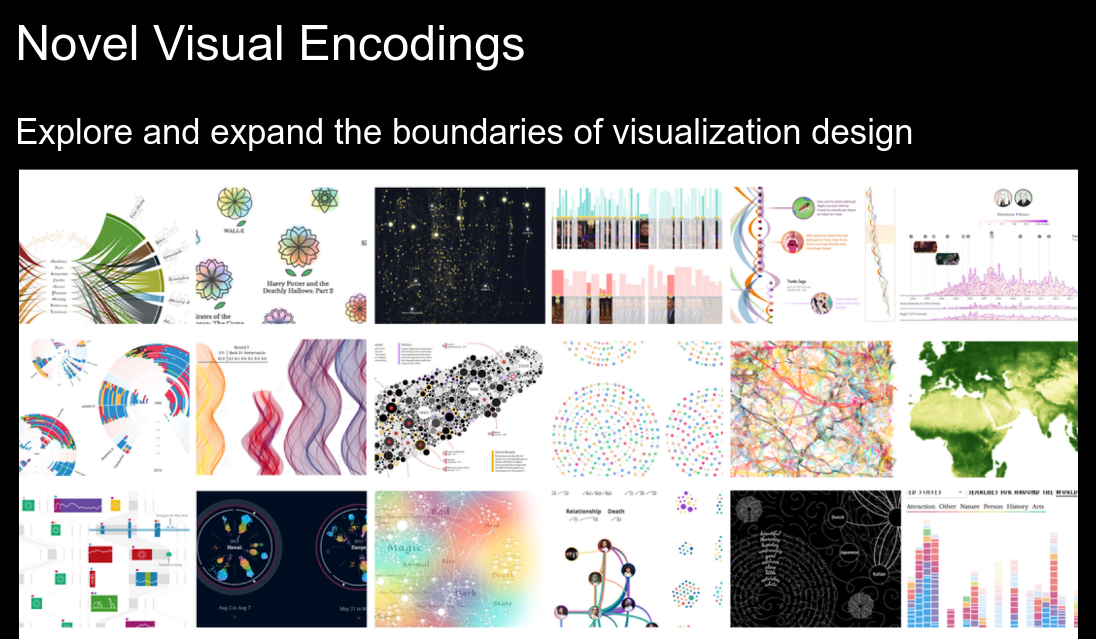
CS615: Visualization
Daniel Haehn


CS480 /
CS697
Spring 2024


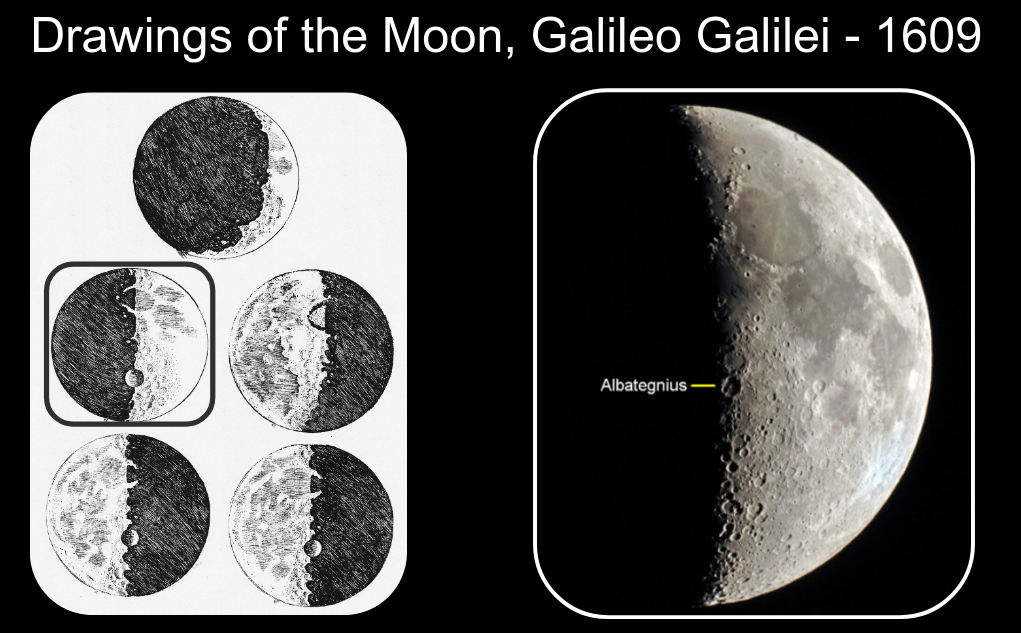
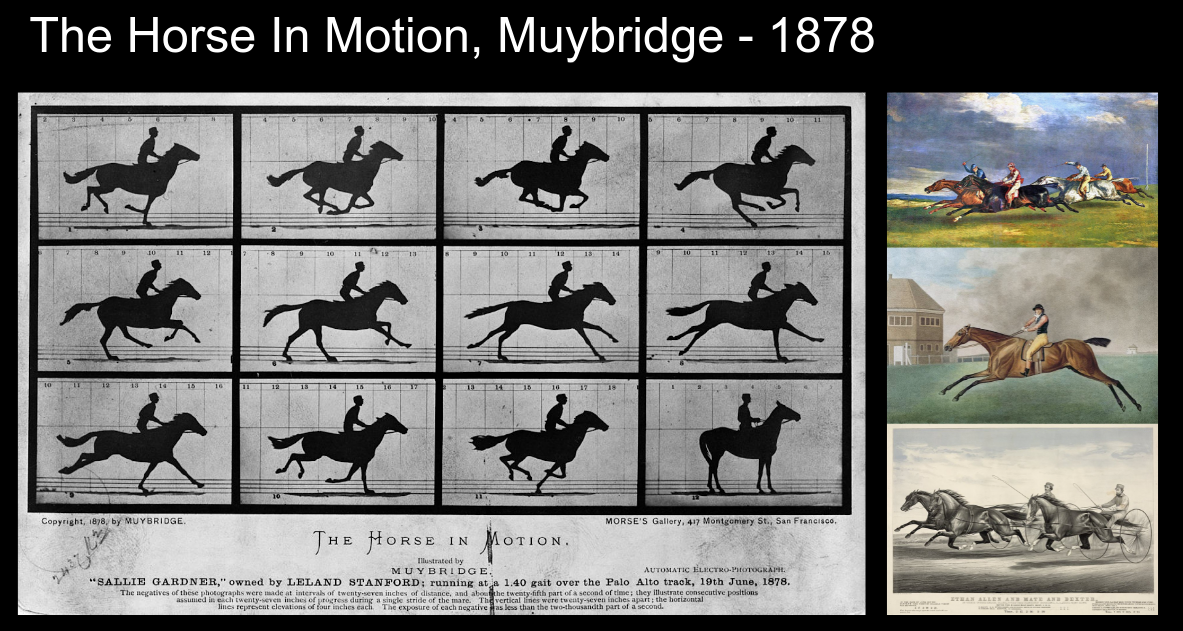
First example of chronophotography
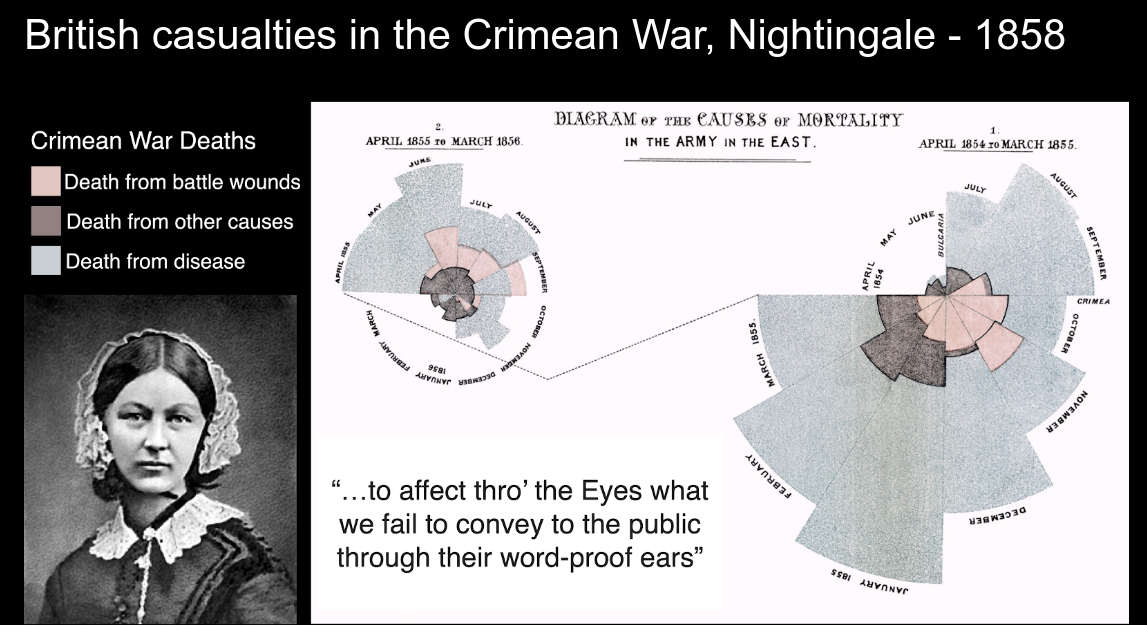
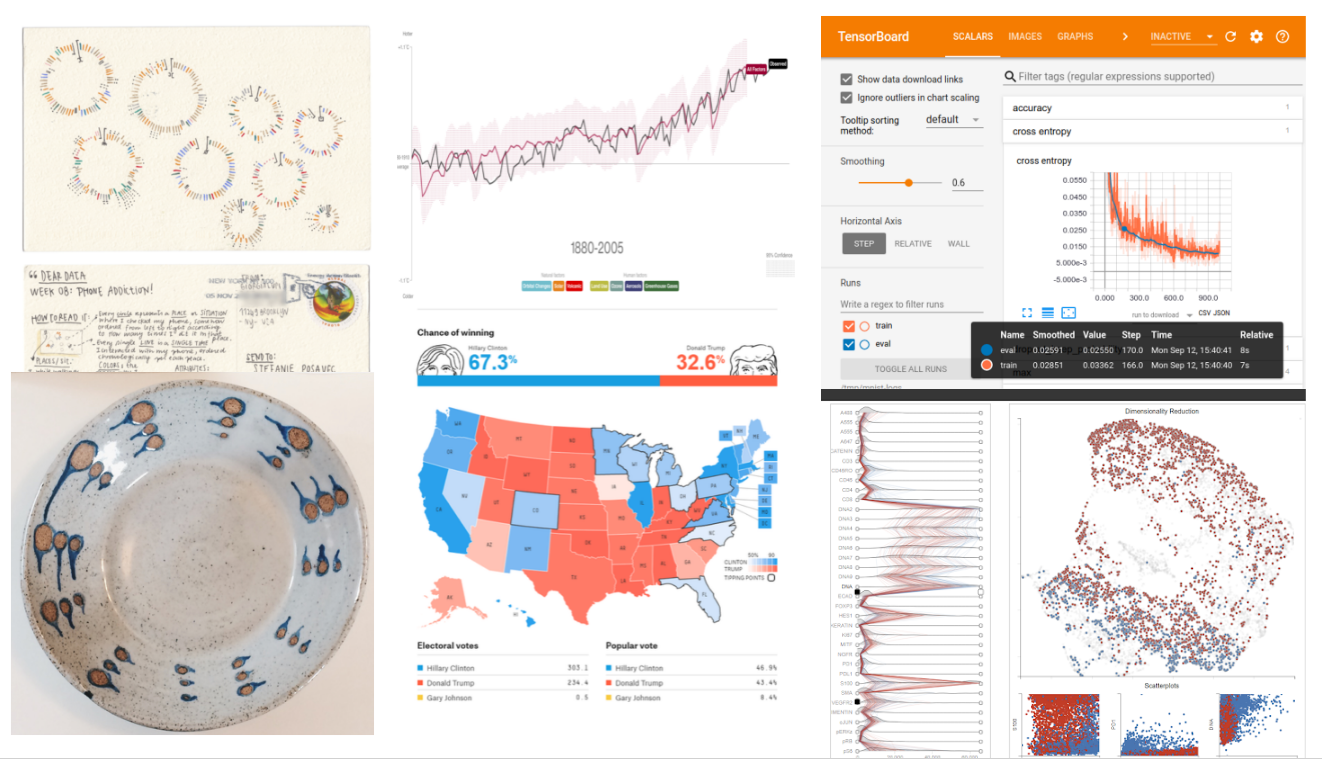
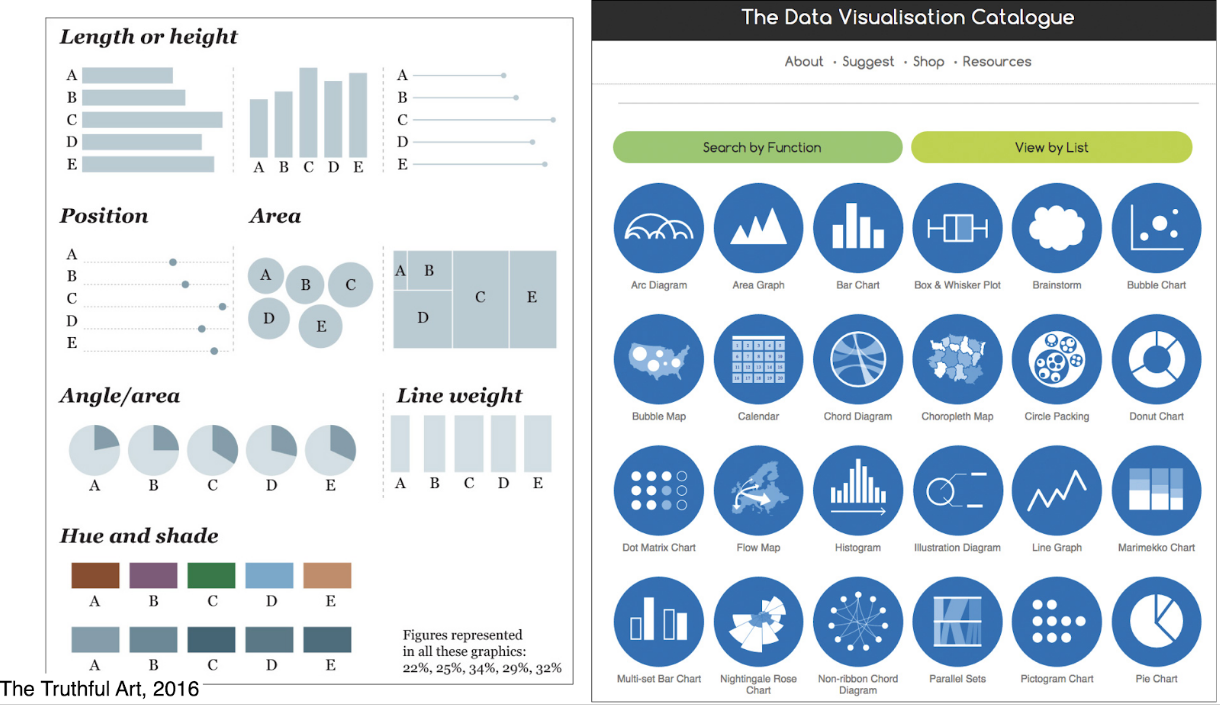
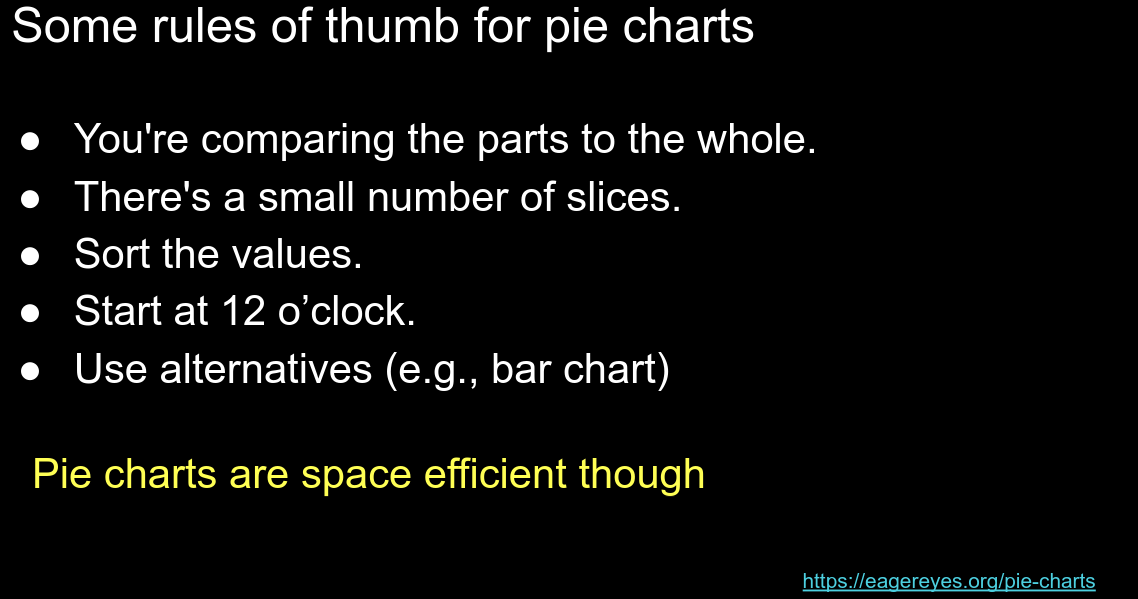
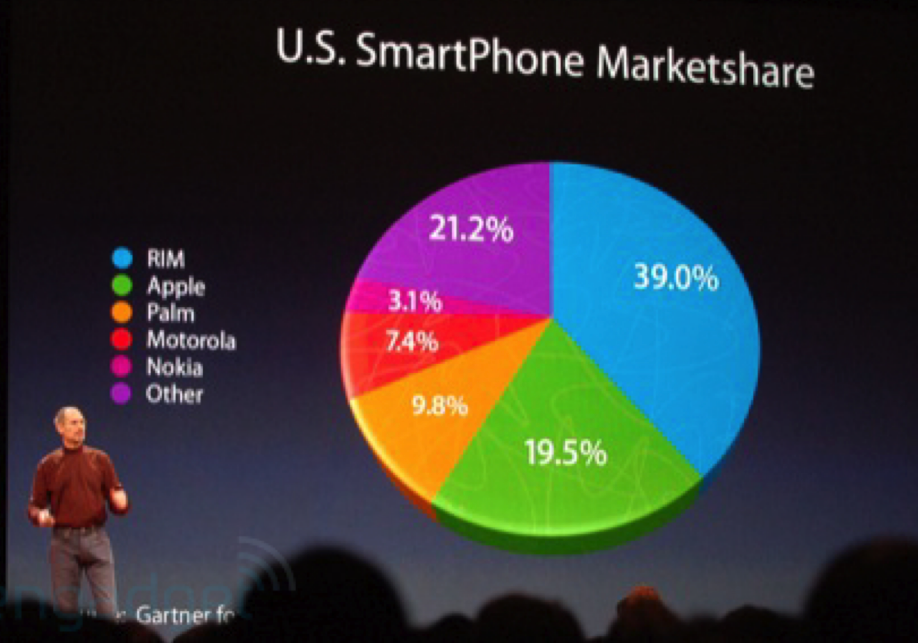
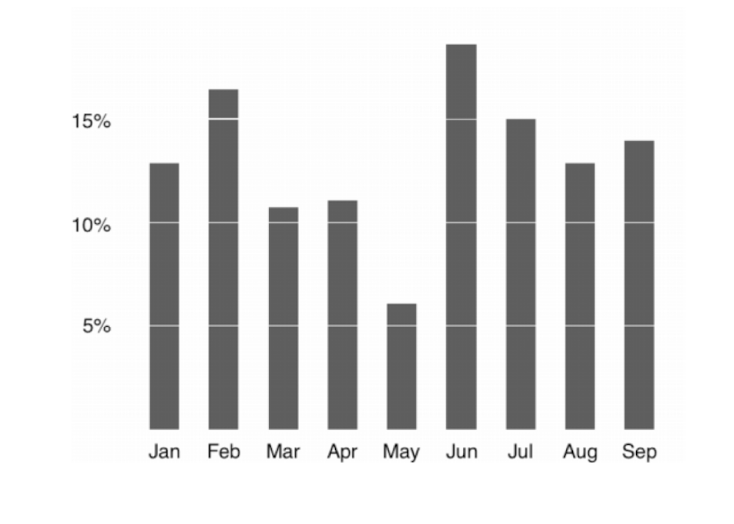
Coxcomb chart, very popular today


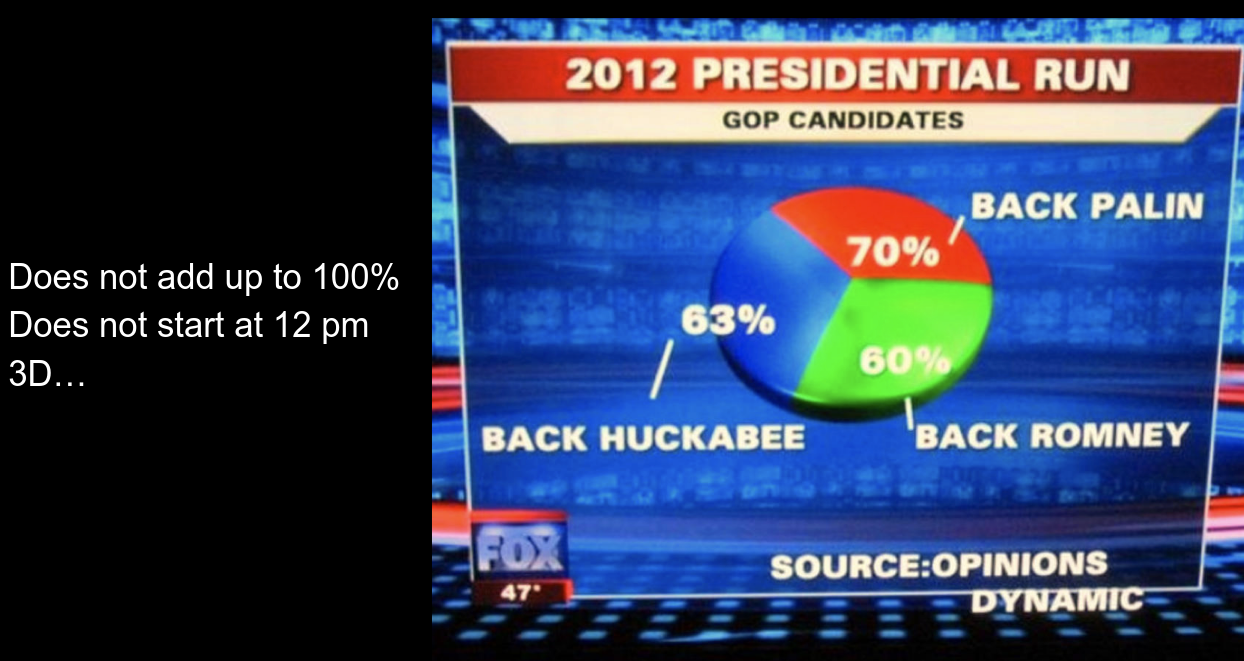
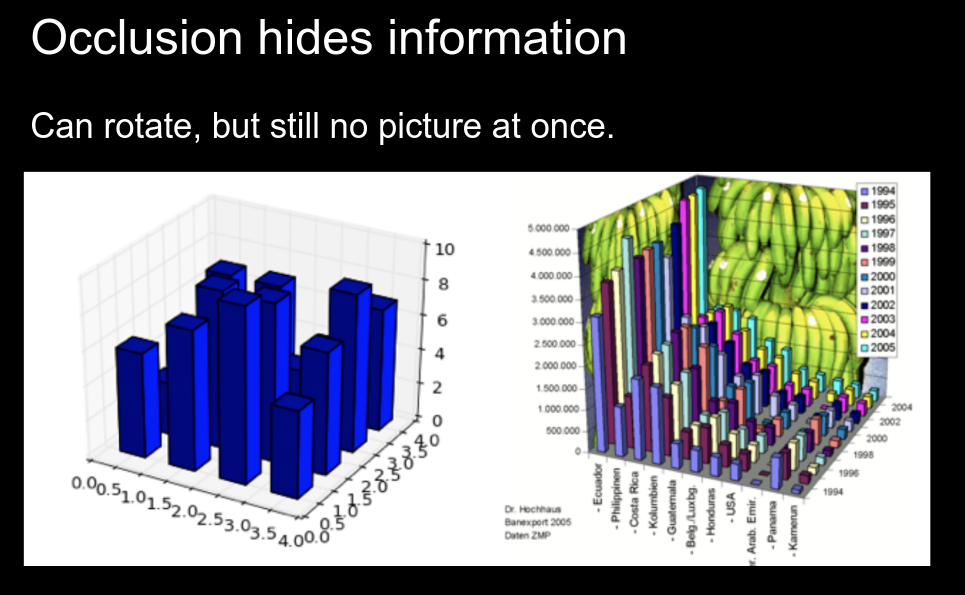
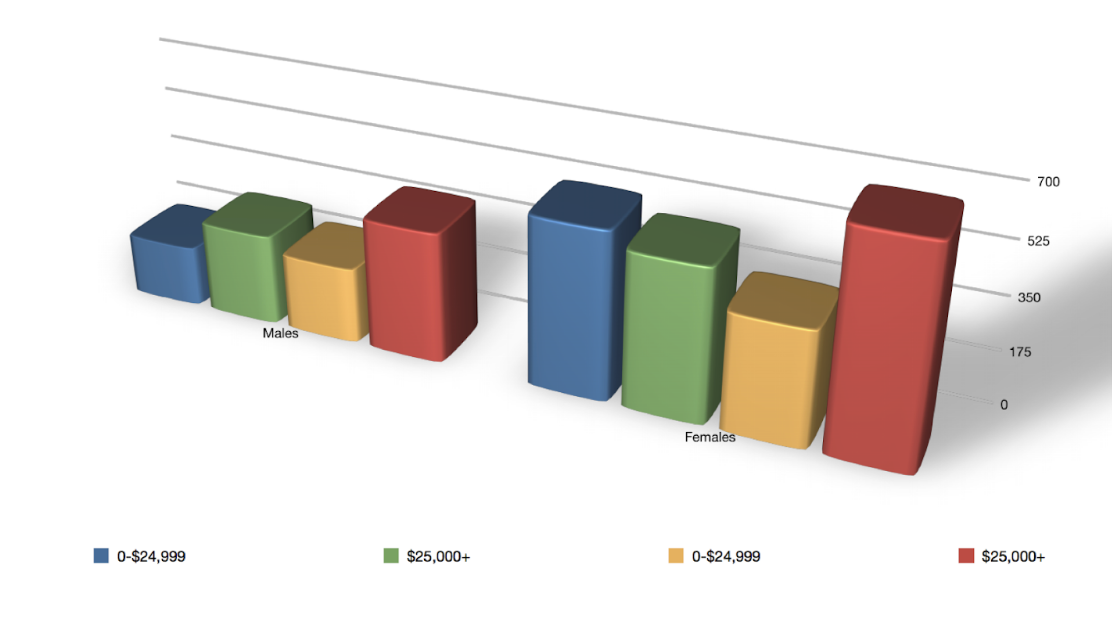
3D plots can lead to occlusion and confusion
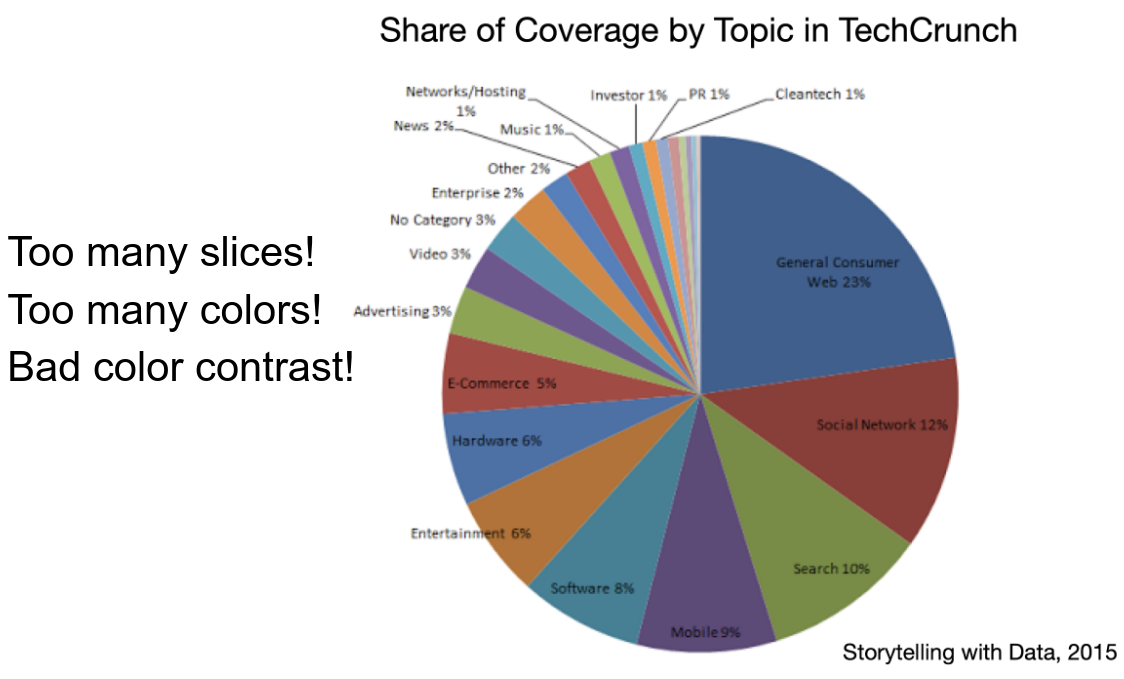
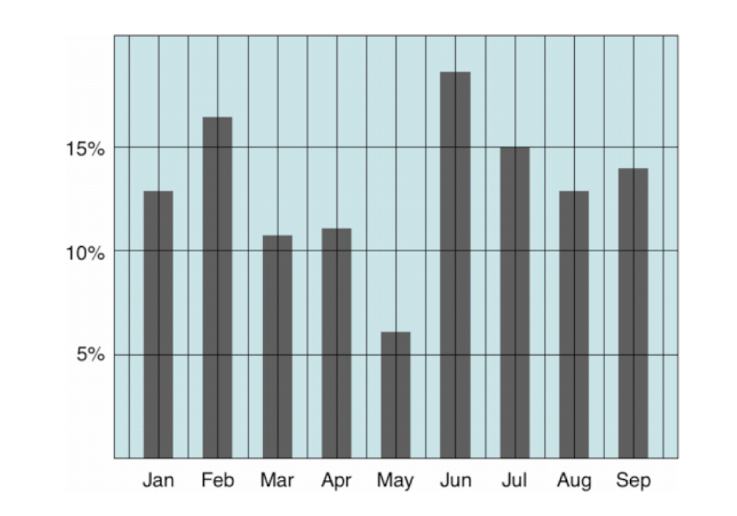
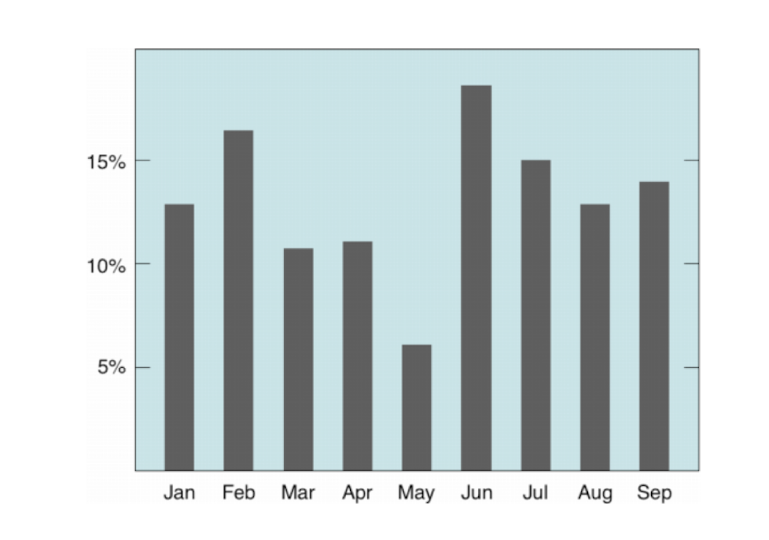
and these are ugly colors!!
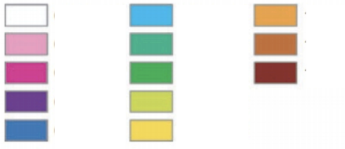
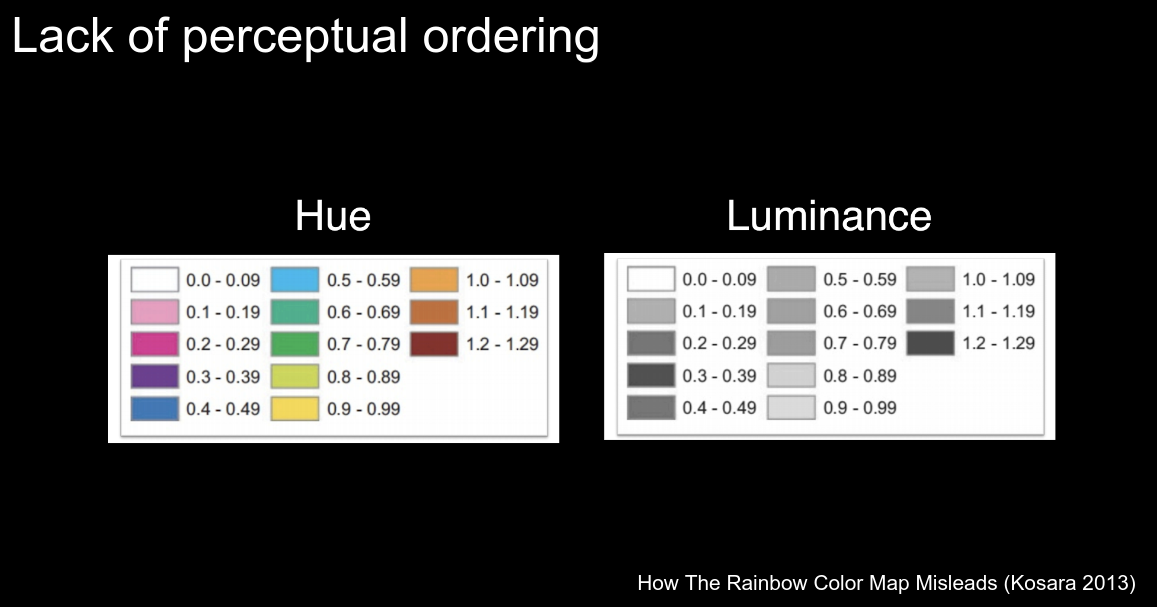
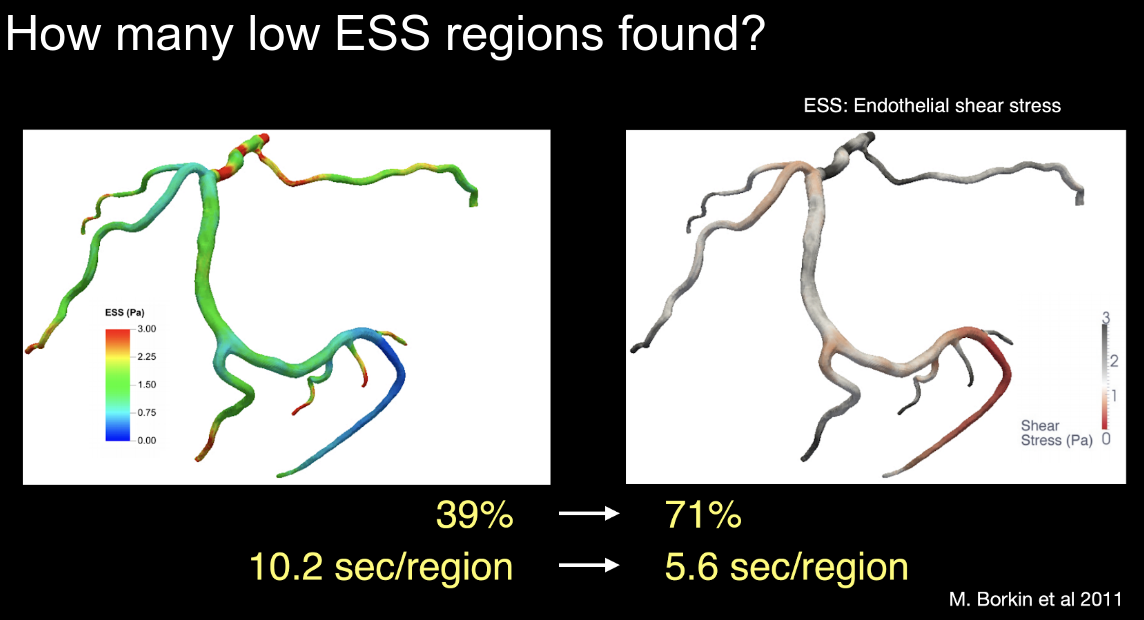
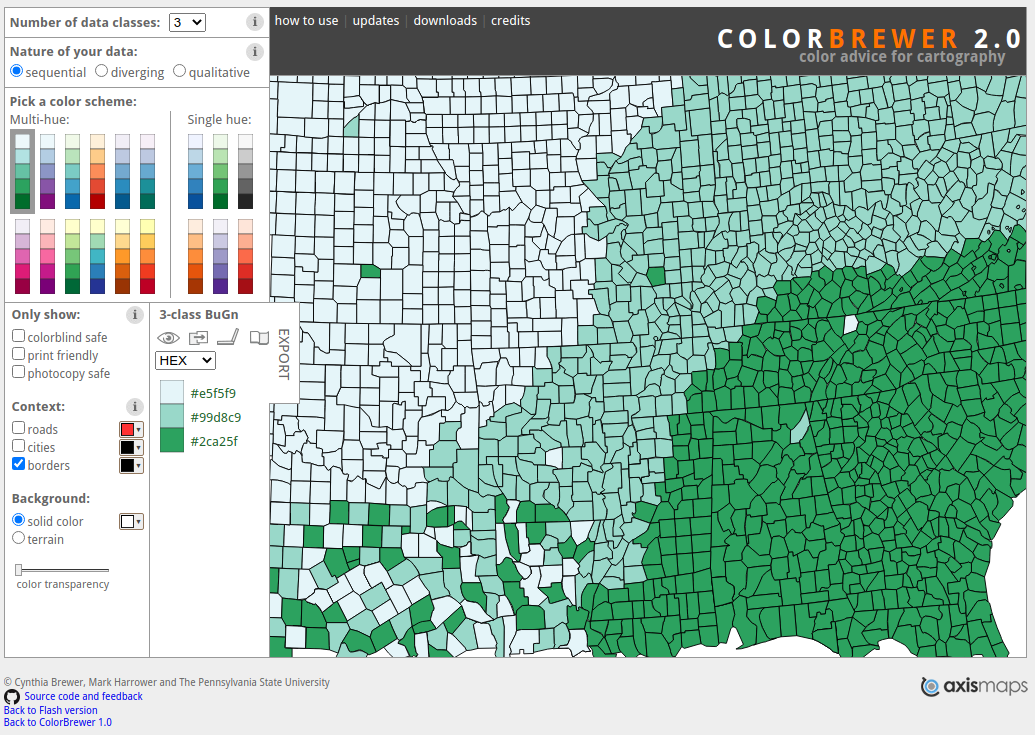
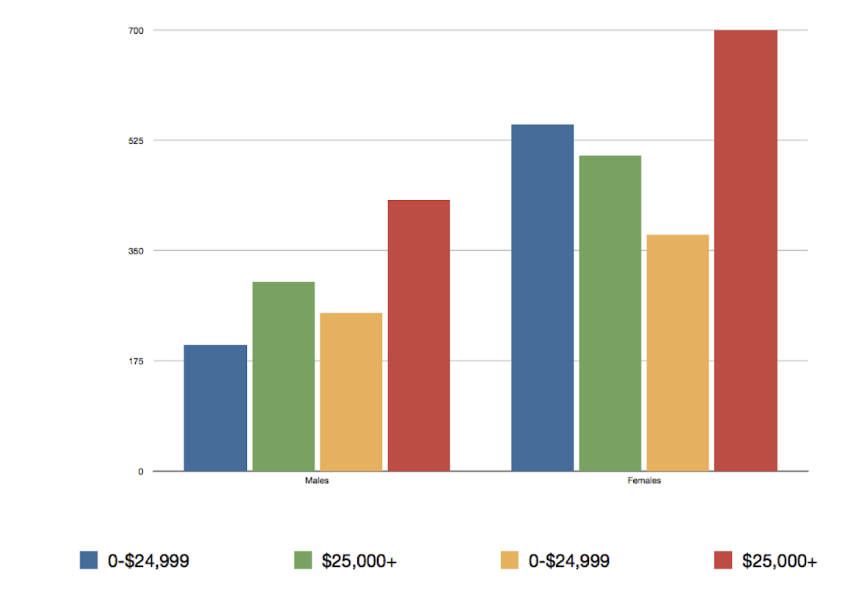
Colors!

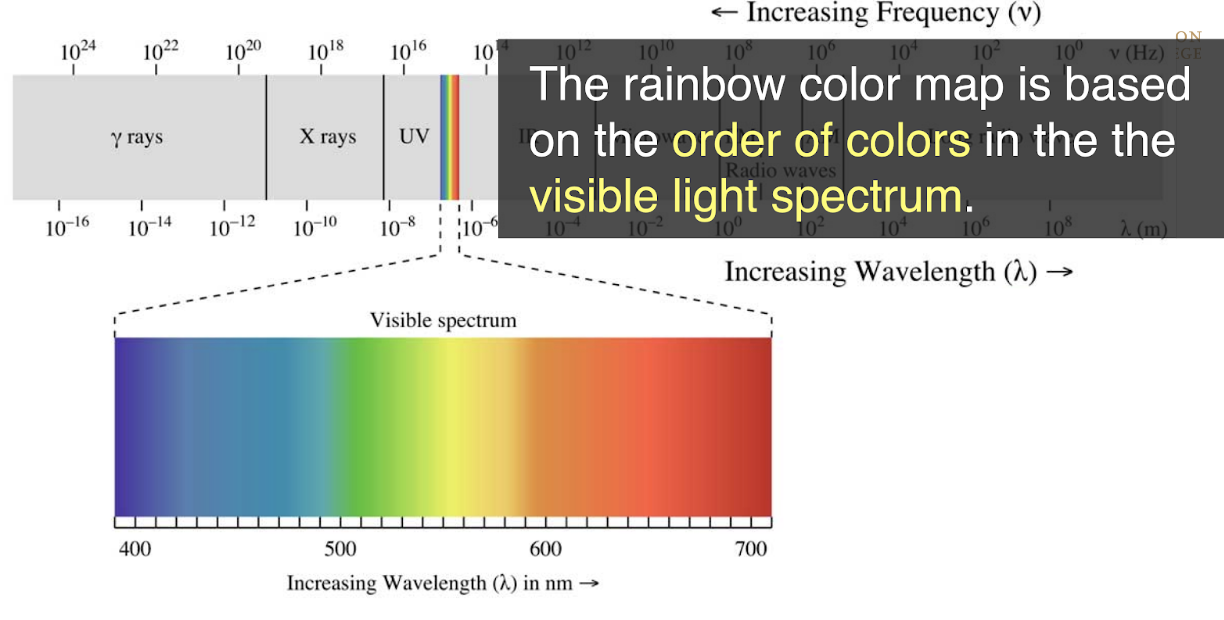
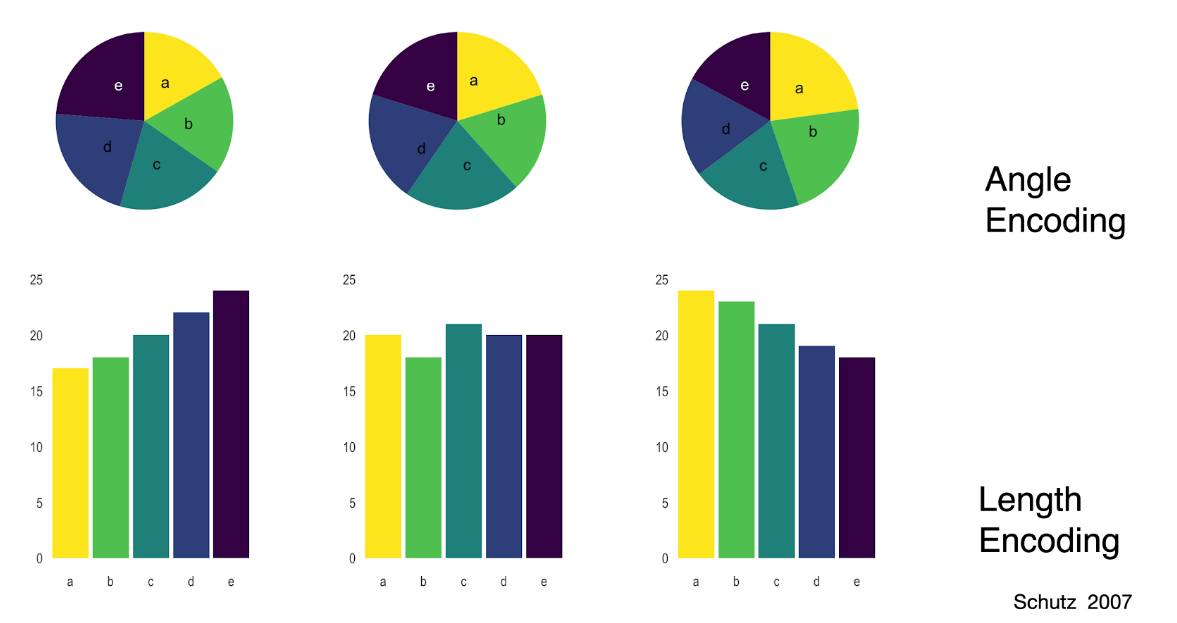
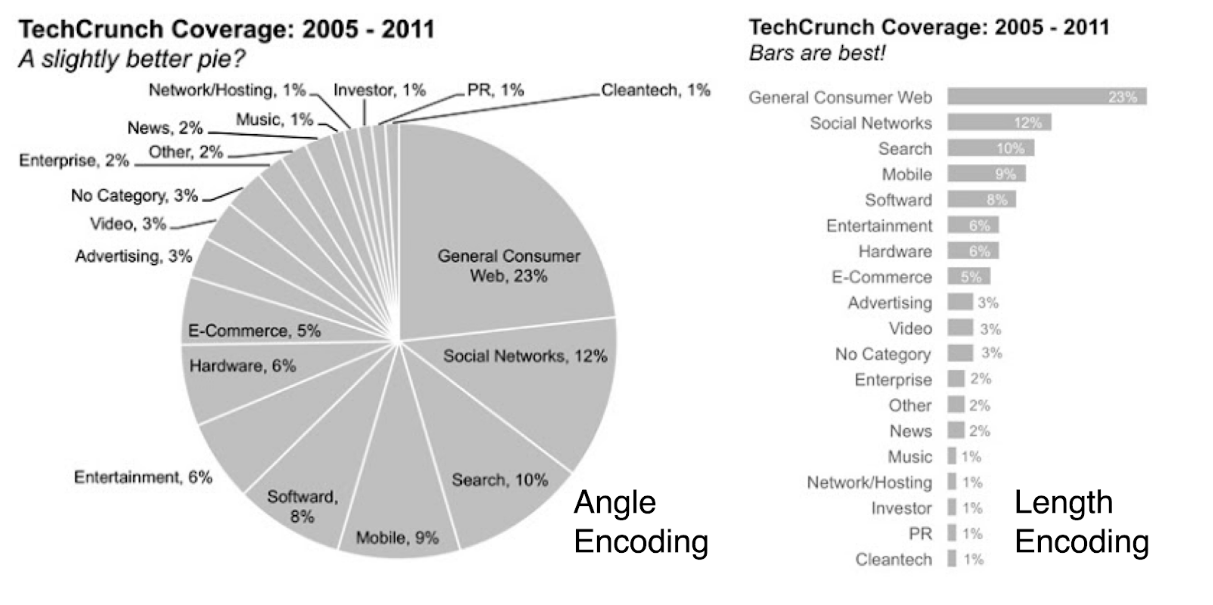
Can you tell which color represents higher or lower values?


Thank you!
We should have a visualization course at UMass Boston!