Visualizing Geographic Data
with geofacet
Hafen Consulting, LLC
@hafenstats
Ryan Hafen
Example
> state_unemp
# A tibble: 867 x 3
    year  rate state
   <int> <dbl> <chr>
 1  2000   4.6 AL
 2  2001   6   AL
 3  2002   5.8 AL
 4  2003   6   AL
 5  2004   5.2 AL
 6  2005   4.2 AL
 7  2006   3.9 AL
 8  2007   4.4 AL
 9  2008   8.3 AL
10  2009  11.8 AL
# … with 857 more rows
How does unemployment vary geographically and over time?
US annual unemployment rates by state from 2000 to 2016

Choropleth of 2016 Unemployment
- Small regions are hard to see (can you see DC?)
- Color isn't ideal for making judgements of magnitude of difference
- Can't see over time
"statebin" of 2016 Unemployment

Small regions are hard to see (can you see DC?)- Color isn't ideal for making judgements of magnitude of difference
- Can't see over time
Faceting by state
- Difficult to make judgements about geographic similarities / differences

ggplot(state_unemp, aes(year, rate)) +
  geom_line() +
  facet_wrap(~ state)

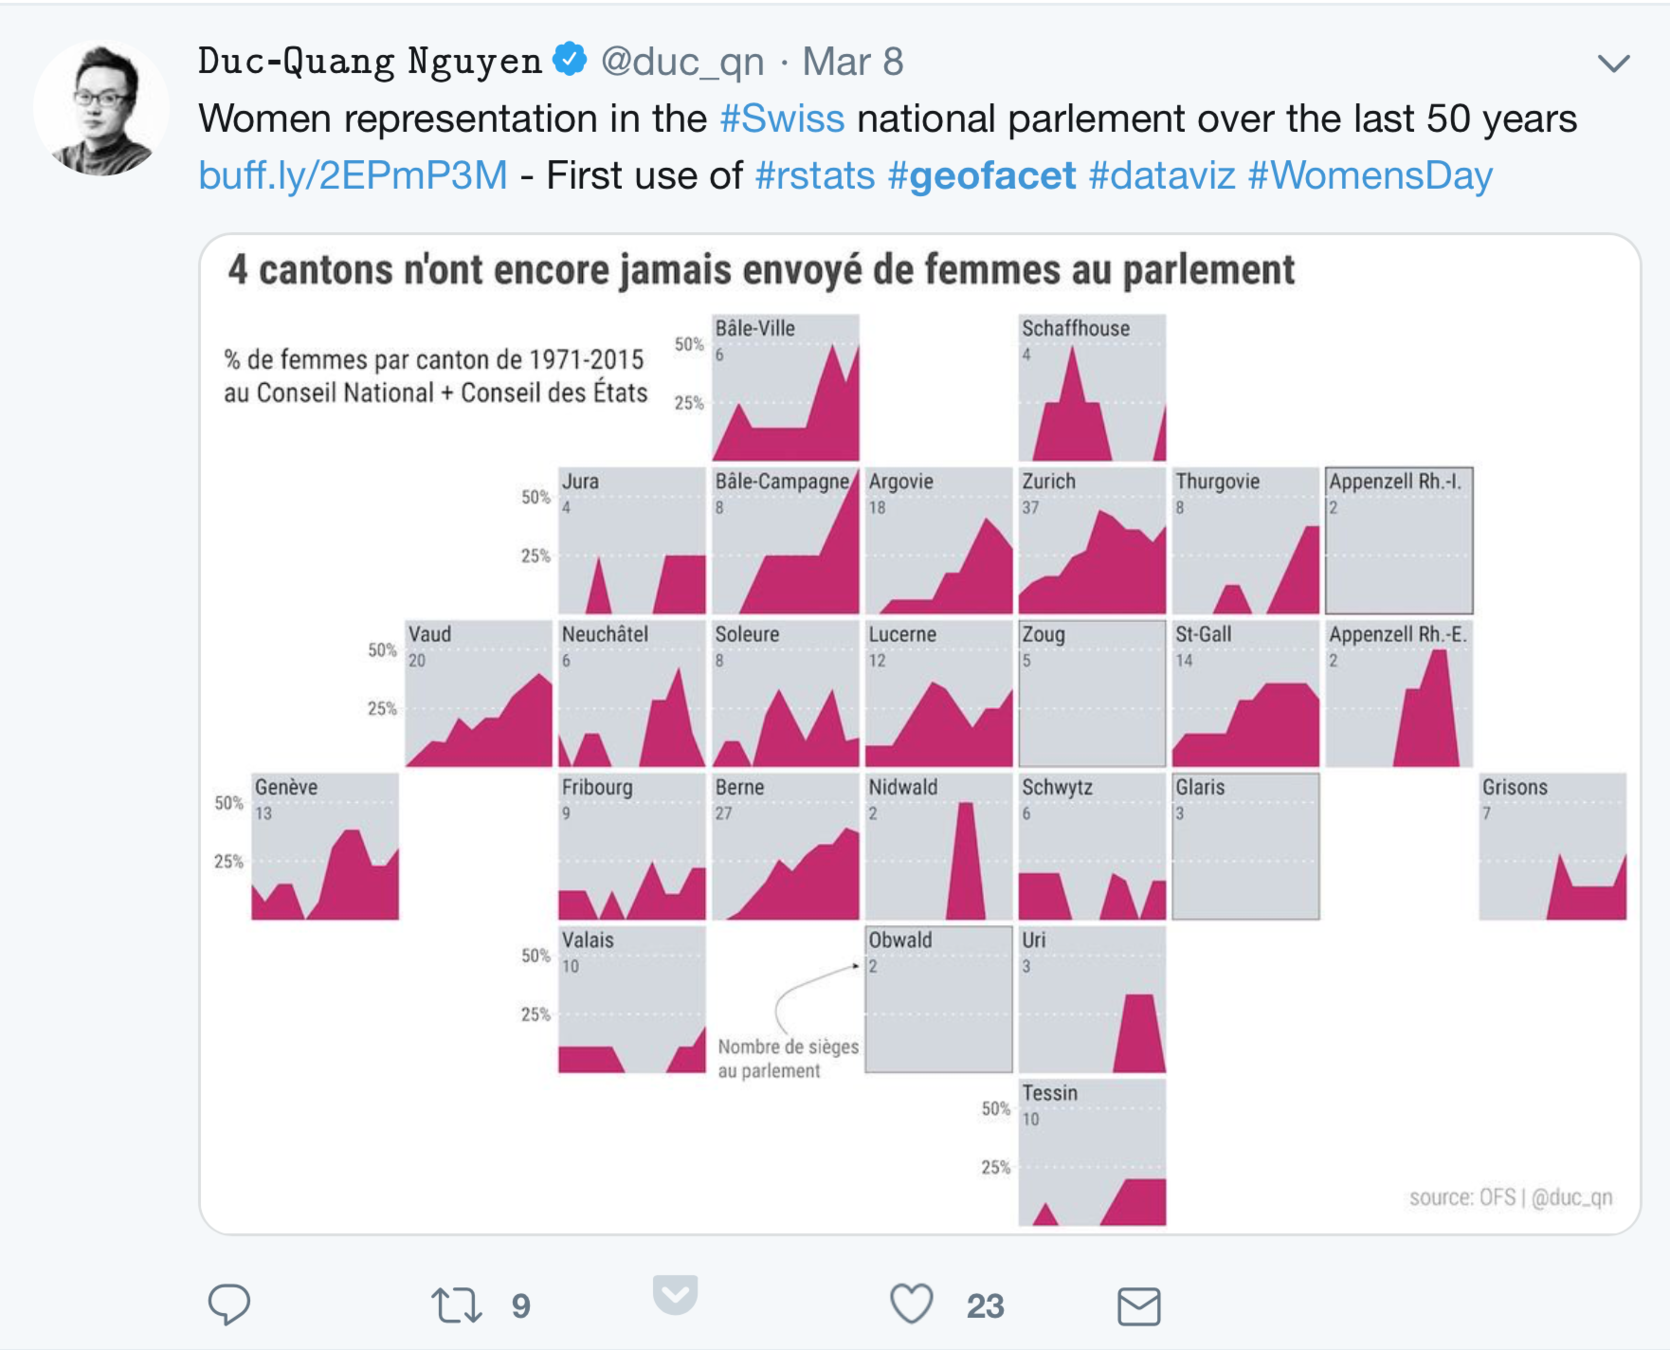
What if we try to rearrange the panels to mimic the general layout of the states?
install.packages("geofacet")
library(geofacet)
This is very easy to do with geofacet
+
Geofaceting by state
ggplot(state_unemp, aes(year, rate)) +
  geom_line() +
  facet_geo(~ state, grid = "us_state_grid1")


Creating Your Own Grids
- grid_auto() can take a shape file and provide a first pass at a grid layout that resembles the underlying geography
- grid_design() provides an interactive interface to tweak a grid layout provided by grid_auto(), or allows you to start from scratch
install.packages("USAboundaries")

# get Washington county boundaries from USAboundaries package
counties <- USAboundaries::us_counties(states = "washington")

# convert to SpatialPolygonsDataFrame
counties <- as(counties, "Spatial")

# remove unneeded columns
counties@data <- counties@data[, c("countyfp", "name")]

# this gives counties good initial approximation
grd <- grid_auto(counties, seed = 1234)
Example: Counties in Washington
grid_preview(grd, label = "name_name")
Example: Counties in Washington

grid_design(grd, label = "name")
A Collection of Grids
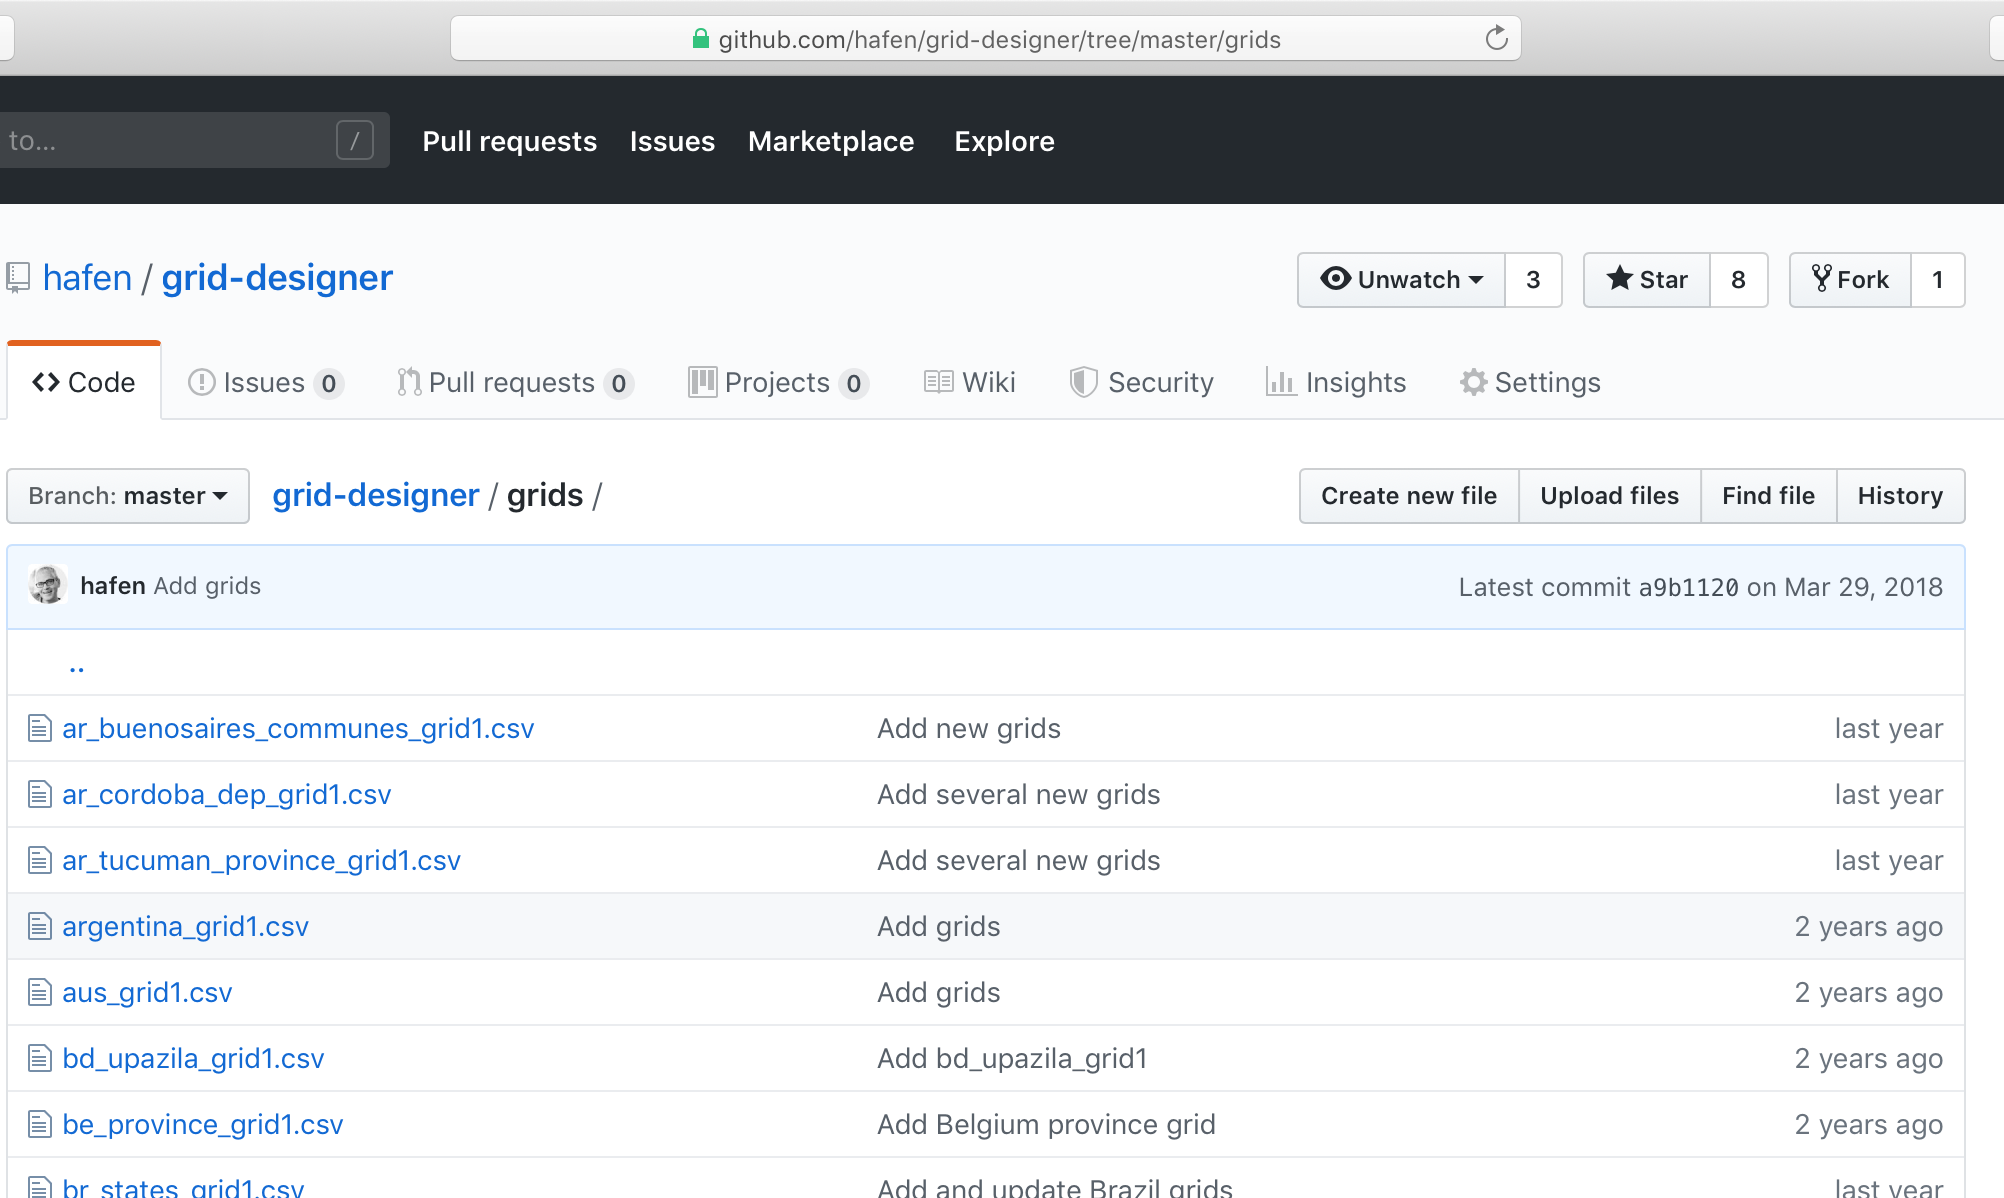
And More to Come...

(I need some help)
For More Information
- Twitter: @hafenstats
- Blog: http://ryanhafen.com/blog
- Documentation: https://hafen.github.io/geofacet/
- Github: https://github.com/hafen/geofacet
- These slides: https://slides.com/hafen/geofacet-cascadia