Monitoring iRODS with Nagios
September 26, 2016
Justin James
jjames@renci.org
iRODS Application Engineer


Introduction
- Nagios is an open source application that monitors network services, host resources, and hardware.
- Nagios has an inheritance based configuration scheme that is easily extendable and flexible.
- Nagios users can use plugins created by the Nagios team or create plugins themselves.


Our Use Cases
We will use Nagios to monitor iRODS servers in the following ways:
- Ping nagios resources to determine if they are up. If a resource status change is detected, mark the resc_status in the datbase as "up" or "down".
- Monitor resource use and warn when resource usage exceeds thresholds which are derived as a percentage of the max_bytes setting in the resource context.
- Monitor connection count on iRODS servers. This is information only and will not generated warnings or errors.

Sample Setup
The configuration files in this slide deck are based on the following iRODS grid setup.
One iCAT enabled server and two resource servers:
- ICAT.example.org – 192.168.1.150
- Resource1.example.org – 192.168.1.151
- Resource2.example.org – 192.168.1.152
Two iRODS resources:
- Resource1Resource - on Resource1.example.org
- Resource2Resource - on Resource2.example.org


iping Command
We will create our own custom iping command to determine if a resource server is up or down.
The iping does an rcConnect() call and determines the resource servers status by the return value of this method.
The iping source code can be found at:
https://github.com/irods/contrib/blob/master/iping/src/iping.cpp


Building and Installing the iping Command
Perform the following steps to build and install the iping command:

$ export PATH=/opt/irods-externals/cmake3.5.2-0/bin:$PATH
$ cd ~
$ git clone https://github.com/irods/contrib
$ mkdir ipingbuild
$ cd ipingbuild
$ cmake ~/contrib/iping
$ make package
$ sudo dpkg -i irods-iping_4.2.0~trusty_amd64.deb
Testing the iping Command
The iping command has now been installed in the system.
Test the iping command:
$ iping -h Resource1.example.org
OK : connection to iRODS server successful
$ iping -h Resource2.example.org
OK : connection to iRODS server successful
$ echo $?
0
Bring down a Resource1.example.org and test iping again:
$ iping -h Resource1.example.org -p 1247
ERROR: _rcConnect: connectToRhost error, server on Resource1.example.org:1247 is probably down status = -305111 USER_SOCK_CONNECT_ERR, Connection refused
$ echo $?
2
Installing Nagios
Nagios and the Nagios plugins packages can be installed with the following command:
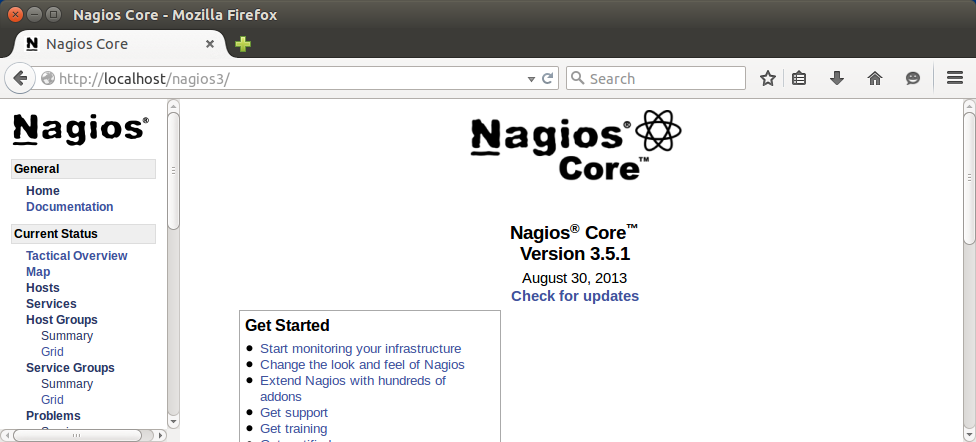
sudo apt install nagios3 nagios-nrpe-pluginAfter installation test that Nagios is up by going to http://localhost/nagios3 and logging in with the nagiosadmin user account. Use the password that was set during Nagios installation.

Ping iRODS Resource
The first Nagios service that we will create is a ping service to determine the status of resource servers.
- This service will rely on the iping command that was created and installed earlier.
- If a status change is detected, the resc_status in the database will be update to reflect the current status.
- This resc_status is used when resolving which resource to read from when the resource is in a replication hierarchy.

Ping iRODS Resource
Steps to build and test the resource ping service:
- Allow the Nagios user to login to iRODS under an administrator account.
- Update the Nagios configuration to define the hosts, commands, and services.
- Create scripts for the commands that will be used to monitor the resources and update the resc_status.
- Test the service using the Nagios web monitoring tool.

Ping iRODS Resource - Allowing nagios user login access
The nagios user on the local filesystem needs to be able to connect to iRODS using an administrator account.
- Switch user to the nagios user.
- May have to update /etc/passwd to give nagios a home directory and allow bash to be the default shell. Example /etc/passwd entry:
nagios:x:119:128::/var/lib/nagios:/bin/bash
- May have to update /etc/passwd to give nagios a home directory and allow bash to be the default shell. Example /etc/passwd entry:
- Perform iinit. When prompted for username and password, provide the information for an iRODS administrator account.

Ping iRODS Resource - Configuration
Create a directory to hold our configuration file and update nagios.cfg to look for configuration files in this directory:
$ mkdir -p /etc/nagios3/irods
$ echo "cfg_dir=/etc/nagios3/irods" >> /etc/nagios3/nagios.cfg
Create /etc/nagios/irods/irods.cfg
define host {
    name             irods-server-template
    use              generic-host
    check_interval   1
    register         0
}

define host {
    use              irods-server-template
    host_name        Resource1
    alias            Resource1Resource
    address          Resource1.example.org
}

define host {
    use              irods-server-template
    host_name        Resource2
    alias            Resource2Resource
    address          Resource2.example.org
}

Ping iRODS Resource - Configuration
define hostgroup{
    hostgroup_name   irods-resource-servers
    alias            iRODS Servers
    members          Resource1,Resource2
}

define command{
    command_name     iping-irods-server
    command_line     /usr/lib/nagios/plugins/iping.sh -h $HOSTADDRESS$ -p $ARG1$
}

define command {
    command_name     update-irods-resource-state
    command_line     /usr/lib/nagios/plugins/update_irods_resc_state.sh $HOSTADDRESS$ $SERVICESTATE$ $SERVICESTATETYPE$ $SERVICEATTEMPT$
}

define service {
    use                     generic-service
    hostgroups              irods-resource-servers
    service_description     IPING
    check_command           iping-irods-server!1247
    check_interval          1
    event_handler           update-irods-resource-state
}
/etc/nagios/irods/irods.cfg (cont)

Ping iRODS Resource - Configuration
Explanation:
- Creates a template for all iRODS servers (irods-server-template)
- Derived from generic-host
- check_interval of 1 means every minute
- register 0 means it is only a template
- Defines the hosts
- Derived form the irods-server-template
- alias is the name of the resource on the host
- address is the FQDN on the host

Ping iRODS Resource - Configuration
Explanation (cont):
- Defines a hostgroup (irods-resource-servers) that includes the two hosts.
- Defines a command (iping-irods-server) which executes the iping.sh script (yet to be created).
- Defines a command (update-irods-resource-state) which executes the update_irods_resource_state.sh script (yet to be created).
- Defines a service (IPING)
- Executes the iping-irods-server command every second
- Sends 1247 (iRODS listen port) as $ARG1$
- Executes update-irods-resource-state command on status changes.

Ping iRODS Resource - Scripts
Next create the bash scripts for iping.sh and update_irods_resc_state.sh
- /usr/lib/nagios/plugins/iping.sh
- Wrapper for the iping command.
- Returns 2 on error and 0 on success.
- /usr/lib/nagios/plugins/update_irods_resc_state.sh
- Accepts HOST as first argument
- Accepts SERVICE_STATE as second argument
- Performs an iquest query to get the resource name(s) for the host.
- For OK (0) response, uses iadmin modresc to set the status to "up".
- For CRITICAL (2) response, uses iadmin modresc to set the status to "down".

Ping iRODS Resource - Scripts
/usr/lib/nagios/plugins/iping.sh
#!/bin/bash

export HOME=/var/lib/nagios

return=0
/usr/bin/iping "$@" 2>&1 || return=$?

if [ $return -gt 3 ]; then
   exit 2
else
   exit $return
fi

Ping iRODS Resource - Scripts
/usr/lib/nagios/plugins/update_irods_resc_state.sh
#/bin/bash

export HOME=/var/lib/nagios

LOGFILE=/tmp/update_resc.log

echo update_irods_resc_state.sh "$@" >> $LOGFILE

HOST=$1
SERVICE_STATE=$2
SERVICE_STATE_TYPE=$3
SERVICE_ATTEMPT=$4

RESOURCES=$(iquest "%s" "select RESC_NAME where RESC_LOC = '$HOST'")

echo RESOURCES = $RESOURCES >> $LOGFILE
echo SERVICES_STATE = $SERVICE_STATE >> $LOGFILE


case "$SERVICE_STATE" in
OK)
    for RESOURCE in $RESOURCES; do
        iadmin modresc $RESOURCE status up
    done
    ;;
WARNING)
    ;;
UNKNOWN)
    ;;
CRITICAL)
    for RESOURCE in $RESOURCES; do
        iadmin modresc $RESOURCE status down
    done
    ;;

esac
exit 0
Ping iRODS Resource - Testing
- Restart Nagios
sudo service nagios3 restart- Bring Down a Resource.
- Shut the server down; or
- Stop the iRODS service (./irodsctl stop)
- After waiting a minute, check the resource status
$ iadmin lr Resource1Resource | grep resc_status
resc_status: down
- Bring Up the Resource
- After waiting a minute, check the resource status
$ iadmin lr Resource1Resource | grep resc_status
resc_status: up

Ping iRODS Resource - Testing
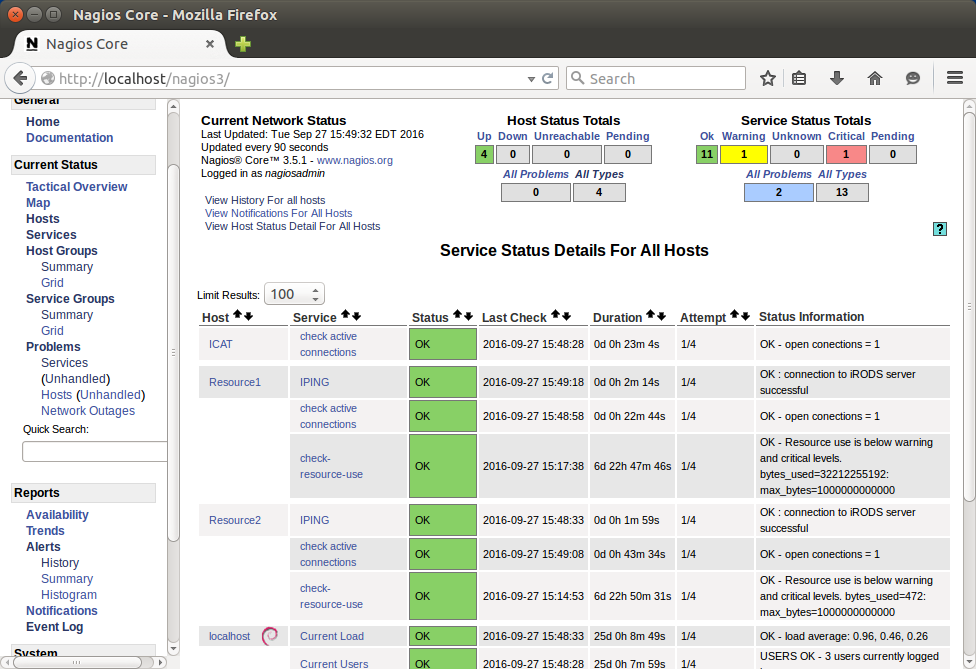
- Check the services on the Nagios monitoring tool. Click "Services"


Ping iRODS Resource - Testing
- Check the services on the Nagios monitoring tool. Click "Services"


Ping iRODS Resource - Use in Replication Resc Hierarchy
- Create a replication resource and place our two resources under it.
$ iadmin mkresc RootResource replication
Creating resource:
Name:       "RootResource"
Type:       "replication"
Host:       ""
Path:       ""
Context:    ""
$ iadmin addchildtoresc RootResource Resource1Resource
$ iadmin addchildtoresc RootResource Resource2Resource
$ ilsresc
demoResc
RootResource:replication
├── Resource1Resource
└── Resource2Resource- With both resources up put a file into iRODS
$ echo test > test.txt
$ iput -R RootResource test.txt
$ ils -l test.txt
  rods              0 RootResource;Resource1Resource            5 2016-09-09.10:24 & test.txt
  rods              1 RootResource;Resource2Resource            5 2016-09-09.10:24 & test.txt
Ping iRODS Resource - Use in Replication Resc Hierarchy
-
Bring Resource1Resource down and quickly try to get test.txt.
- Since Resource1Resource is the lowest replica number, iRODS will attempt to read test.txt from this resource.
- If Resource1Resource is still marked as up this will fail.
- Wait a minute and attempt to get test.txt again.
$ iget test.txt -
test
$ iget test.txt -
ERROR: getUtil: get error for - status = -305111 USER_SOCK_CONNECT_ERR, Connection refused

Monitoring Resource Use
The next Nagios service that we will create is a service to monitor the resource use.
- Determines the number of bytes the resource is using
- Produces a WARNING if the bytes are above threshold1.
- Produces an ERROR if the bytes are above threshold1.

Monitoring Resource Use - Update Resource Context
- Update the resource context with the max_bytes.
- For testing this is set to an arbitrarily small number (500 bytes)
- For testing this is set to an arbitrarily small number (500 bytes)
$ iadmin modresc context Resource1Resource "max_bytes=500"
$ iadmin modresc context Resource2Resource "max_bytes=500"
Monitoring Resource Use - Configuration
- Create a service to monitor the bytes. Append the following to /etc/nagios/irods/irods.cfg:
define command {
        command_name  check-resource-use
        command_line /usr/lib/nagios/plugins/check_resource_use.sh $HOSTALIAS$ $ARG1$ $ARG2$
}

define service {
        use                     generic-service
        hostgroups              irods-resource-servers
        service_description     check-resource-use
        check_command           check-resource-use!90.0!95.0
        check_interval          1
}
Monitoring Resource Use - Configuration
Configuration Explanation:
- Command named check-resource-use created.
- This command executes check_resource_use.sh script.
- This command executes check_resource_use.sh script.
- New service created.
- Service calls check-resource-use command.
- Service runs against all hosts in the hostgroup irods-resource-servers.
- Sends 90.0 as $ARG1$. This is the WARNING threshold percentage.
- Sends 95.0 as $ARG2$. This is the CRITICAL threshold percentage.
- The $HOSTALIAS$ is the resource name.

Monitoring Resource Use - Script
Create bash script for check_resource_use.sh.
- Performs an "iquest" command to get the context string for the resource and parses the max_bytes value from this context.
- Performs another "iquest" command to get the total number of bytes used by the resource.
- Calculates the percentage of use.
- Returns CRITICAL (2) if the percentage of bytes used is greater than the critical threshold.
- Returns WARNING (1) if the percentage of bytes used is greater than the warning threshold.
- Returns OK (0) if the percentage is less than or equal to the warning threshold.

Monitoring Resource Use - Script
/usr/lib/nagios/plugins/check_resource_use.sh
#!/bin/bash

export HOME=/var/lib/nagios

STATE_OK=0
STATE_WARNING=1
STATE_CRITICAL=2
STATE_UNKNOWN=3

if [ $# -lt 3 ]; then
    echo "Use: check_resource_use.sh   "
    exit $STATE_UNKNOWN
fi

max_bytes=0
percent_used=0

warning_level=$2
critical_level=$3

if ! [[ $warning_level =~ ^[0-9]+([.][0-9]+)?$ ]]; then
    echo "Warning level provided is not a valid number."
    exit $STATE_UNKNOWN
fi

if ! [[ $critical_level =~ ^[0-9]+([.][0-9]+)?$ ]]; then
    echo "Critical level provided is not a valid number."
    exit $STATE_UNKNOWN
fi
Monitoring Resource Use - Script
/usr/lib/nagios/plugins/check_resource_use.sh (cont)
context=$(iquest "%s" "select RESC_CONTEXT where RESC_NAME = '$1'")

for i in $(echo $context | tr ";" "\n"); do
    [[ $i =~ "max_bytes=" ]] && max_bytes=$(echo $i | cut -b11-)
done

used=$(iquest "%s" "select sum(DATA_SIZE) where RESC_NAME = '$1'")
if [ -z $used ]; then
    used=0
fi

if [[ $max_bytes -gt 0 && $used -gt 0 ]]; then
    percent_used=$(echo "scale=2; ($used / $max_bytes) * 100.0" | bc)
fi

if [ $(echo "$percent_used > $critical_level" | bc -l) -eq "1" ]; then
    echo "CRITICAL - Resource use is above critical level.  byte_used=$used; \
          max_bytes=$max_bytes; critical_threshold=${critical_level}%"
    exit $STATE_CRITICAL
fi

if [ $(echo "$percent_used > $warning_level" | bc -l) -eq "1" ]; then
    echo "WARNING - Resource usage is above warning level.  byte_used=$used; \
          max_bytes=$max_bytes; warning_threshold=${warning_level}%"
    exit $STATE_WARNING
fi

echo "OK - Resource use is below warning and critical levels.  bytes_used=$used; \
      max_bytes=$max_bytes"
exit $STATE_OK
Monitoring Resource Use - Testing
- Restart Nagios to pick up the new configuration.
sudo service nagios3 restart- Check the monitoring tool ("Services") for Resource1 and Resource2. Note that the bytes used is listed.
- Add files so that the percentage of bytes used goes to to the WARNING and CRITICAL levels. Check the monitoring tool.

Monitoring Resource Use - Testing


Monitoring Connection Count
The next Nagios service that we will create is a service to monitor the connection count.
- Parses the output of the irods-grid command to get the number of active connections.
- This is informational only so it will always return an OK (0) status.

Monitoring Connection Count - Update irods_environment.json
- Because this script needs to run the irods-grid, a couple of entries need to be added to ~nagios/.irods/irods_environment.json
    "irods_server_control_plane_encryption_algorithm": "AES-256-CBC",
    "irods_server_control_plane_encryption_num_hash_rounds": 16,
    "irods_server_control_plane_key": "12345678901234567890123456789012",
"irods_server_control_plane_port": 1248- Use the same values that are stored in ~irods/.irods/irods_environment.json
- Perform an "iinit".

Monitoring Connection Count - Configuration
- Create a service to monitor the number of connections. Append the following to /etc/nagios/irods/irods.cfg:
define host {
        use             irods-server-template
        host_name       ICAT
        address         ICAT.example.org
}

define hostgroup {
        hostgroup_name          irods-servers
        alias                   iRODS Servers
        members                 ICAT,Resource1,Resource2
}

define command {
        command_name  check-active-connections
        command_line /usr/lib/nagios/plugins/check_agent_count.sh $HOSTADDRESS$
}

define service {
        use                     generic-service
        hostgroups              irods-servers
        service_description     check active connections
        check_command           check-active-connections
        check_interval          1
}
Monitoring Connection Count - Configuration
Configuration Exaplanation:
- New host created for ICAT.example.org.
- Hostgroup irods-servers created which includes both resource servers and the ICAT server.
- Command named check-active-connections created.
- This command executes the check_agent_count.sh script.
- Service created to execute the check-active-connections command.

Monitoring Connection Count - Script
Create bash script for check_agent_count.sh.
- Performs an "irods-grid" command.
- Sends the output of the "irods-grid" command to jq to parse the JSON output do determine the number of agents.
- Returns OK (0) with a string indicating the number of agents.
Note: jq can be downloaded on Ubuntu with “sudo apt-get install jq”.

Monitoring Connection Count - Script
/usr/lib/nagios/plugins/check_agent_count.sh
#!/bin/bash

export HOME=/var/lib/nagios

STATE_OK=0
STATE_UNKNOWN=3

if [ $# -lt 1 ]; then
    echo "Use: check_agent_count.sh "
    exit $STATE_UNKNOWN
fi

host_name=$1

agent_count=$(irods-grid --all status | jq ' .hosts[] |  .hostname + " " + "\(.agents[].agent_pid)"' | grep $host_name | wc -l)

echo "OK - open connections = $agent_count"
Monitoring Connection Count - Testing
Restart Nagios and try it out.
- Refresh the Nagios monitoring tool services page.
- By default all three servers should have a count of 1.
- Try running multiple iRODS commands in parallel (possibly large puts that take a long time) and wait for an update.
- As long as the processes are still running when the check is performed you should have a count greater than 1.

Monitoring Connection Count - Testing
