
Easy iRODS Metrics:
SQL Exporter, Prometheus, and Grafana
Terrell Russell, Ph.D.
Executive Director, iRODS Consortium
December 3, 2025
TRiRODS
Chapel Hill, NC
Overview
- iRODS and Timeseries Data
- A Dashboard
- Three Tools
- Capturing Transfers In and Out
- Next Steps

iRODS Policy-Based Data Management
iRODS has always been a programmable virtual filesystem, providing rule-based operations on data files stored on disparate physical storage systems, both local and remote.
It stores both:
- standard system metadata and
- additional arbitrary user-defined metadata
And this all lives in a relational database, available via SQL.
iRODS Timeseries
But...
iRODS does not provide historical information about "what used to be".
The way to know "what used to be", is to have asked, and to have saved it.
iRODS Timeseries
Best practice:
- Regularly query the database for 'metrics'
- Write them down
- Later, query the metrics, and draw some graphs
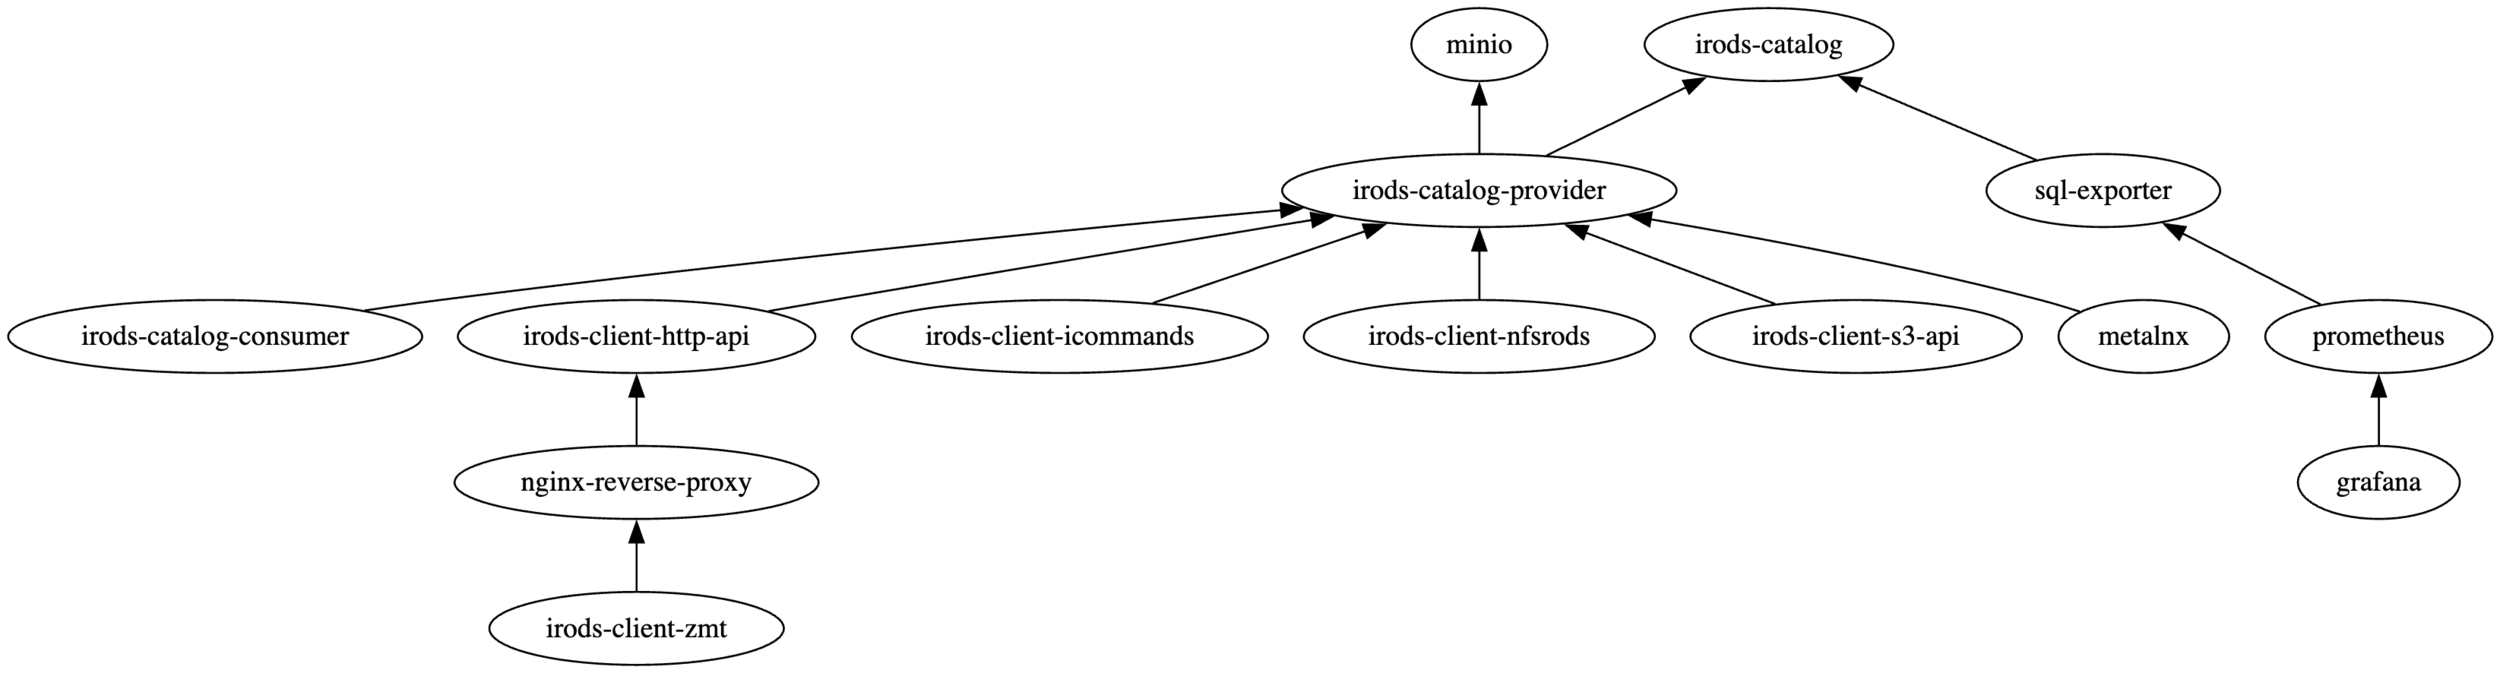
sql_exporter → prometheus → grafana
- https://github.com/burningalchemist/sql_exporter
- https://github.com/prometheus/prometheus
- https://github.com/grafana/grafana
iRODS Dashboarding
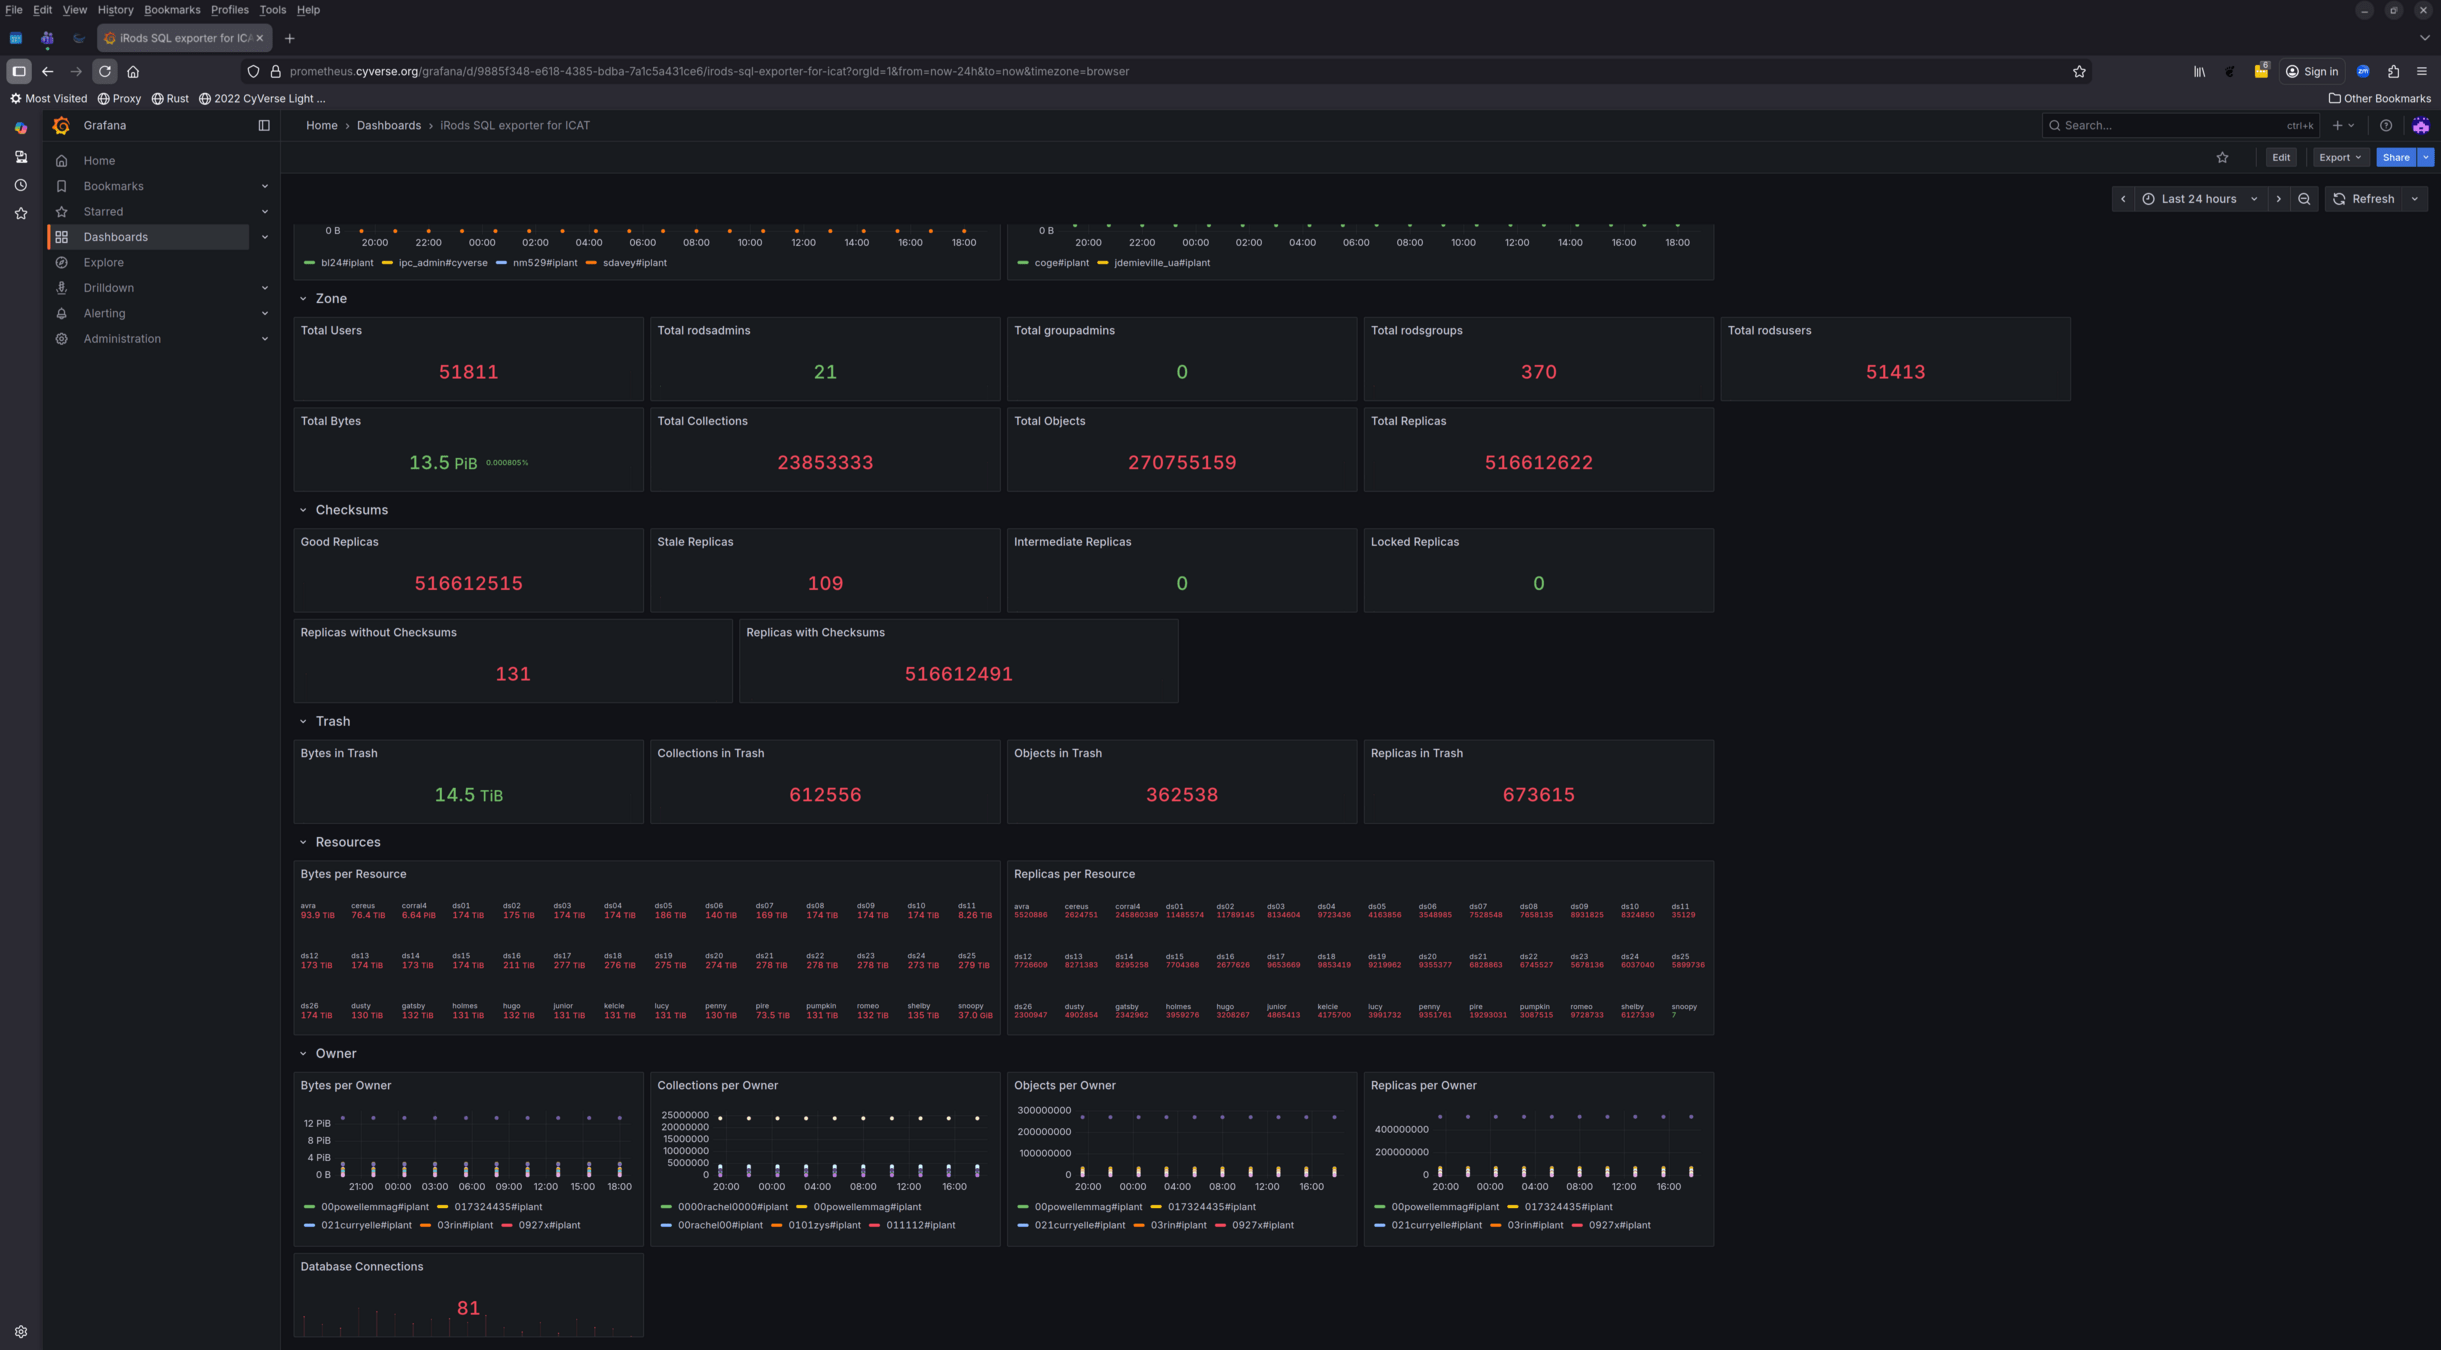
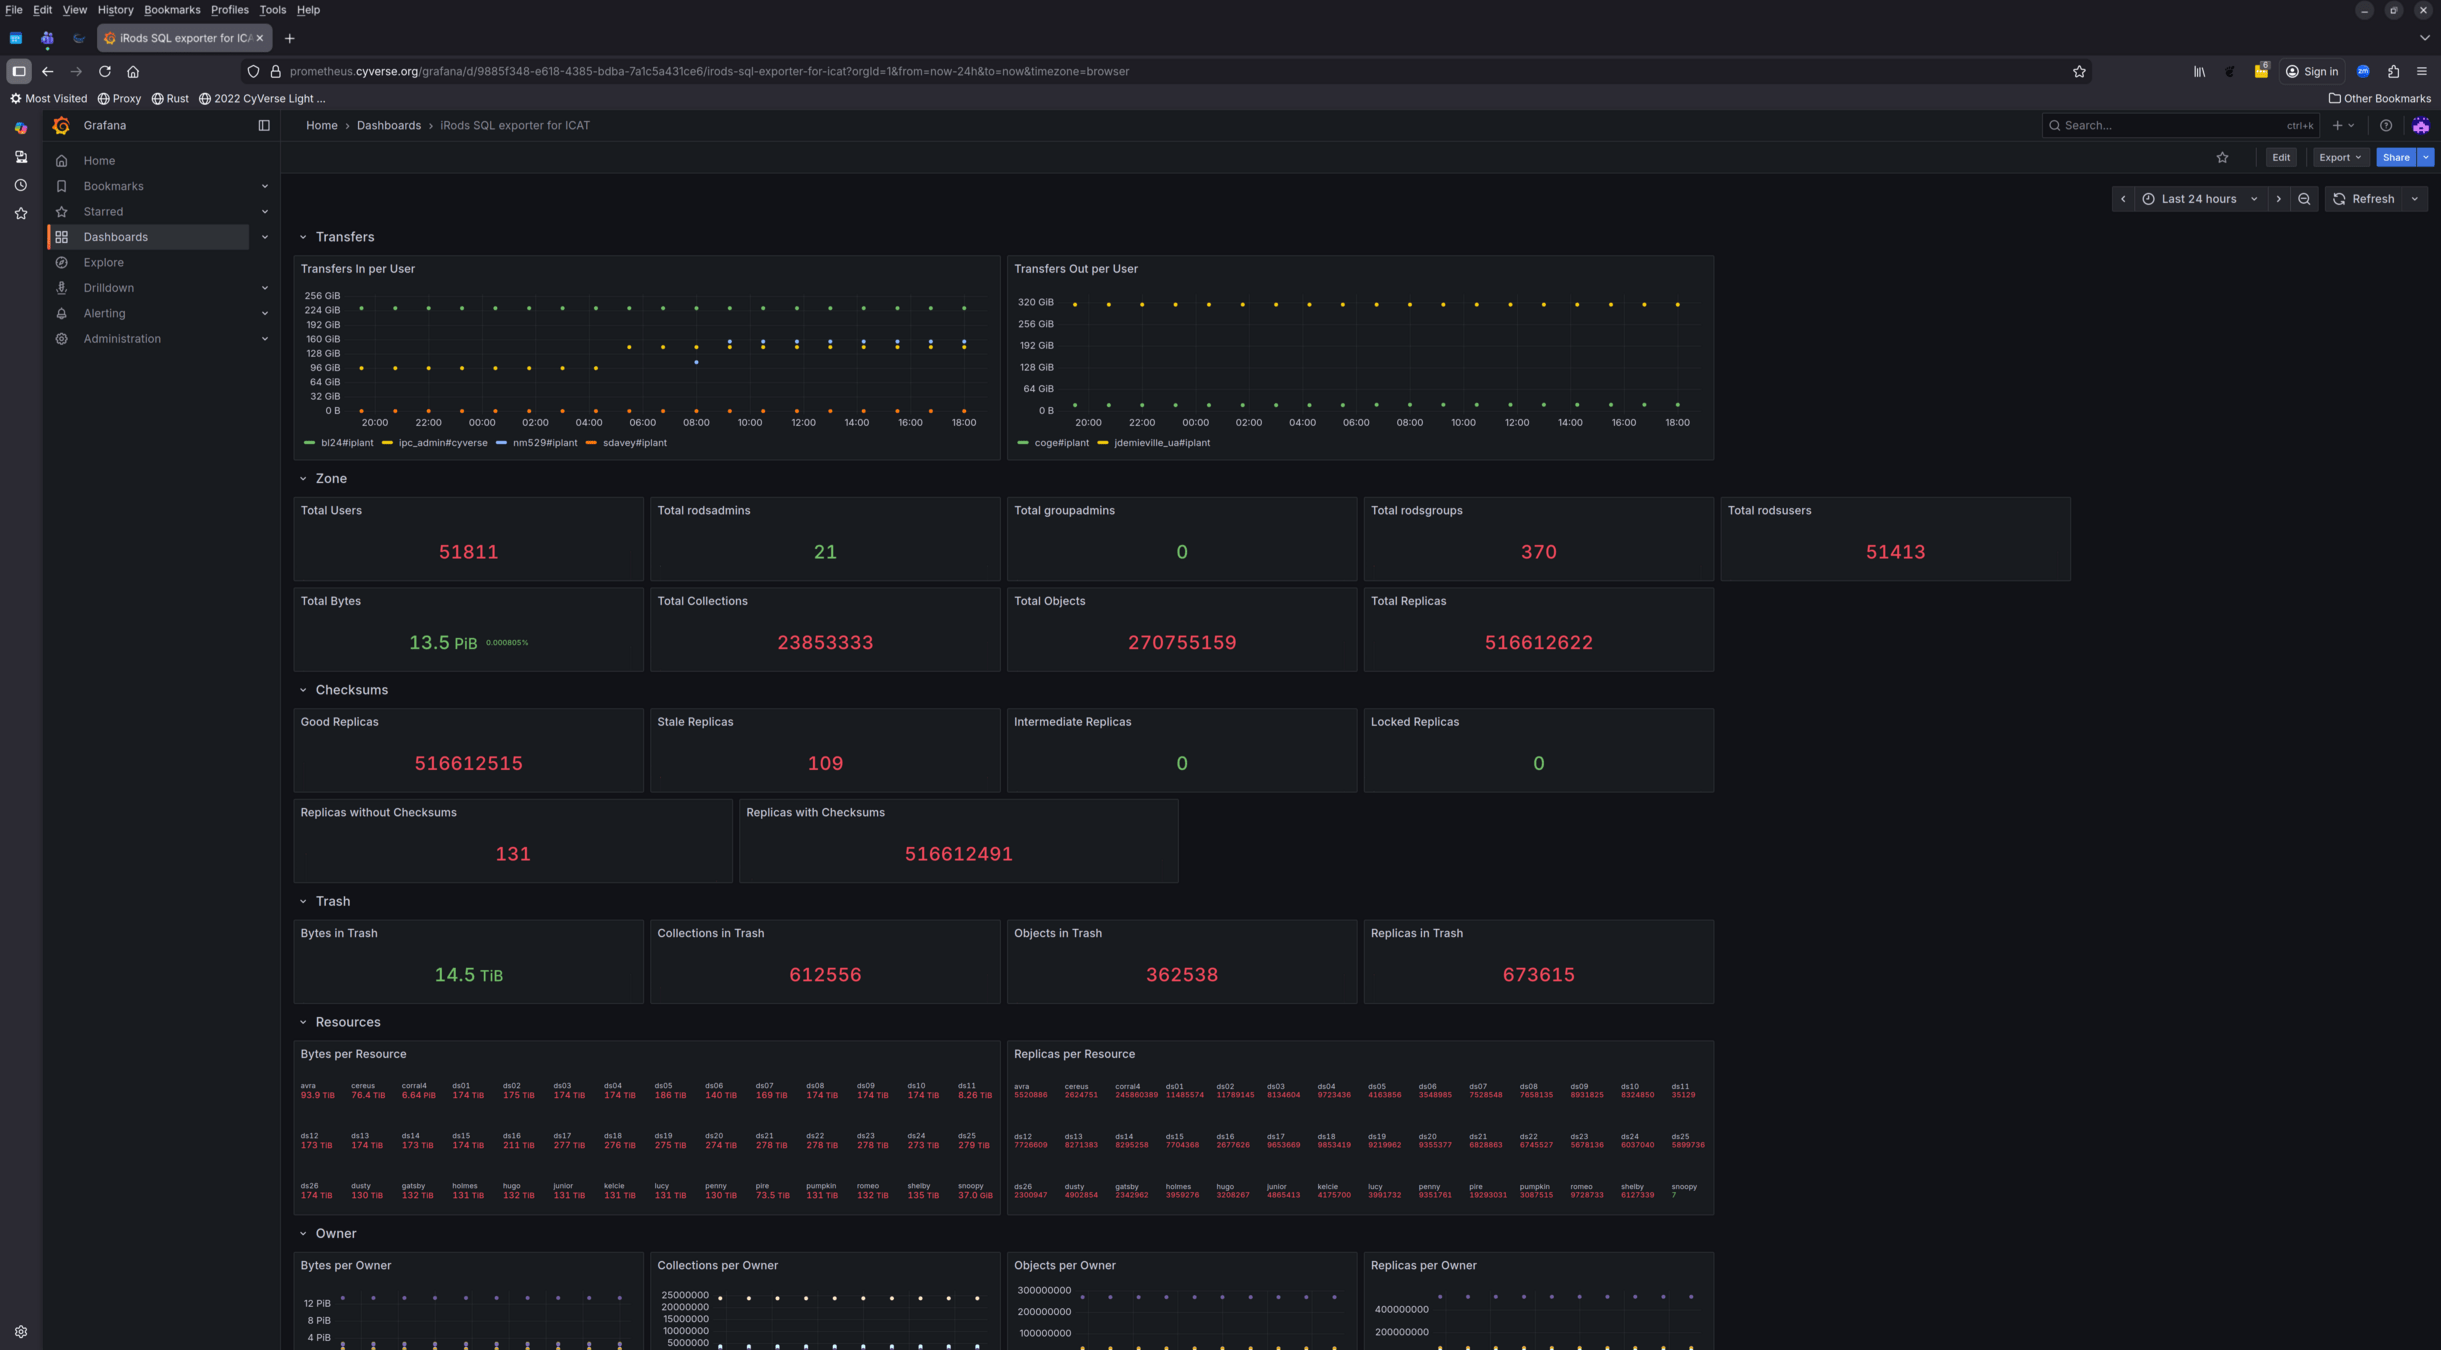
iRODS Timeseries
This is now implemented in the irods_demo repository
Three Tools - SQL Exporter
https://github.com/burningalchemist/sql_exporter
SQL Exporter is a configuration driven exporter that exposes metrics gathered from DBMSs, for use by the Prometheus monitoring system.
The collected metrics and the queries that produce them are entirely configuration defined. SQL queries are grouped into collectors, mapped to the metrics they populate.
Minimum collection intervals may optionally be set per collector, producing cached metrics when polled more frequently than the configured interval.
Three Tools - SQL Exporter
      - metric_name: irods_users
        type: gauge
        help: 'Total Users'
        values: [total]
        query: |
          SELECT COUNT(*) AS total FROM r_user_main u
      - metric_name: irods_rodsusers
        type: gauge
        help: 'Total rodsusers'
        values: [total]
        query: |
          SELECT COUNT(*) AS total
          FROM r_user_main u
          WHERE
            u.user_type_name = 'rodsuser'
      - metric_name: irods_rodsgroups
        type: gauge
        help: 'Total rodsgroups'
        values: [total]
        query: |
          SELECT COUNT(*) AS total
          FROM r_user_main u
          WHERE
            u.user_type_name = 'rodsgroup'
Three Tools - Prometheus
https://github.com/prometheus/prometheus
Prometheus, a Cloud Native Computing Foundation project, is a systems and service monitoring system.
It collects metrics from configured targets at given intervals, evaluates rule expressions, displays the results, and can trigger alerts when specified conditions are observed.
Three Tools - Prometheus
global:
  scrape_interval: 15s

scrape_configs:
  - job_name: 'prometheus'
    static_configs:
      - targets: ['localhost:9090'] # Prometheus scrapes its own metrics
  - job_name: 'irods'
    static_configs:
      - targets: ['sql-exporter:9399']
Three Tools - Grafana
https://github.com/grafana/grafana
The open-source platform for monitoring and observability.
Grafana allows you to query, visualize, alert on, and understand your metrics no matter where they are stored.
Three Tools - Grafana
apiVersion: 1

datasources:
  - name: Prometheus
    type: prometheus
    url: http://prometheus:9090
    access: proxy
    isDefault: true
    version: 1
    editable: true
iRODS Dashboarding
iRODS Chargebacks
Captures data transfers in and out of the namespace
- Demonstrated via iRODS Rule Language
- Easily hardened, optimized to C++
This provides administrators with comprehensive network usage information, suitable for scripting and automating chargebacks in a service-oriented environment.
Capturing Transfers In and Out
add_transfer(*user, *direction, *bytes){
  *query = "select USER_ID where USER_NAME = '*user'";
  msiExecStrCondQuery(*query, *res);
  foreach(*res) {*userid = *res.USER_ID};
  *theargs = "*userid *direction *bytes";
  msiExecCmd("add_transfer.sh", *theargs, "null", "null", "null", *result);
}

pep_api_data_obj_write_post(*INSTANCE_NAME, *COMM, *DATAOBJWRITEINP, *BUFFER) {
  add_transfer(*COMM.user_user_name, 'in', *DATAOBJWRITEINP.len);
}

pep_api_data_obj_read_post(*INSTANCE_NAME, *COMM, *DATAOBJREADINP, *BUFFER) {
  add_transfer(*COMM.user_user_name, 'out', *DATAOBJREADINP.len);
}

pep_api_data_obj_put_post(*INSTANCE_NAME, *COMM, *DATAOBJINP, *BUFFER, *PORTAL_OPR_OUT) {
  add_transfer(*COMM.user_user_name, 'in', *DATAOBJINP.data_size);
}

pep_api_data_obj_get_post(*INSTANCE_NAME, *COMM, *DATAOBJINP, *BUFFER, *PORTAL_OPR_OUT) {
  add_transfer(*COMM.user_user_name, 'out', *DATAOBJINP.data_size);
}

pep_api_bulk_data_obj_put_post(*INSTANCE_NAME, *COMM, *BULKOPRINP, *BUFFER) {
  # bulk can hold up to 50 files, with sizes in data_size_0 through data_size_49
  # walk through and sum the sizes
  *counter = 0;
  *totalbytes = 0;
  foreach(*k in *BULKOPRINP) {
    if (*k like "data_size_*") then {
      *counter = *counter + 1;
      *totalbytes = *totalbytes + int(*BULKOPRINP.*k);
    }
  }
  add_transfer(*COMM.user_user_name, 'in', *totalbytes);
}
Capturing Transfers In and Out
ICAT=> \d r_transfer_totals
                  Table "public.r_transfer_totals"
  Column   |          Type          | Collation | Nullable | Default
-----------+------------------------+-----------+----------+---------
 user_id   | bigint                 |           | not null |
 action    | character varying(250) |           | not null |
 exbibytes | bigint                 |           | not null |
 bytes     | bigint                 |           | not null |
Indexes:
    "unique_user_action" UNIQUE CONSTRAINT, btree (user_id, action)


ICAT=> select * from r_transfer_totals;
 user_id | action | exbibytes |   bytes
---------+--------+-----------+------------
   10002 | out    |         0 | 4294967296
   10002 | in     |         0 | 2147483888
(2 rows)
  INSERT INTO R_TRANSFER_TOTALS (user_id, action, exbibytes, bytes)
  VALUES (${USER_ID}, '${ACTION}', 0, ${BYTES})
  ON CONFLICT (user_id, action) DO UPDATE SET
    bytes = R_TRANSFER_TOTALS.bytes + EXCLUDED.bytes;
Next Steps
- Seek community feedback
- New metrics
- Optimized queries
- Different databases
- Better dashboards
- Define best practices
- Scraping intervals
- Thresholds and alerts
- Absorb transfer tracking into the server

Questions?
Thank you.