Bending geographic maps for enhanced railway space-time diagrams
FOSDEM 2024, 3 February 2024
Railways and Open Transport devroom

OuestWare
dataviz web apps at
I develop

and since early 2021
we work for
to contribute to
Open Source Railway Designer
at some point
we've been tasked to
enhance
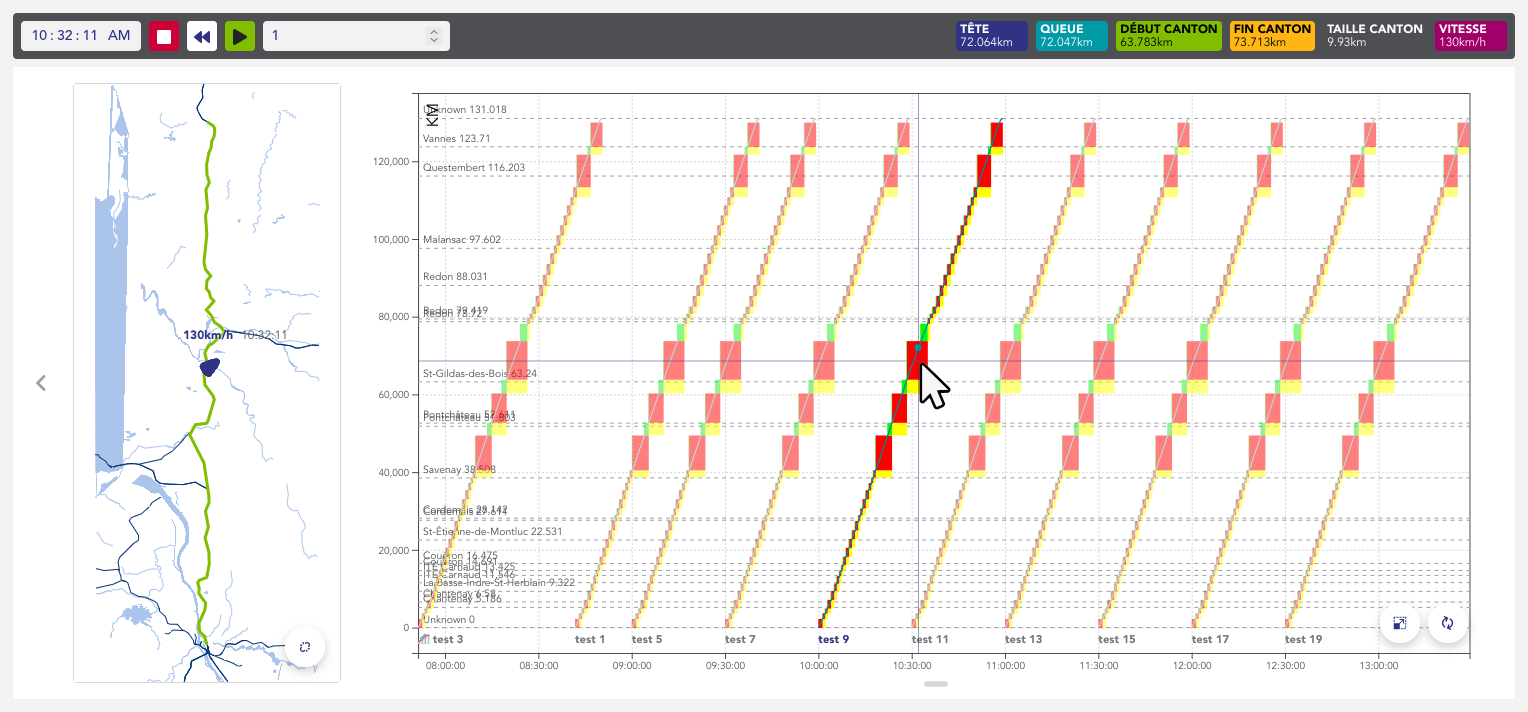
the Space-Time Diagrams
...or Circulation Diagrams
Space-Time Diagrams
...or Train Graphs
what are
...or Graphical Timetables
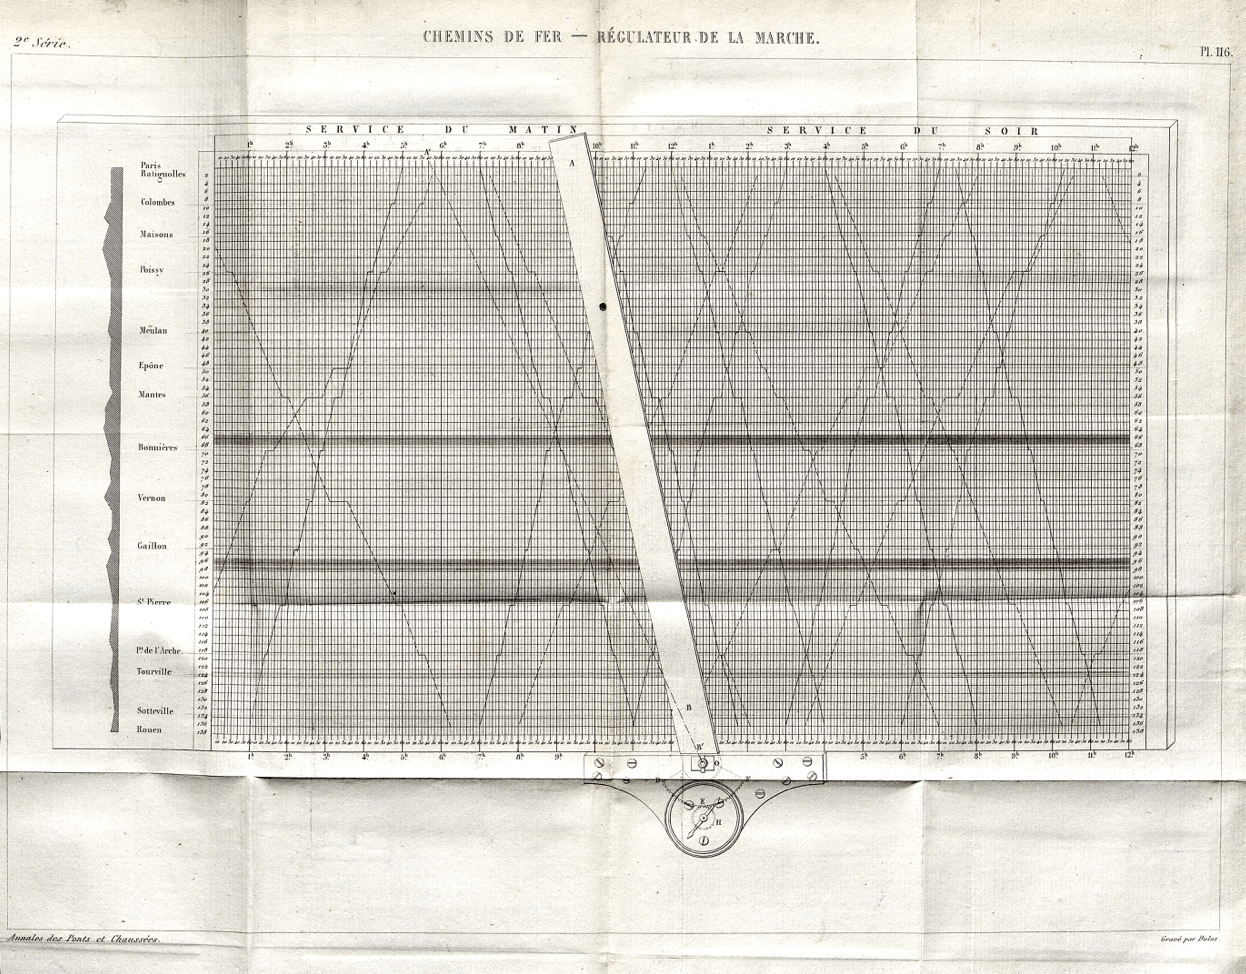
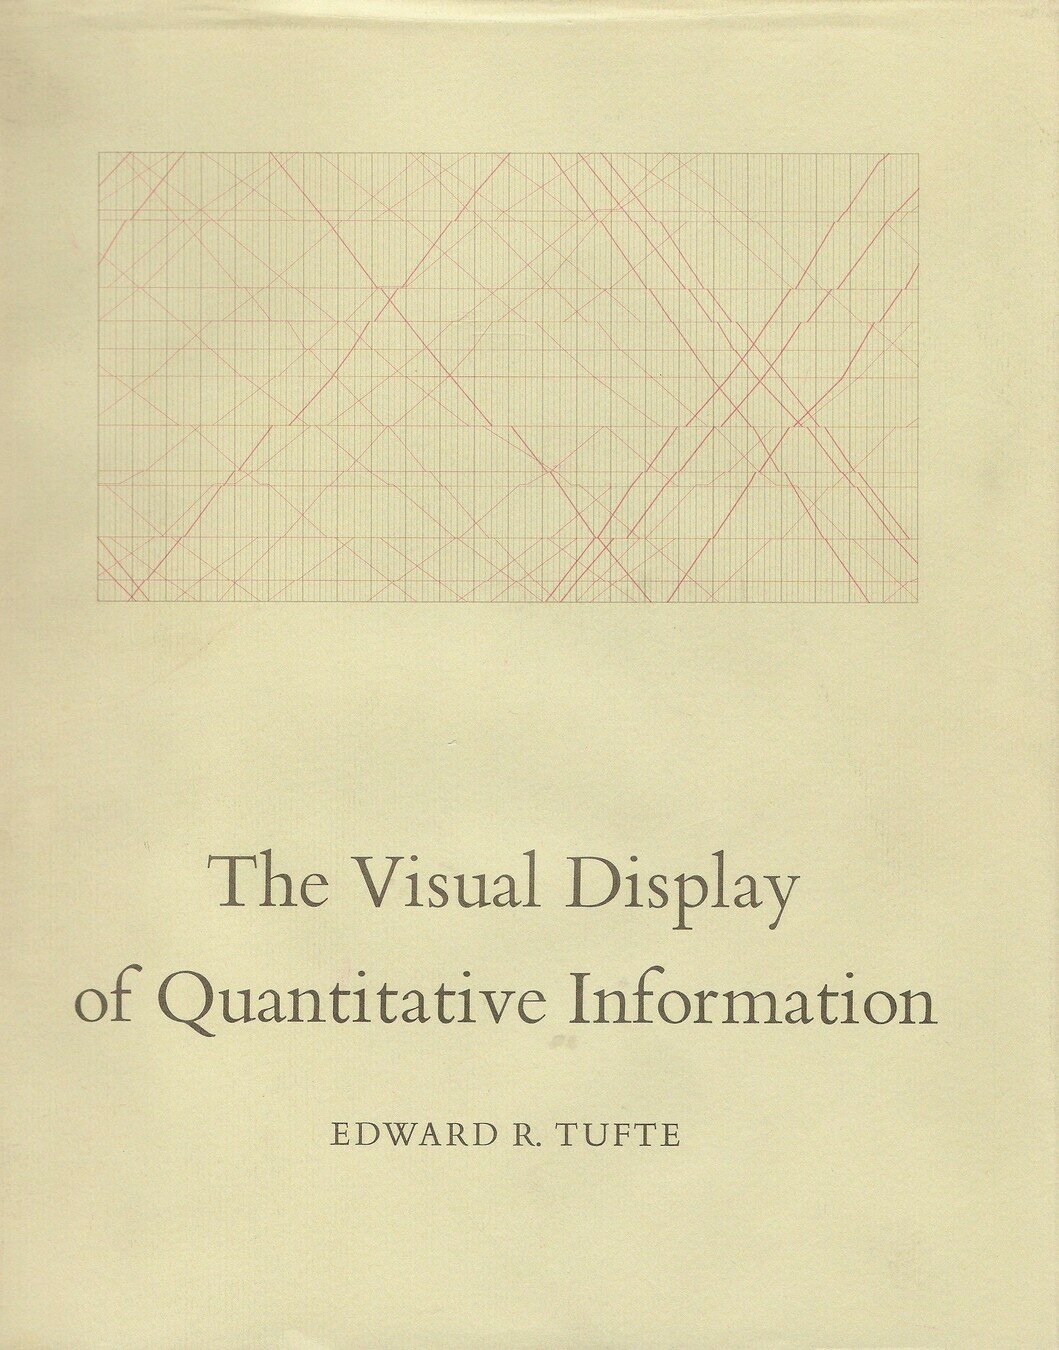
to be the cover of a
a good enough graphic
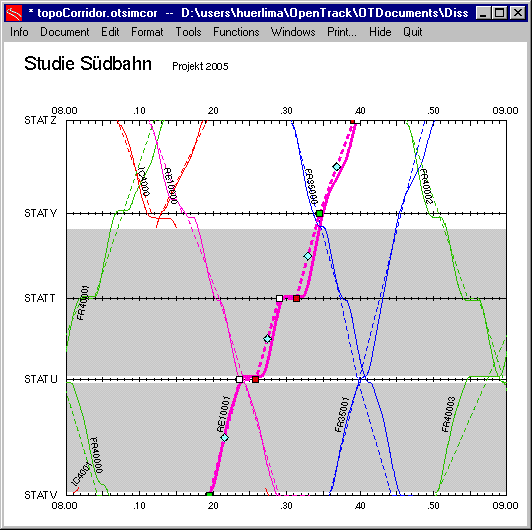
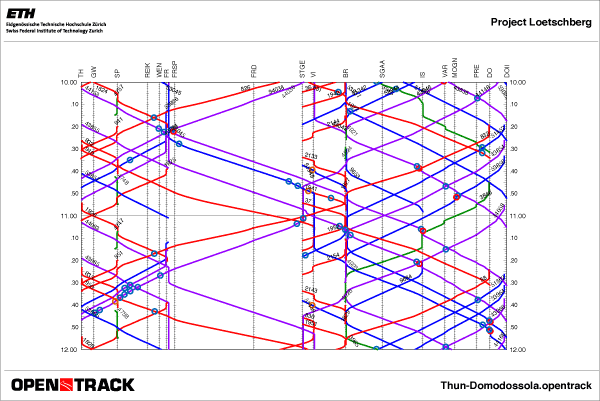
even better
but this chart is actually
once we introduce
blocks
A quick word about blocks

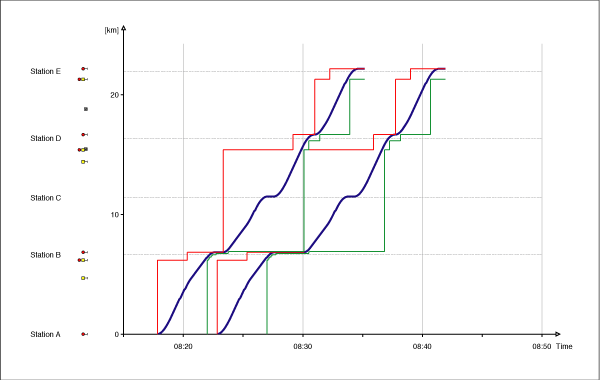
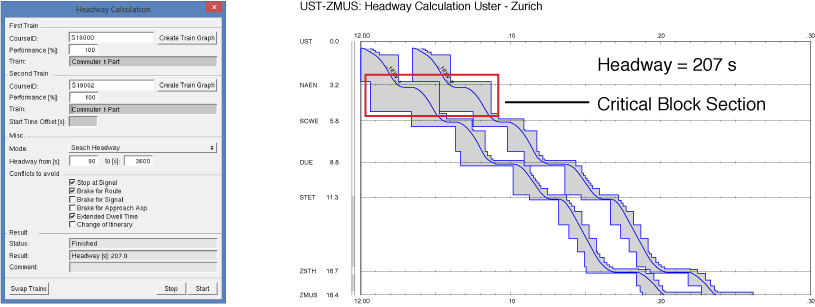
in
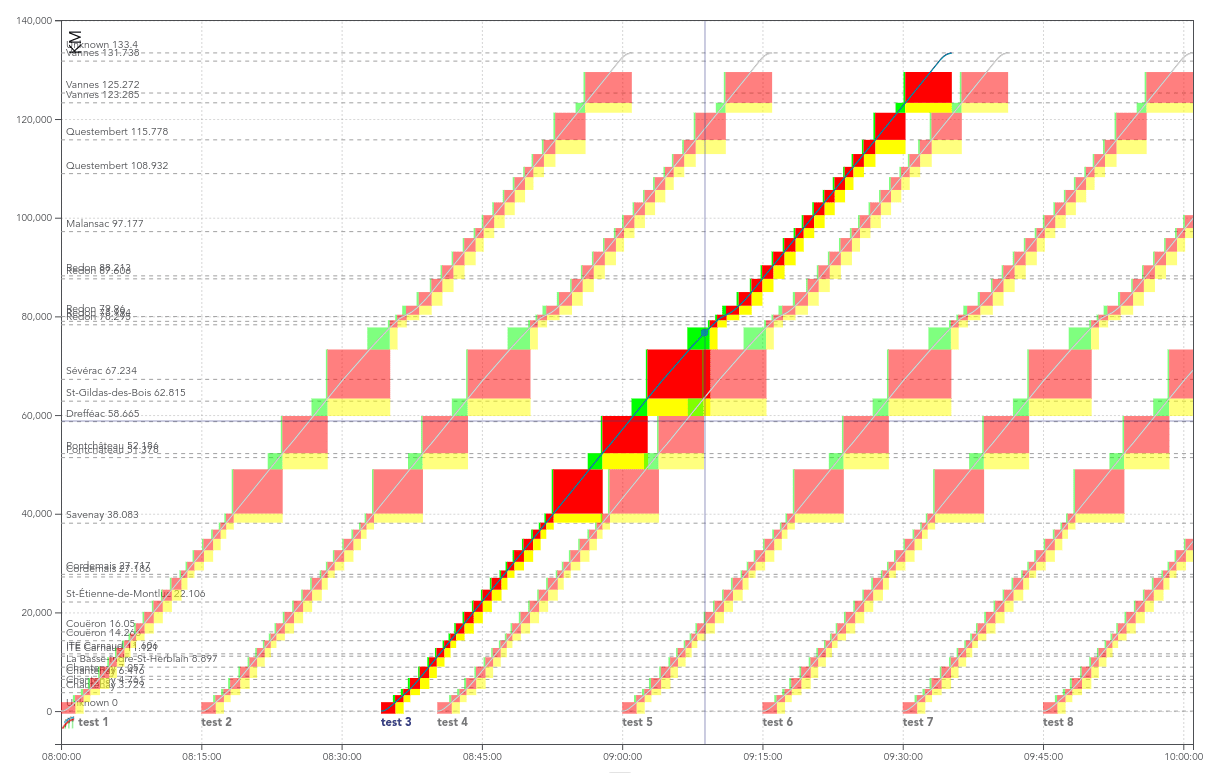
in OSRD
can we make it
even more informative?
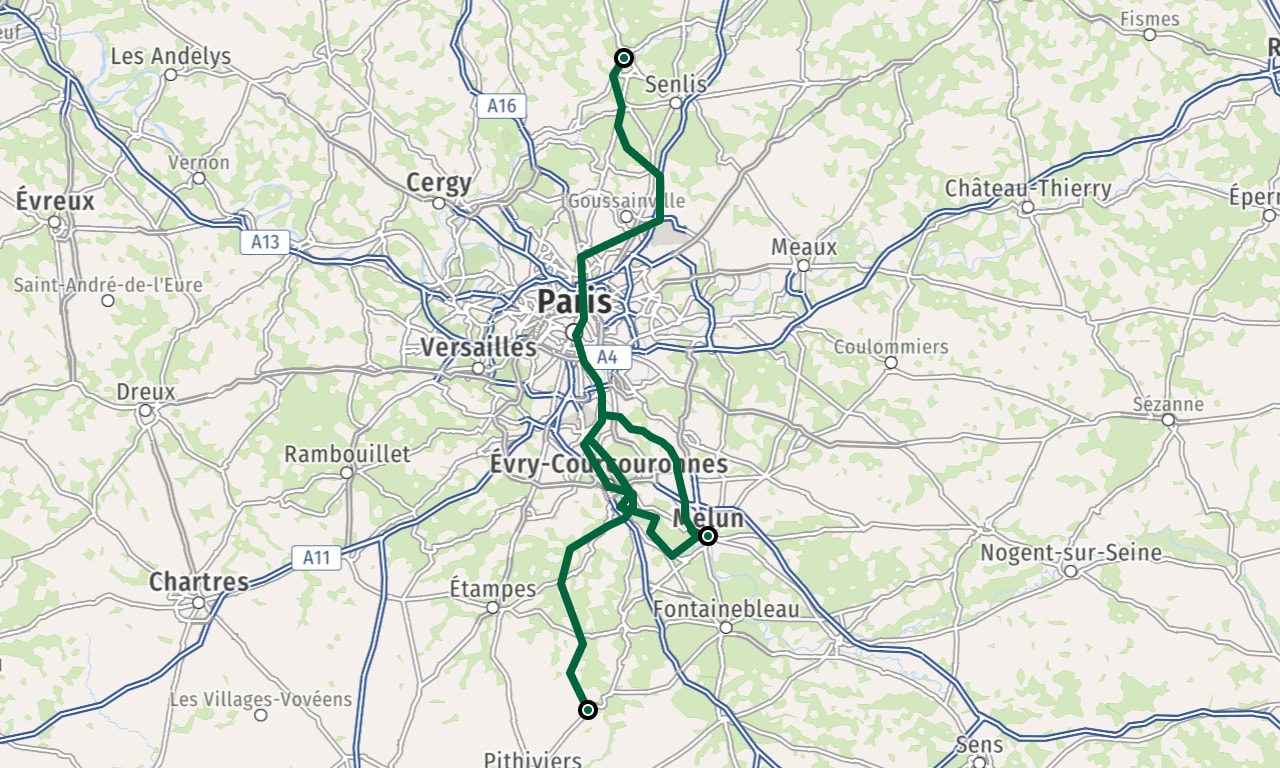
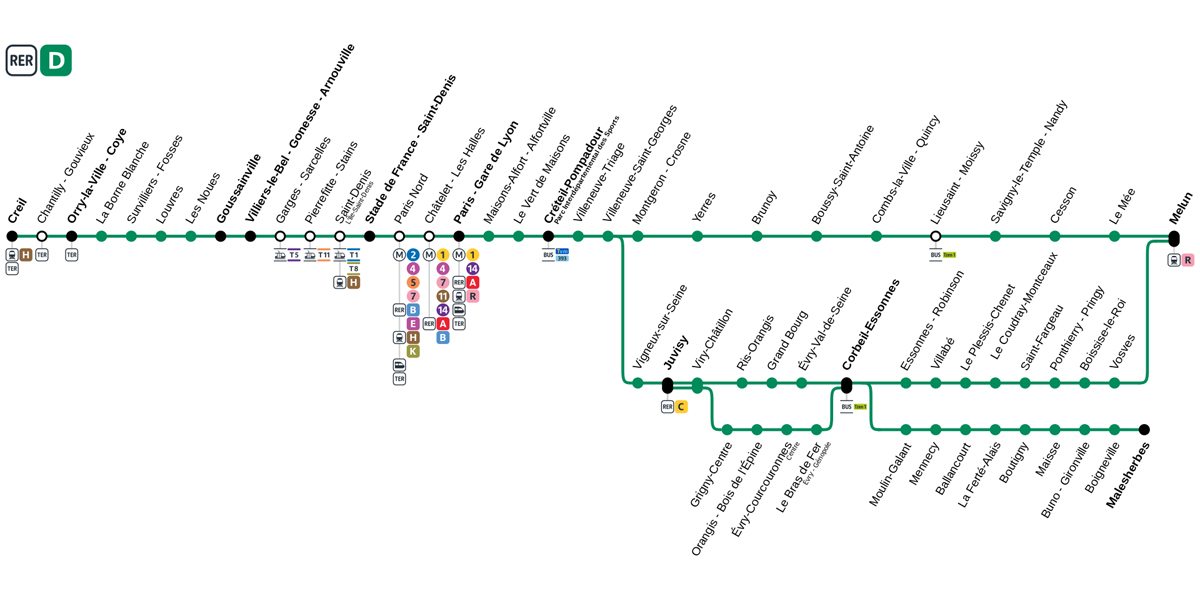
a schematic strategy
requires to know the exact topology
👍
allows rendering exactly what we want/need
👎

a cartographic strategy
we show everything a map would show
👍
we show everything a map would show
👎
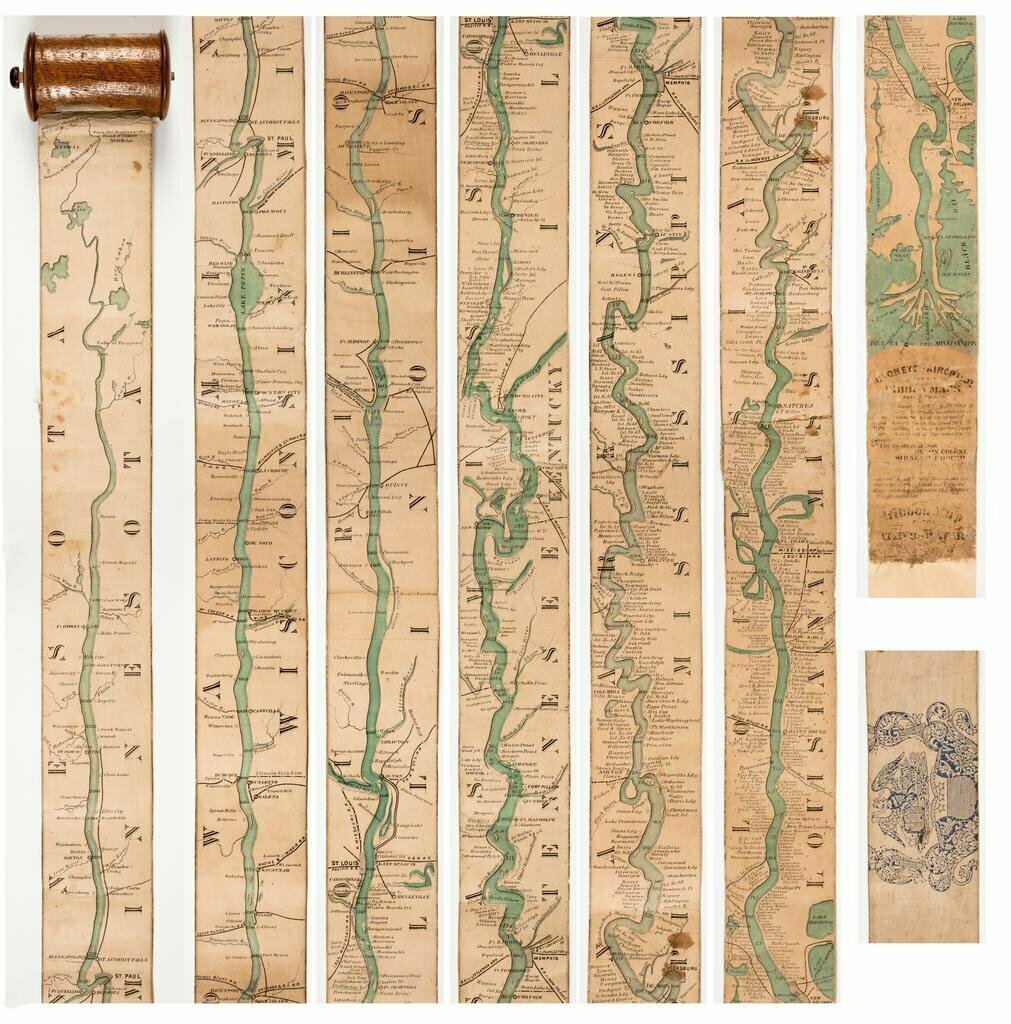
it's called Strip maps
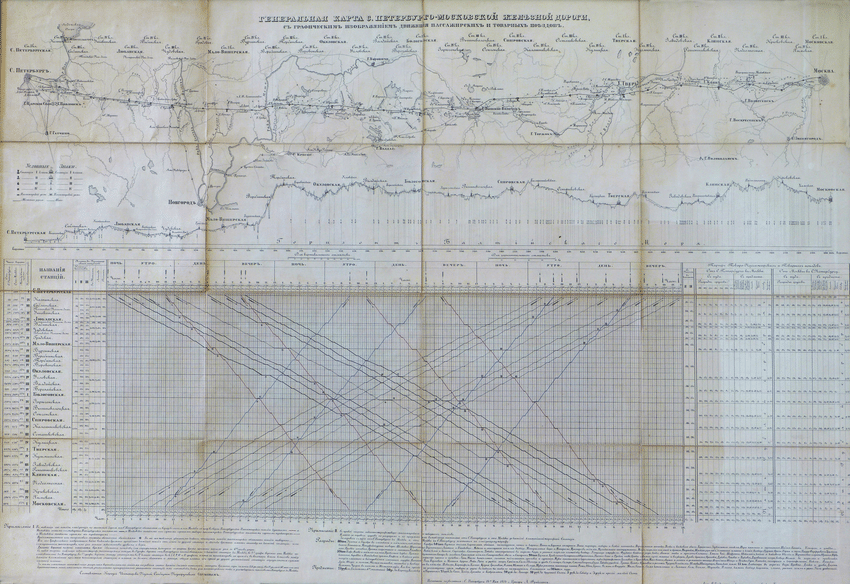

and it's actually been used with space-time diagrams already!
so...
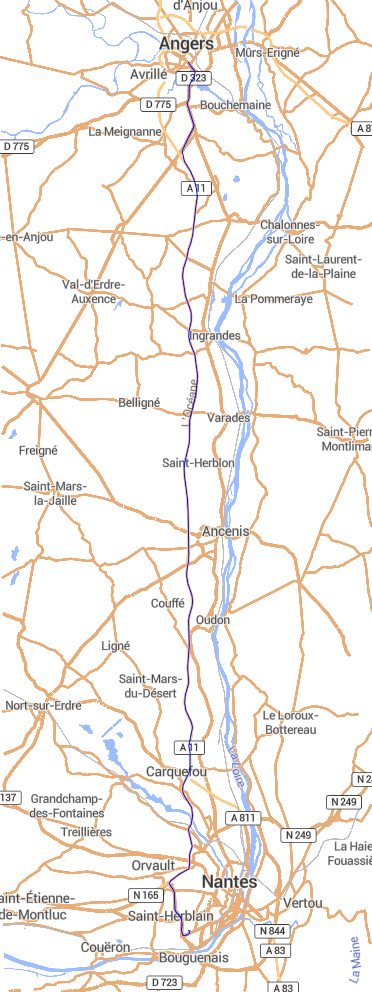
let's bend geographic maps
generate a triangles grid
the strategy is to
along the path
and another straight grid
and to translate coordinates between the grids
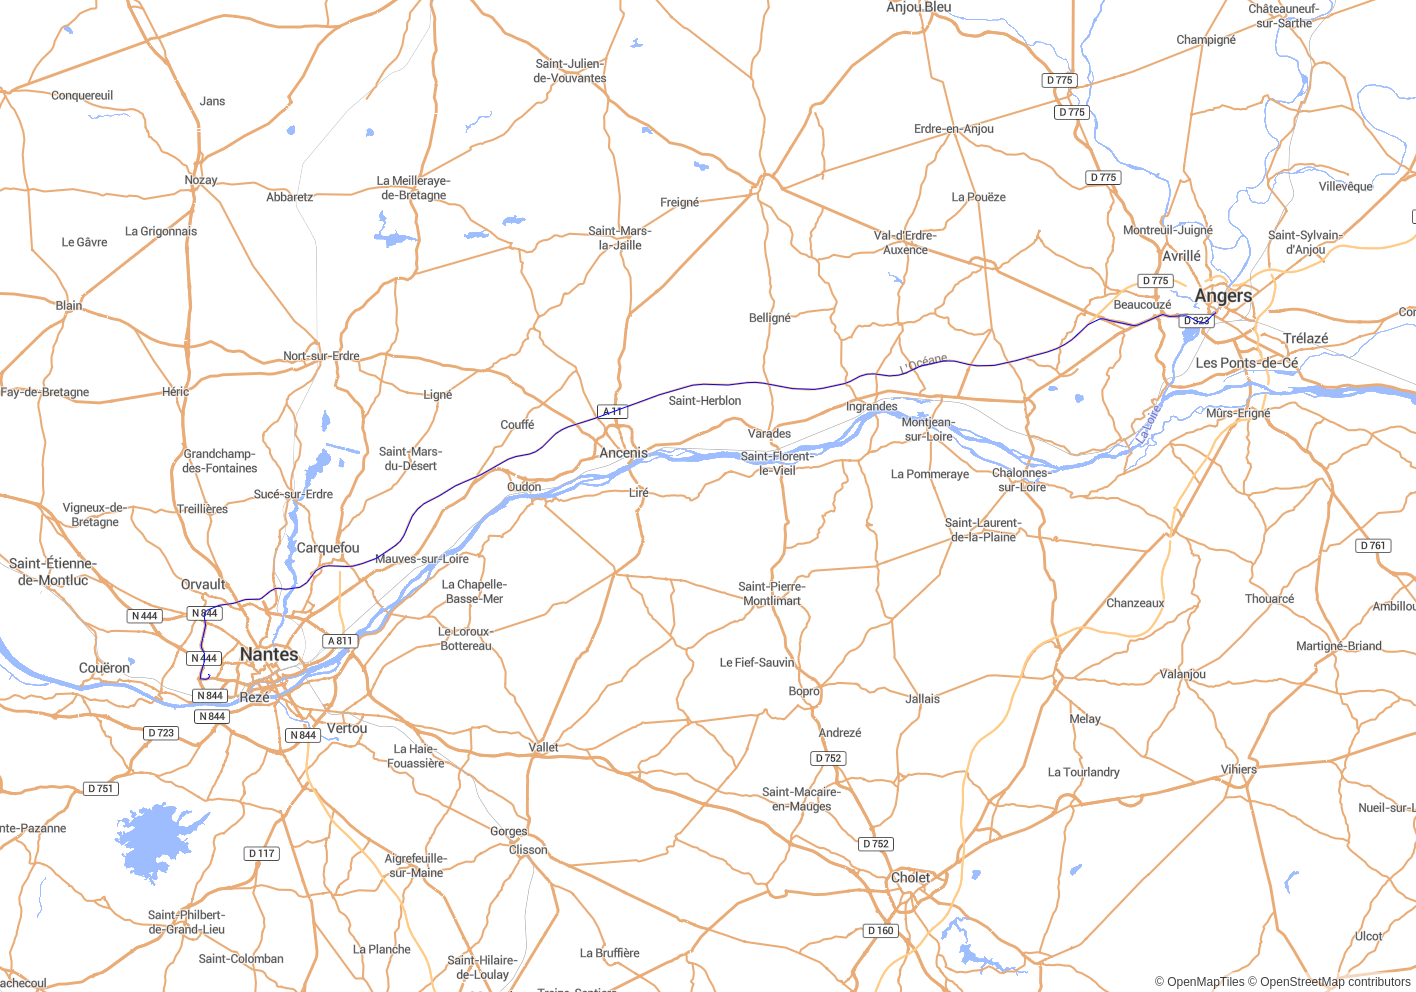
here's our initial path


we build a grid along the path

we smoothen the grid
we index the grid, and


generate a straight similar grid
we have a projection \o/
For a given point P
- Find the quad that contains P
- Find the triangle T (indexed in the quad) that contains P
- Find the related triangle T' in the straight grid
- Transpose coordinates from T to T' to obtain P', using barycentric coordinate system
So, to get a map
Using react-map-gl and MapLibre


the two maps side by side
