James.Wilson@ColoState.Edu.
Professor of Mathematics, Colorado State University
Patterns in Data & the Algebra That Finds It
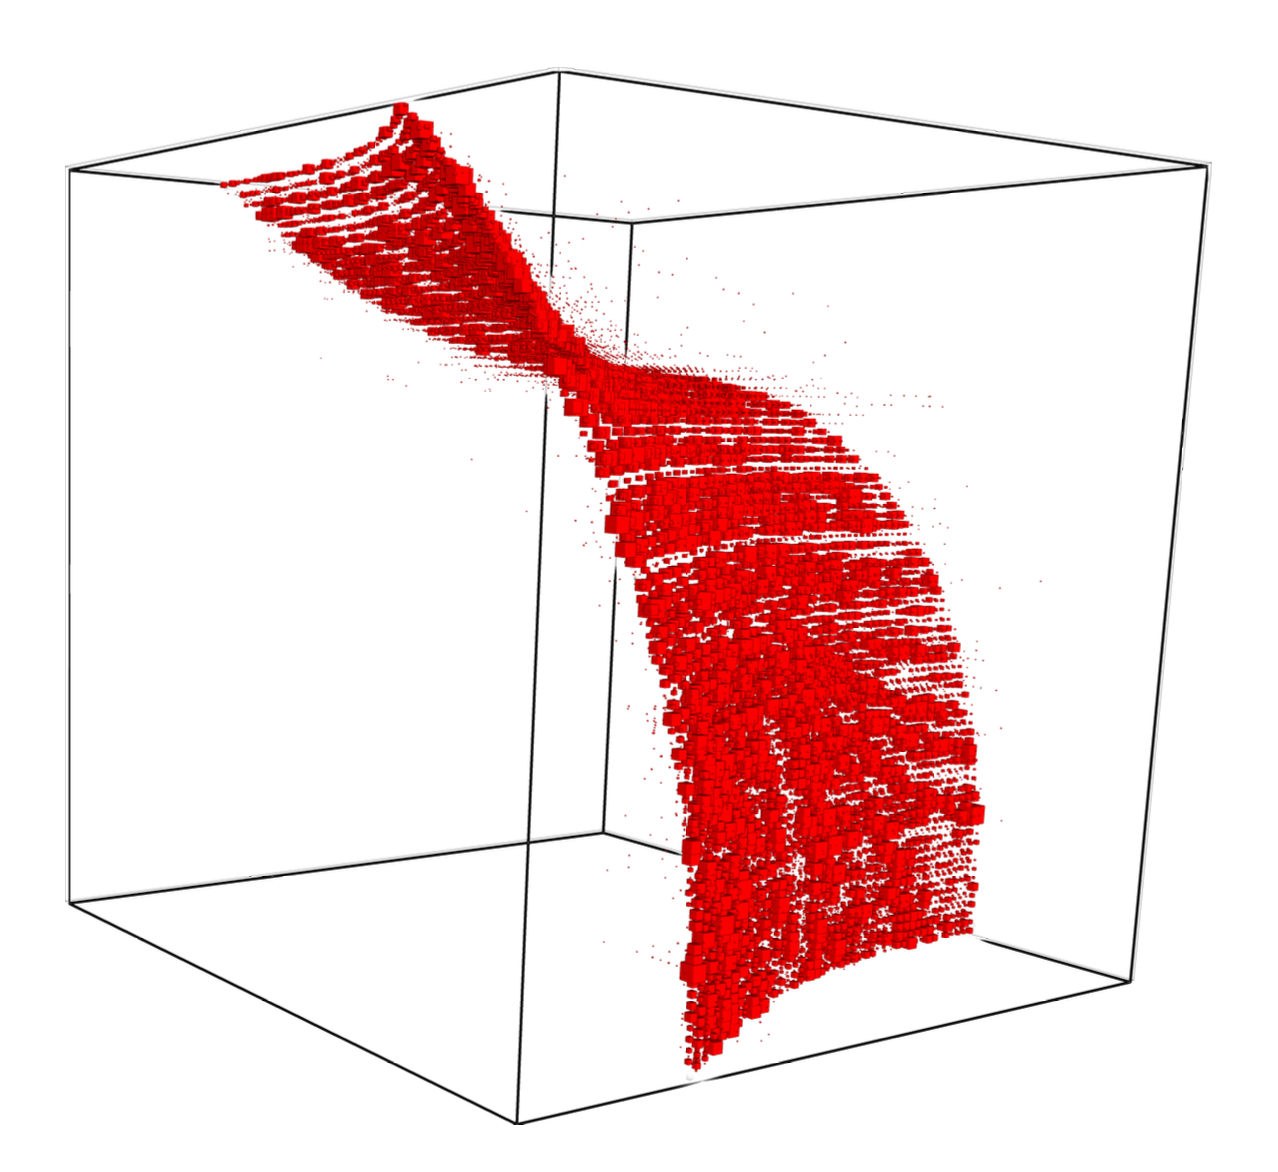
https://slides.com/jameswilson-3/data-algebra

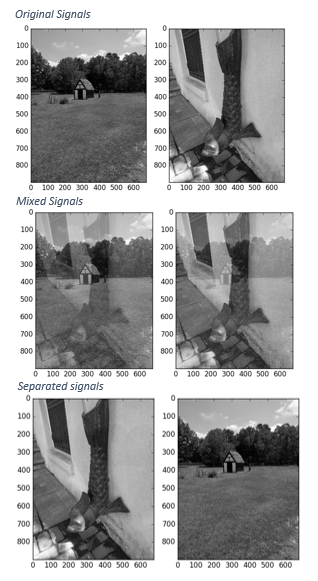
A Problem:
Blind Source Separation (BSS)
Signals get mixed in ...
- collection
- transmission
- decoding
Goal: separate them.


Strategy:
- Signal \(u_1=[9,2,9,1], u_2=[8,3,9,2]\)
- Build "statistic", e.g. sums of squares \[\langle u_i, u_j\rangle=u_{i1}u_{j1}+u_{i2}u_{j2}+u_{i3}u_{j3}+u_{i4}u_{j4}\] for all \(i,j\) \[\begin{array}{|c|cc|} \hline \langle u_i,u_j\rangle & 1 & 2 \\ \hline 1 & 167 & 161 \\ 2 & 161 & 158 \\ \hline \end{array}\]
- Separate the differences...\[v_1= u_1,\qquad v_2=-\frac{161}{167}u_1+u_2\] \[\begin{array}{|c|cc|} \hline \langle v_i,v_j\rangle & 1 & 2\\ \hline 1 & 167 & 0 \\ 2 & 0 & -2.78 \\ \hline \end{array}\]
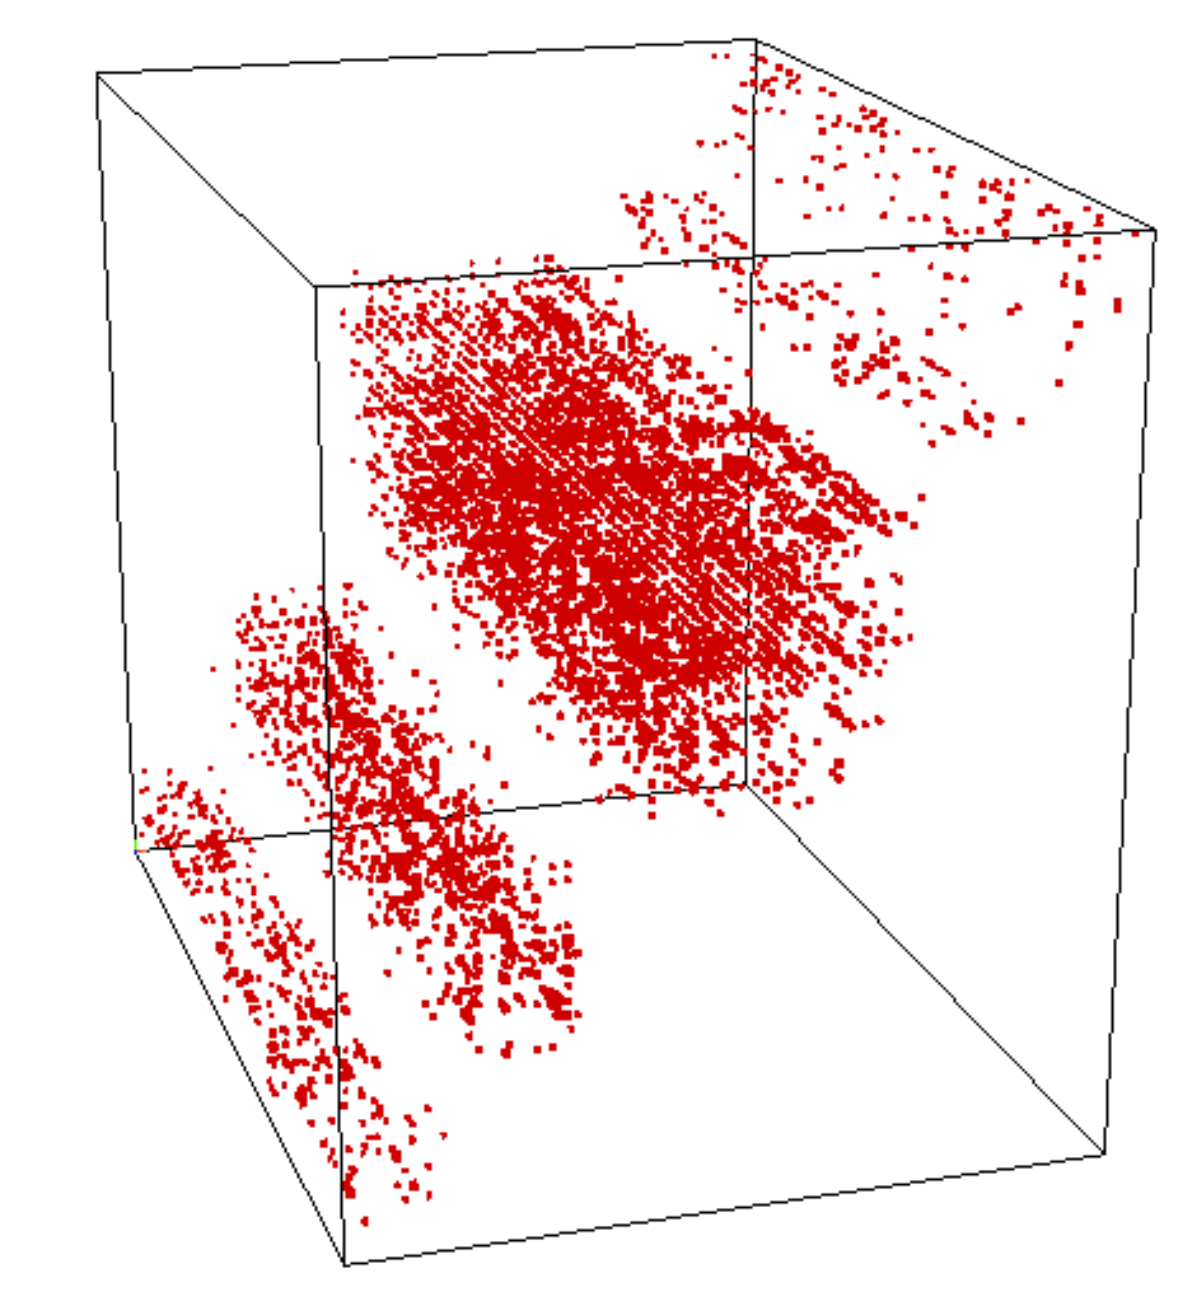
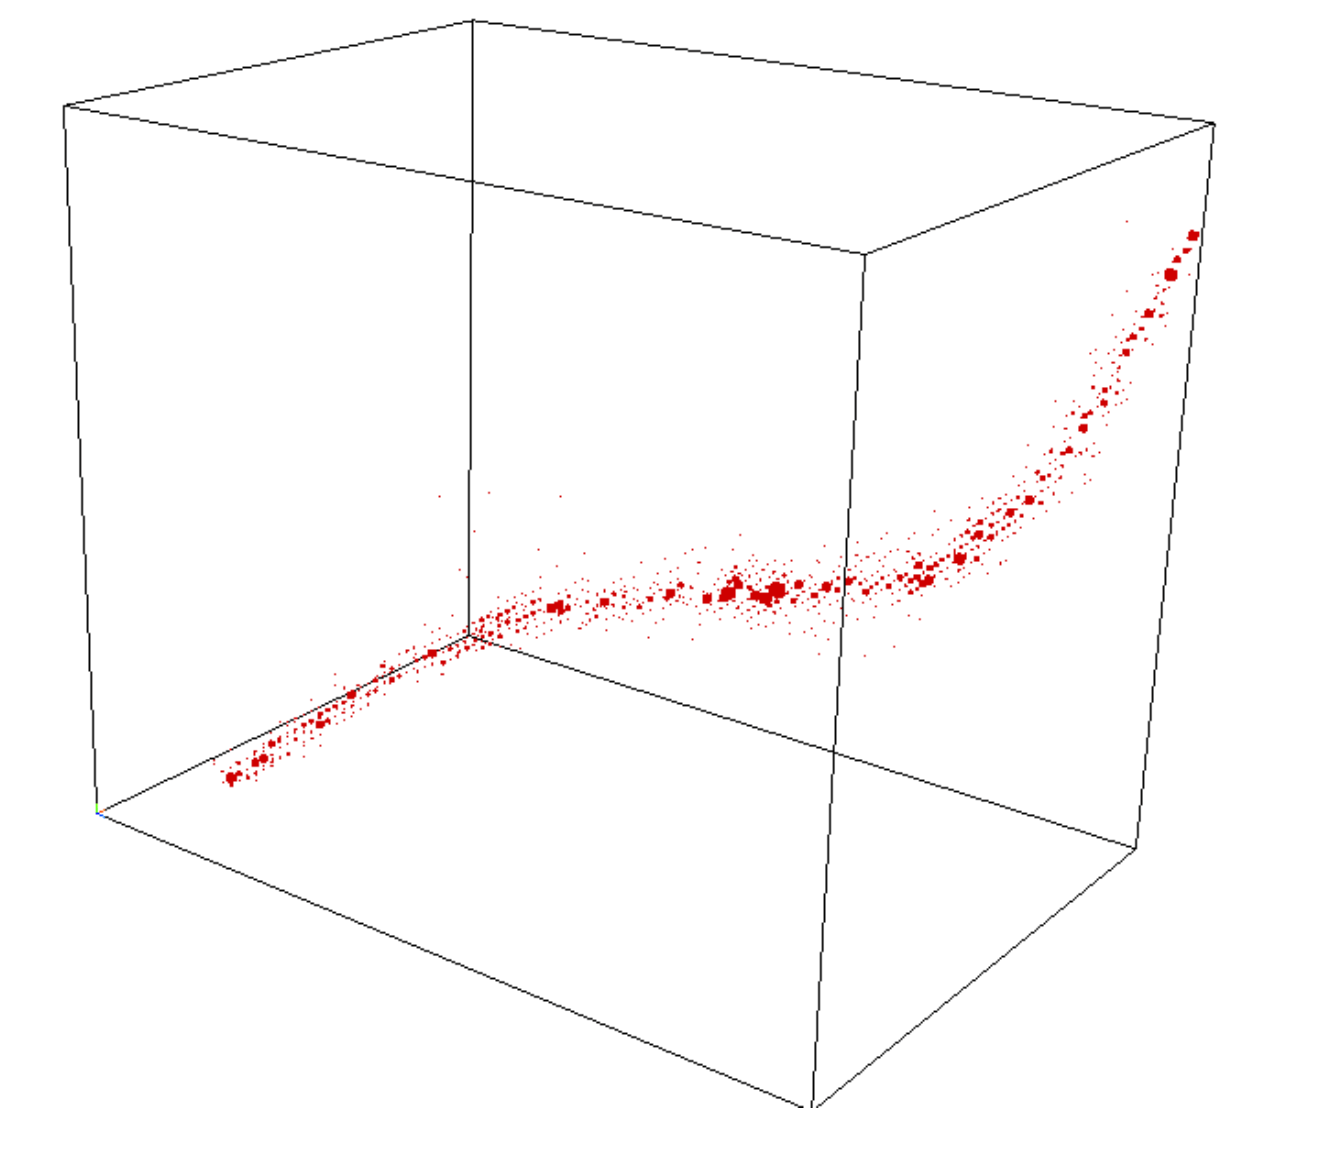
Cluster Patterns in Tensors Data
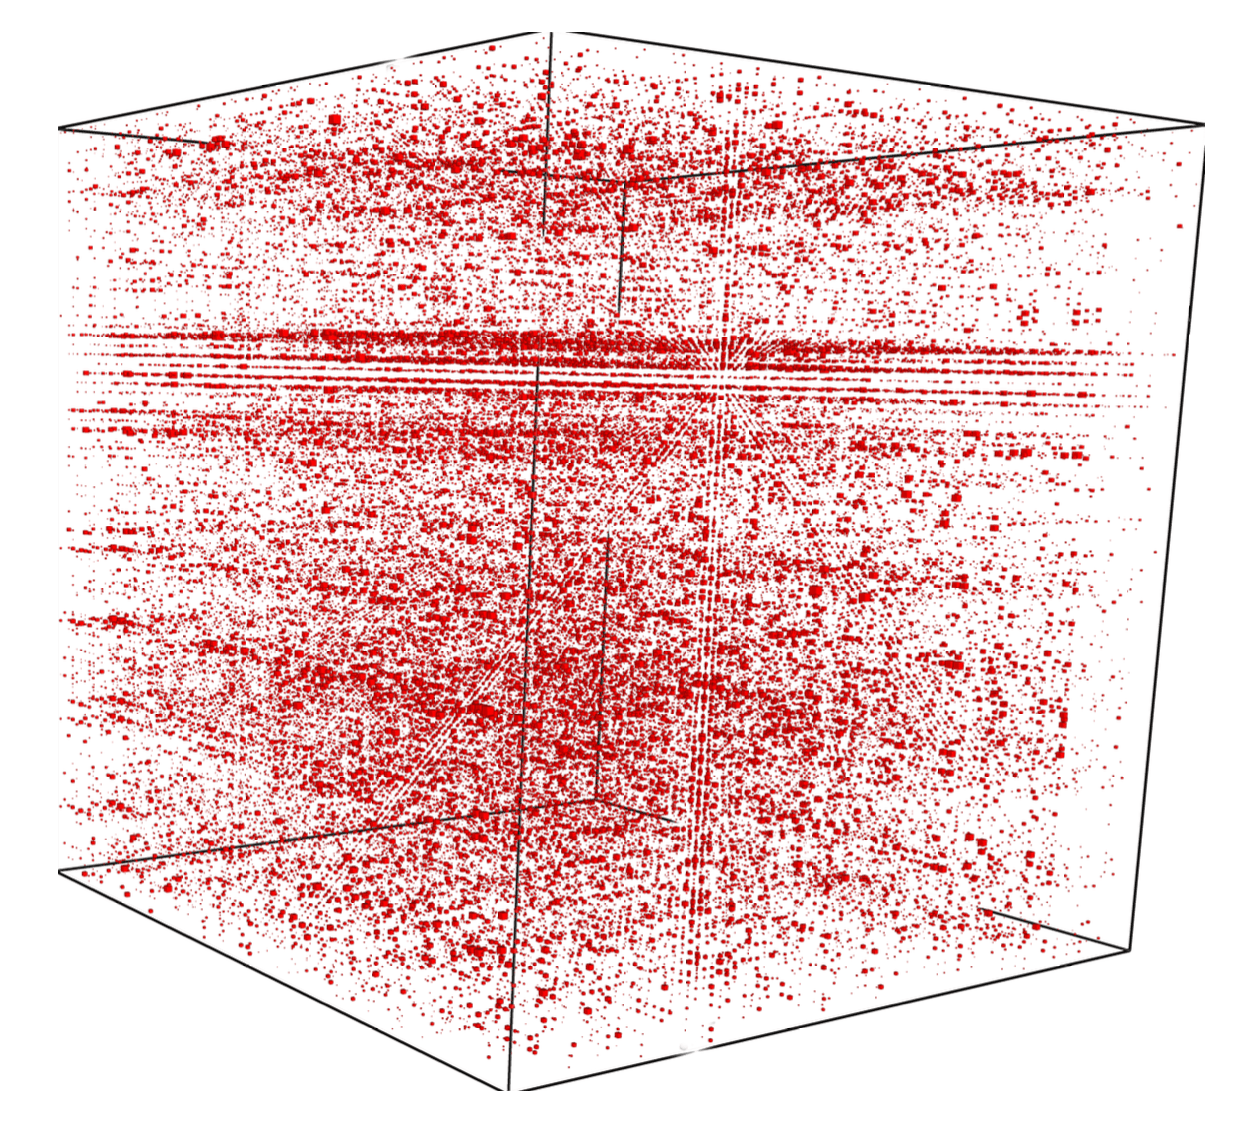
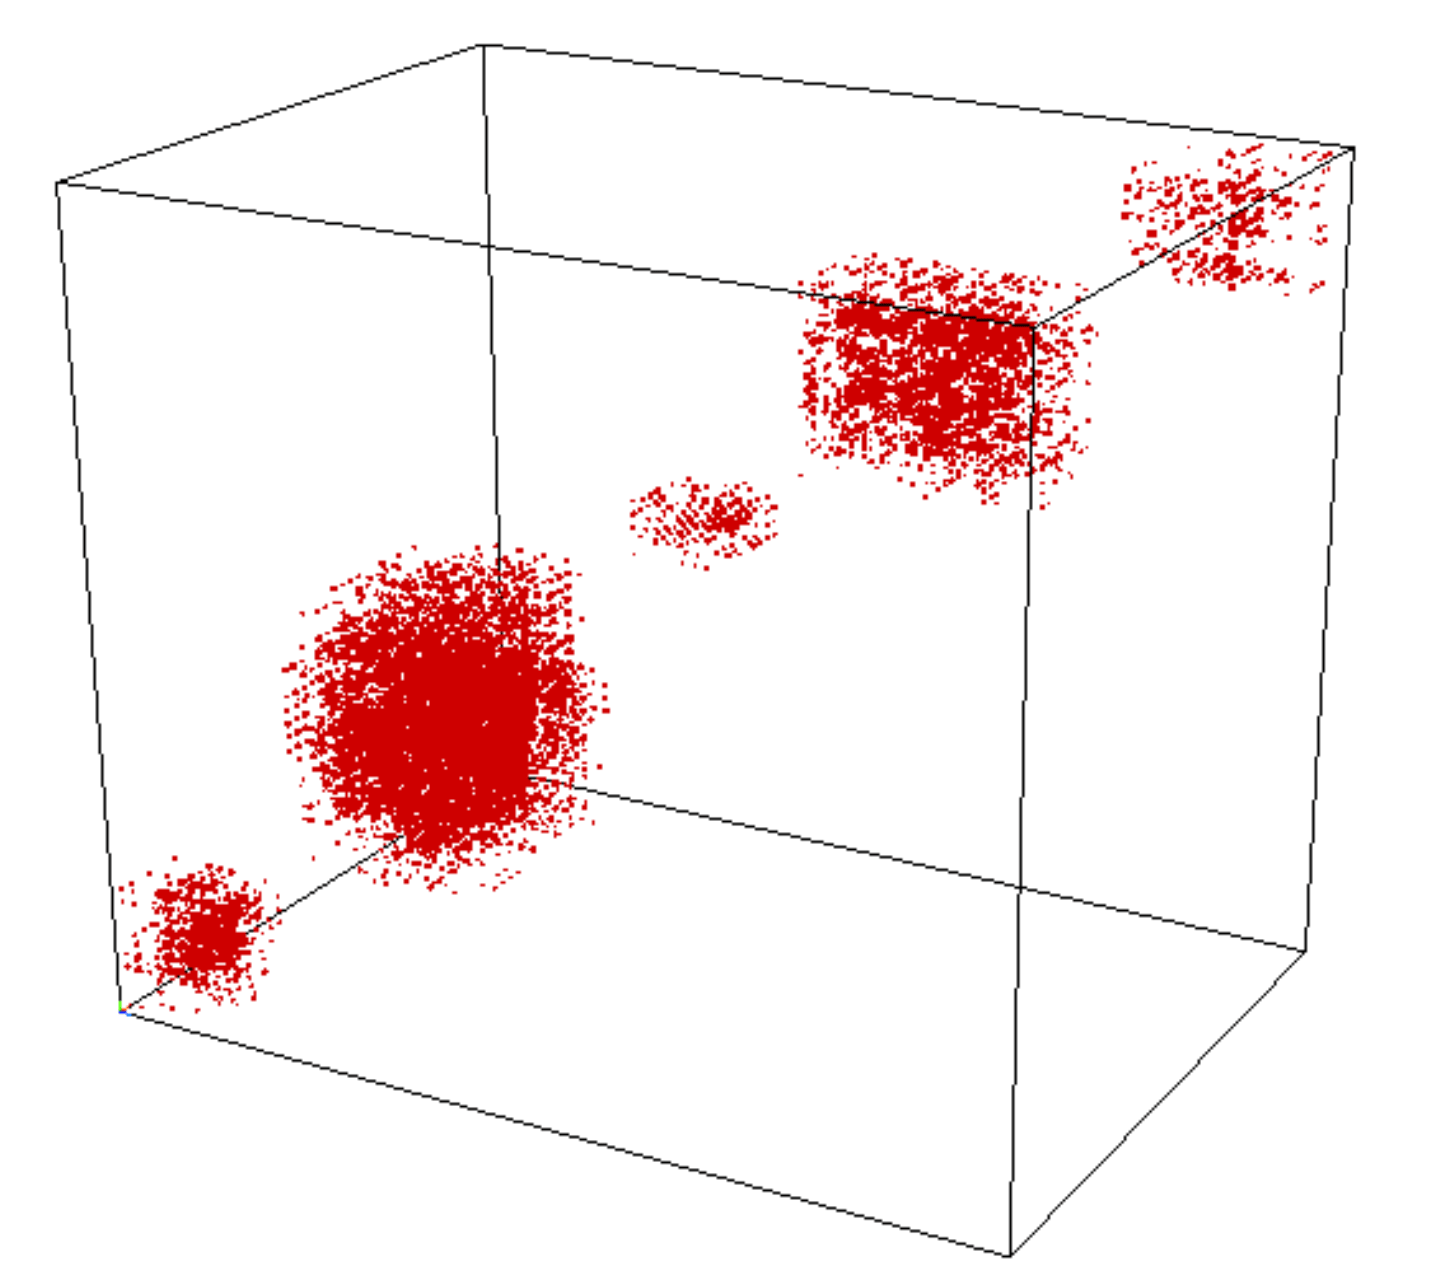
WhO Me?
Couldn't Be!

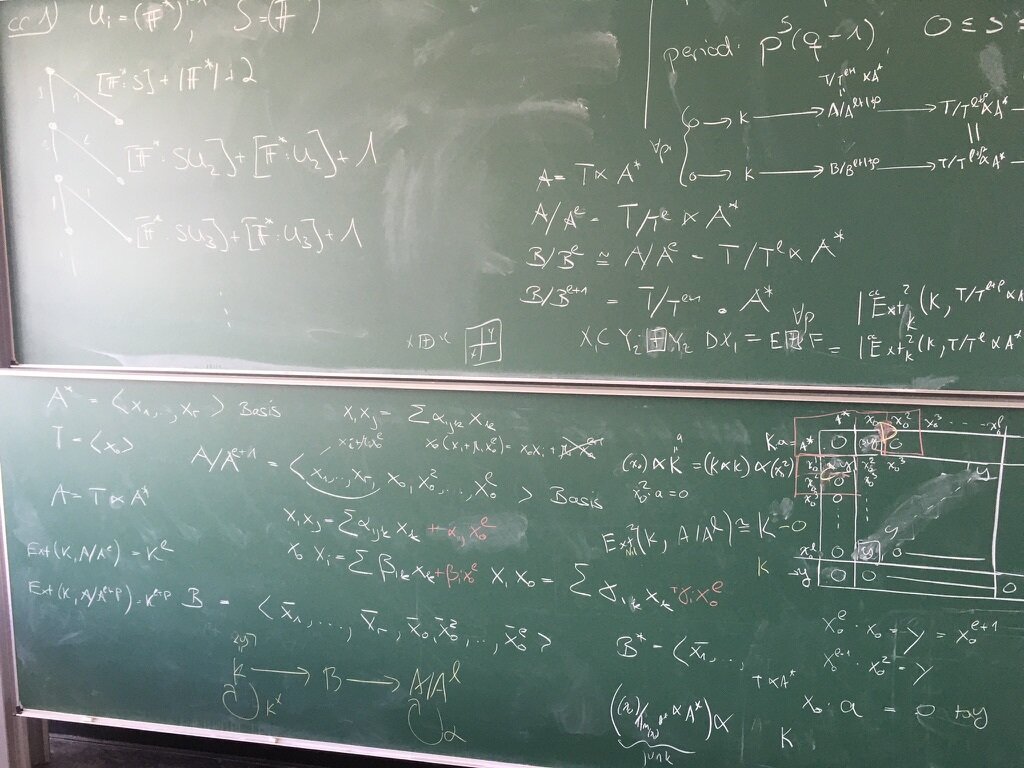
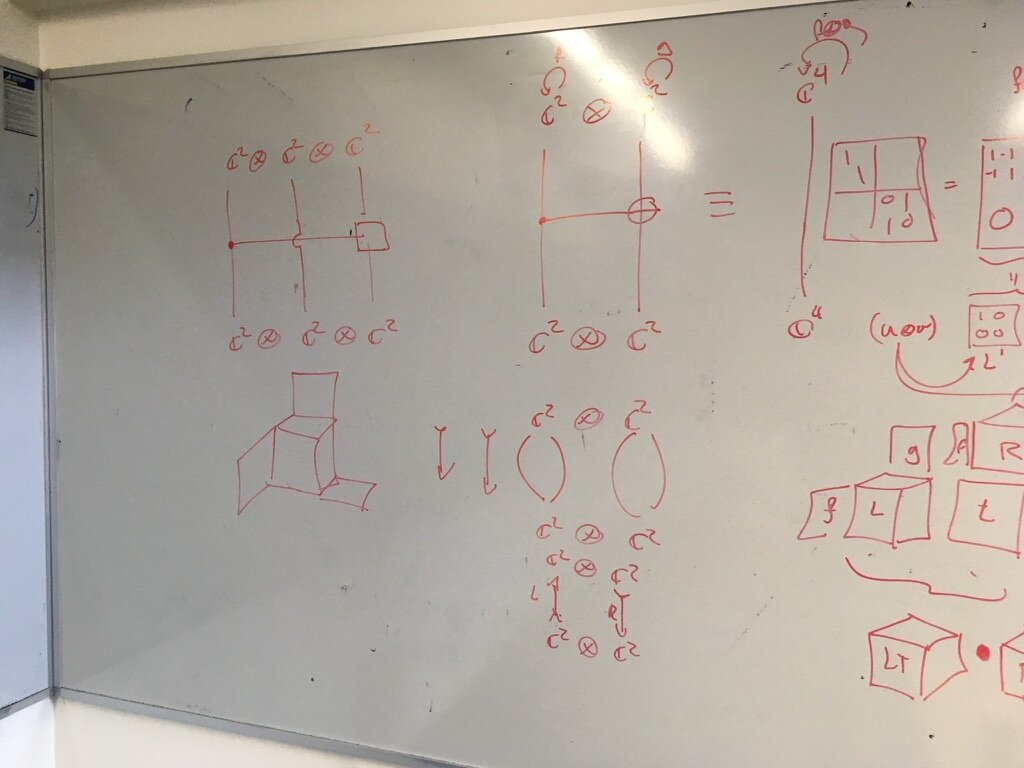
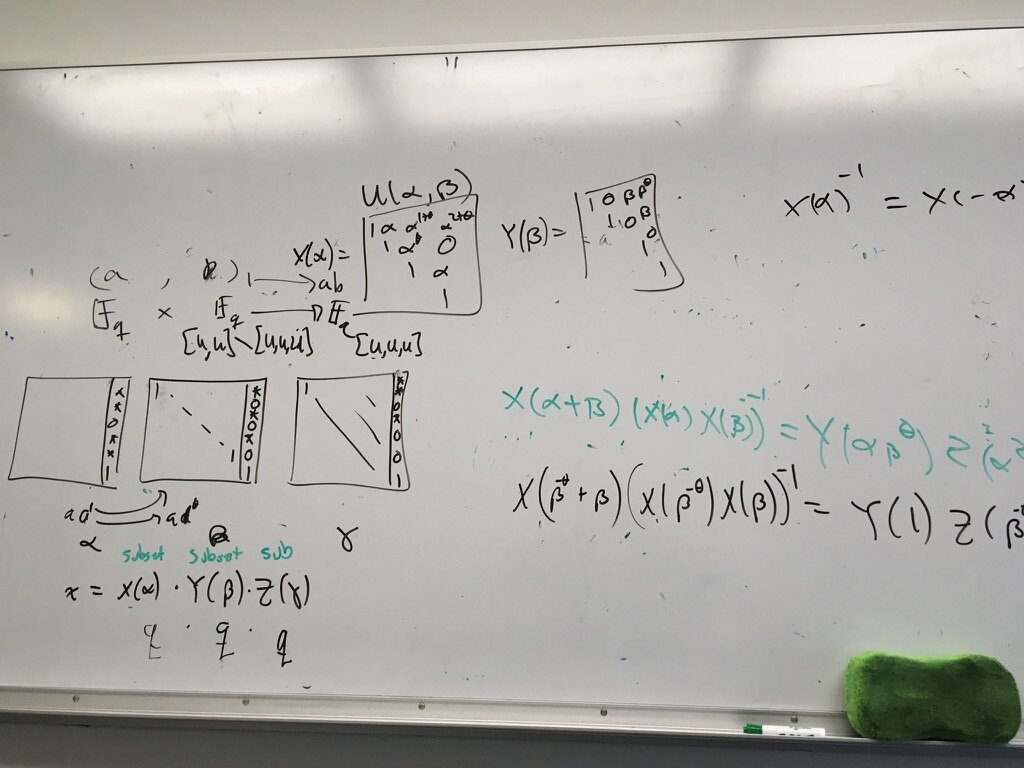

-
Then Who?
-
Maybe you?

Tensors as AreA &volume
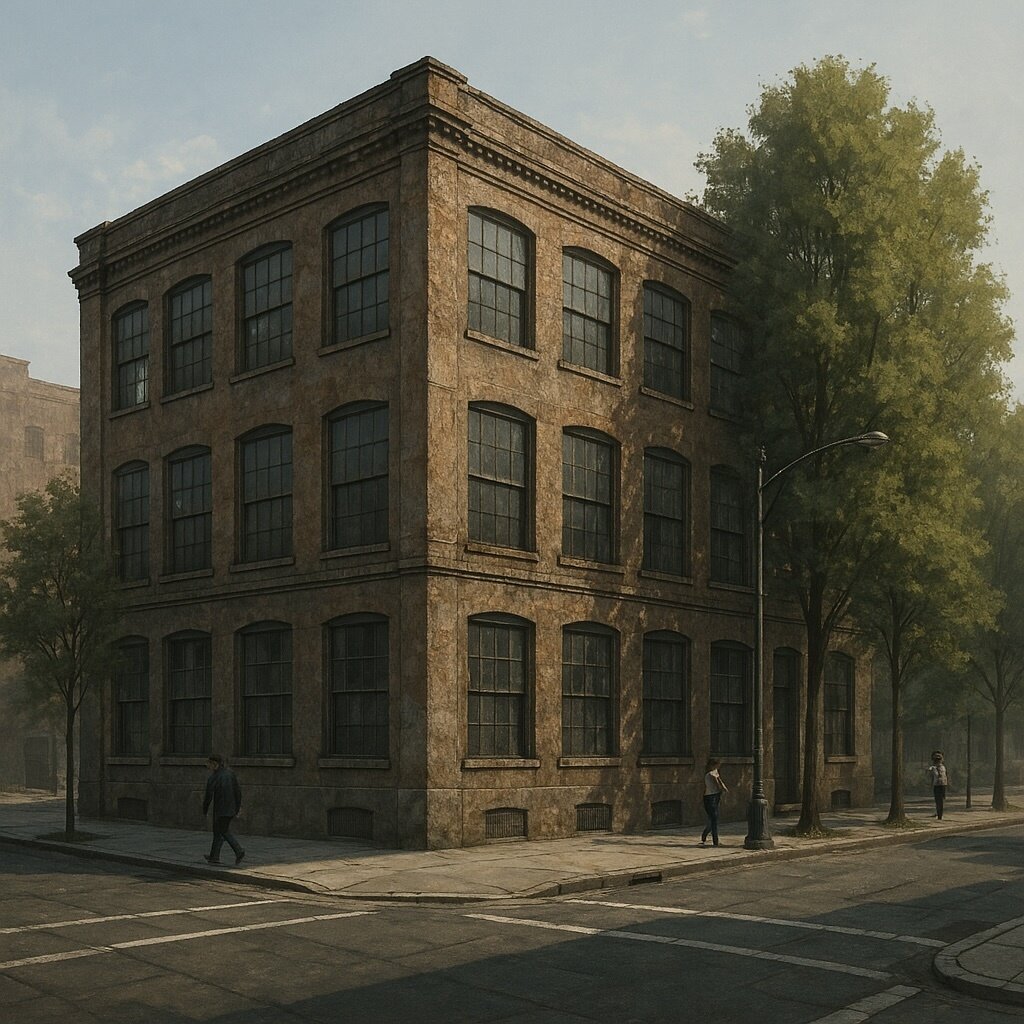
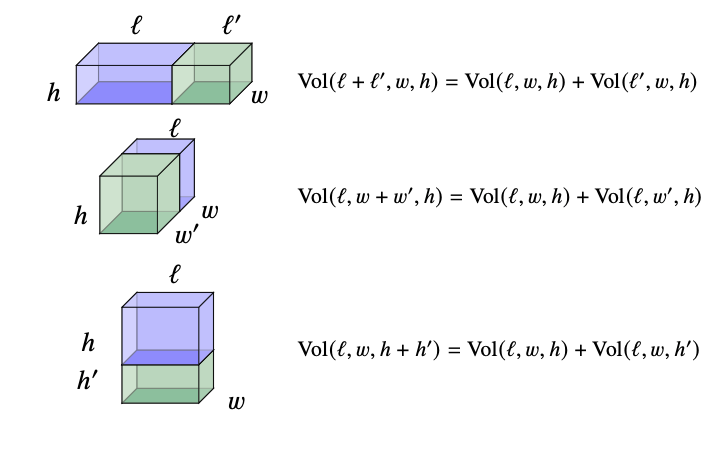
Volume basics
Volume: west window bays x east window bays x floors \[\text{Vol}(4,5,3) = 4\text{bays} \times 5\text{bays}\times 3\text{floors} = 60\text{rooms}.\]
Lessons:
- Volumes are distribute products
- They need multiplication tables ("tensors")
Oops! Miss counted, but easy update: \[\text{Vol}(4,5+{\color{red}1},3)=\text{Vol}(4, 5, 3)+{\color{red}\text{Vol}(4,1,3)}=60+12=72\]
Need it in Cubic feet? Easy.
Vol(4,6,3) = 160 \(\text{ft}^4/\text{bay}^2~\text{floor}\) \(\times 4 \text{bays} \times 6\text{bays} \times 3 \text{floors}\)
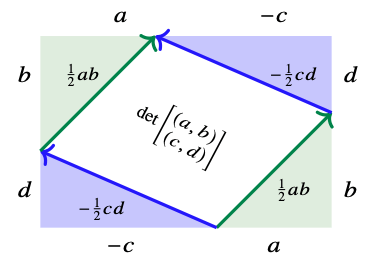
Area...easy
Area...
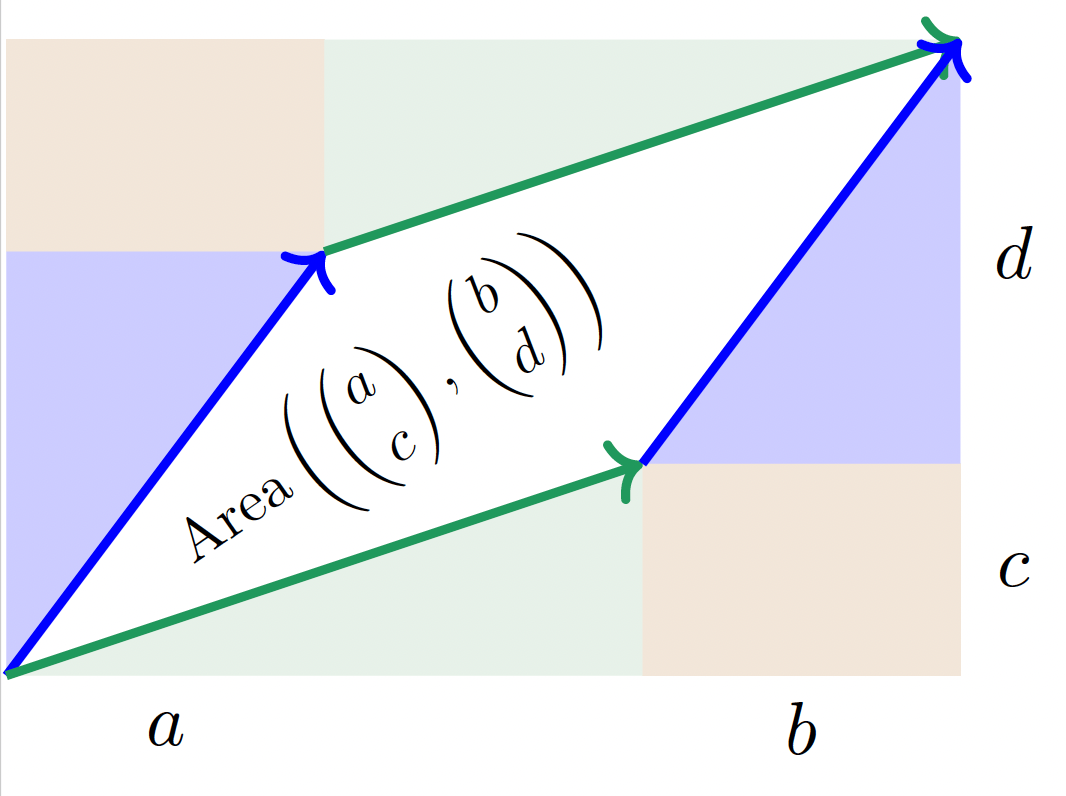
Less easy
\[\text{Area}\left(\begin{bmatrix} a\\ c\end{bmatrix}, \begin{bmatrix} b\\ d\end{bmatrix}\right) = (a+b)(c+d)-2bc-2\frac{1}{2}ac-2\frac{1}{2}bd=ad-bc= \begin{bmatrix} a & b\end{bmatrix}\begin{bmatrix} 0 & 1 \\ -1 & 0 \end{bmatrix}\begin{bmatrix} c\\ d \end{bmatrix}\]
Adjust the Multiplication Table "tensor"
Indirect Area...Even Harder
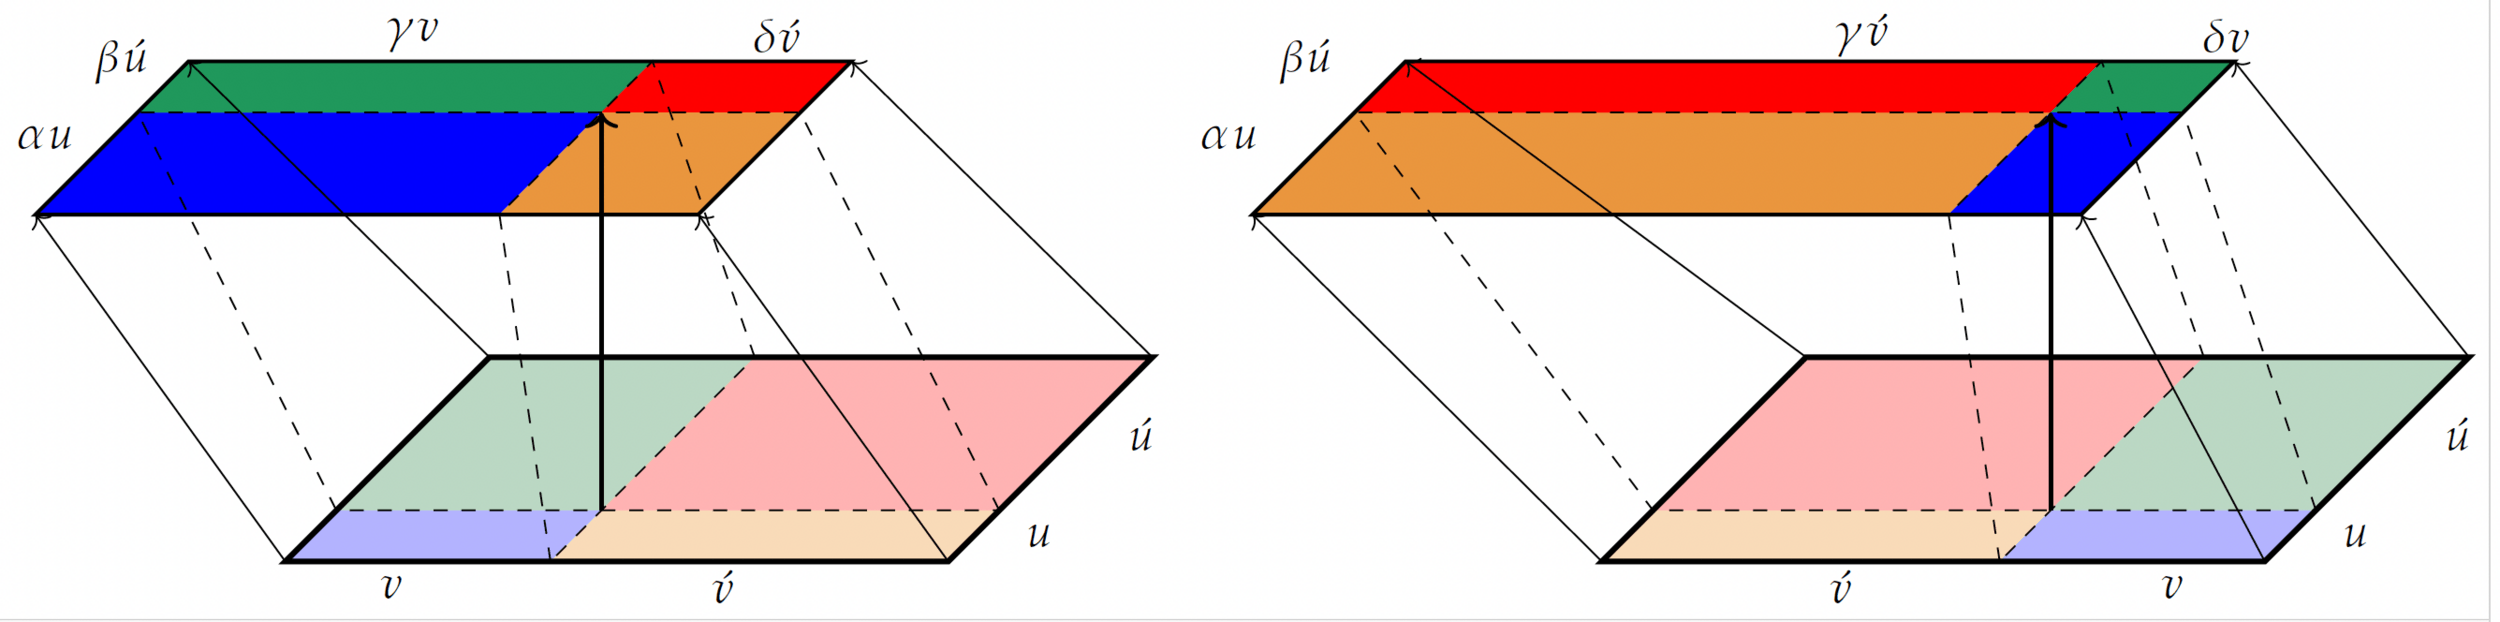
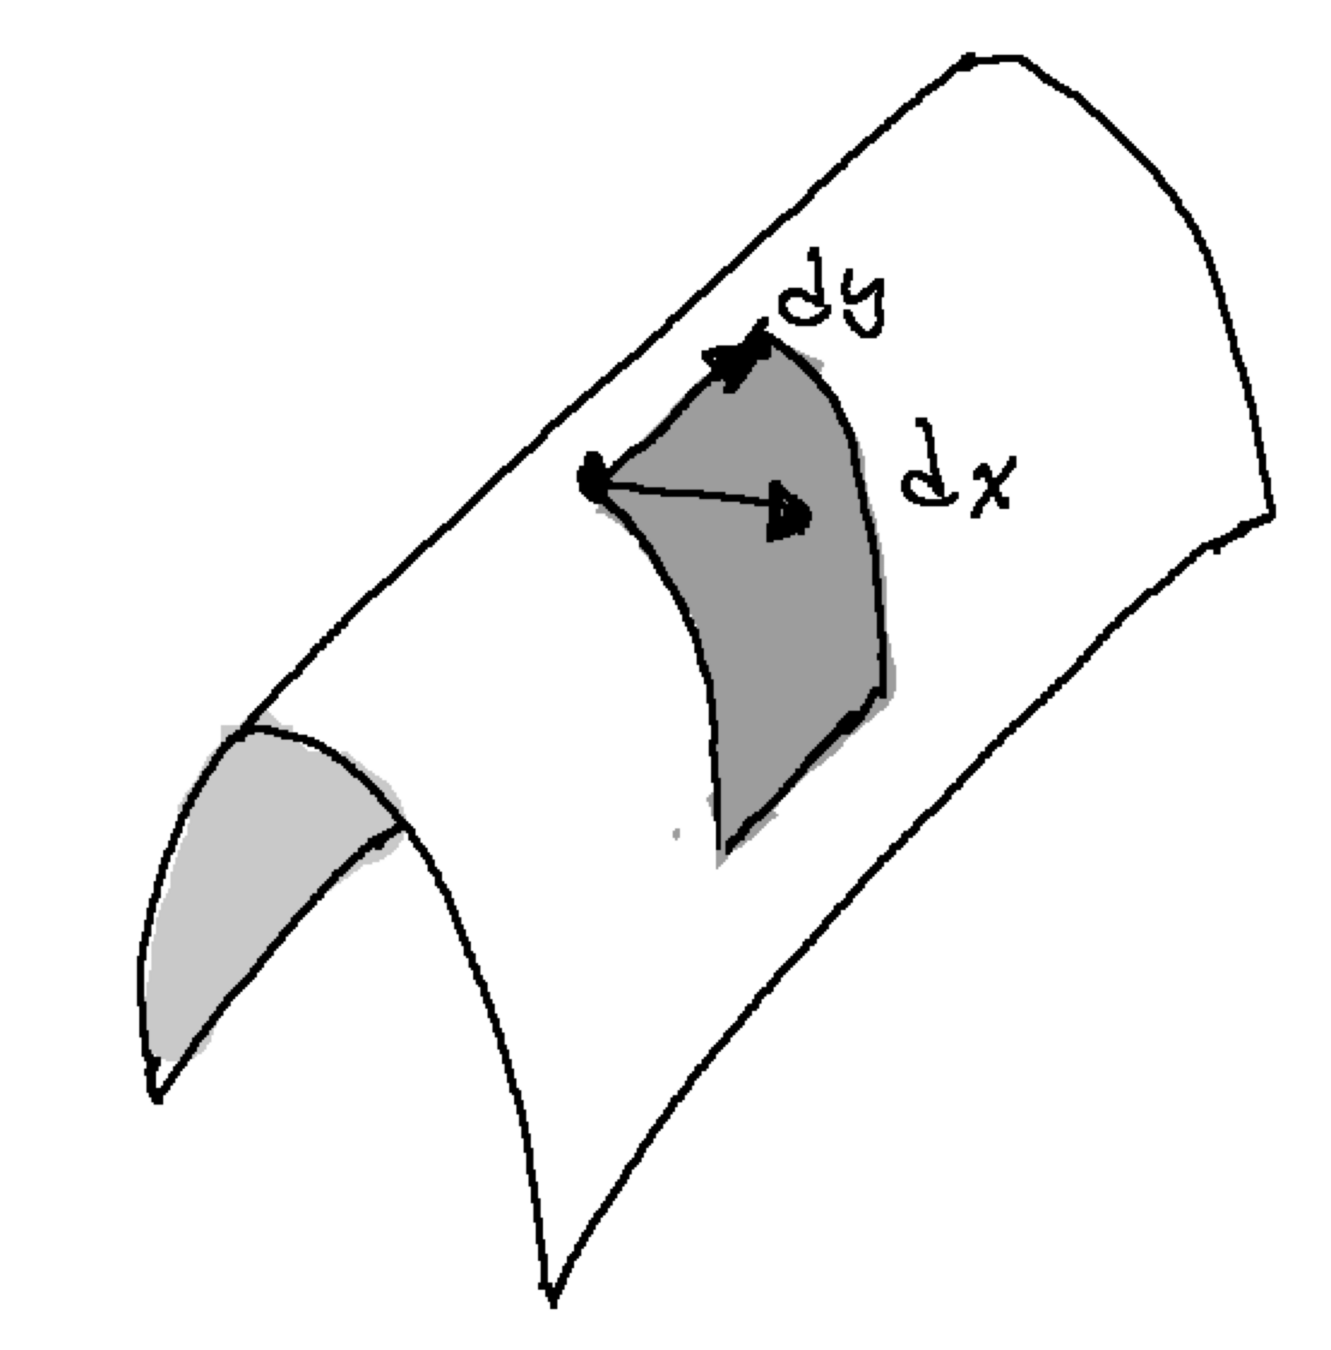
Area/Volume wrapped onto surfaces, measure inputs by proxy \[Jac(x,y)=\begin{bmatrix}\partial_x & \partial_y\end{bmatrix} \begin{bmatrix} 0 & 1 \\ -1 & 0 \end{bmatrix}\begin{bmatrix} x\\ y\end{bmatrix}\]
Proportionate measures add strangely \[p_1\boxplus p_2=\frac{V_1}{V_3}p_1+\frac{V_2}{V_3}p_2\neq p_2\boxplus p_1\] E.g. adding gas pressure or supply/demand.
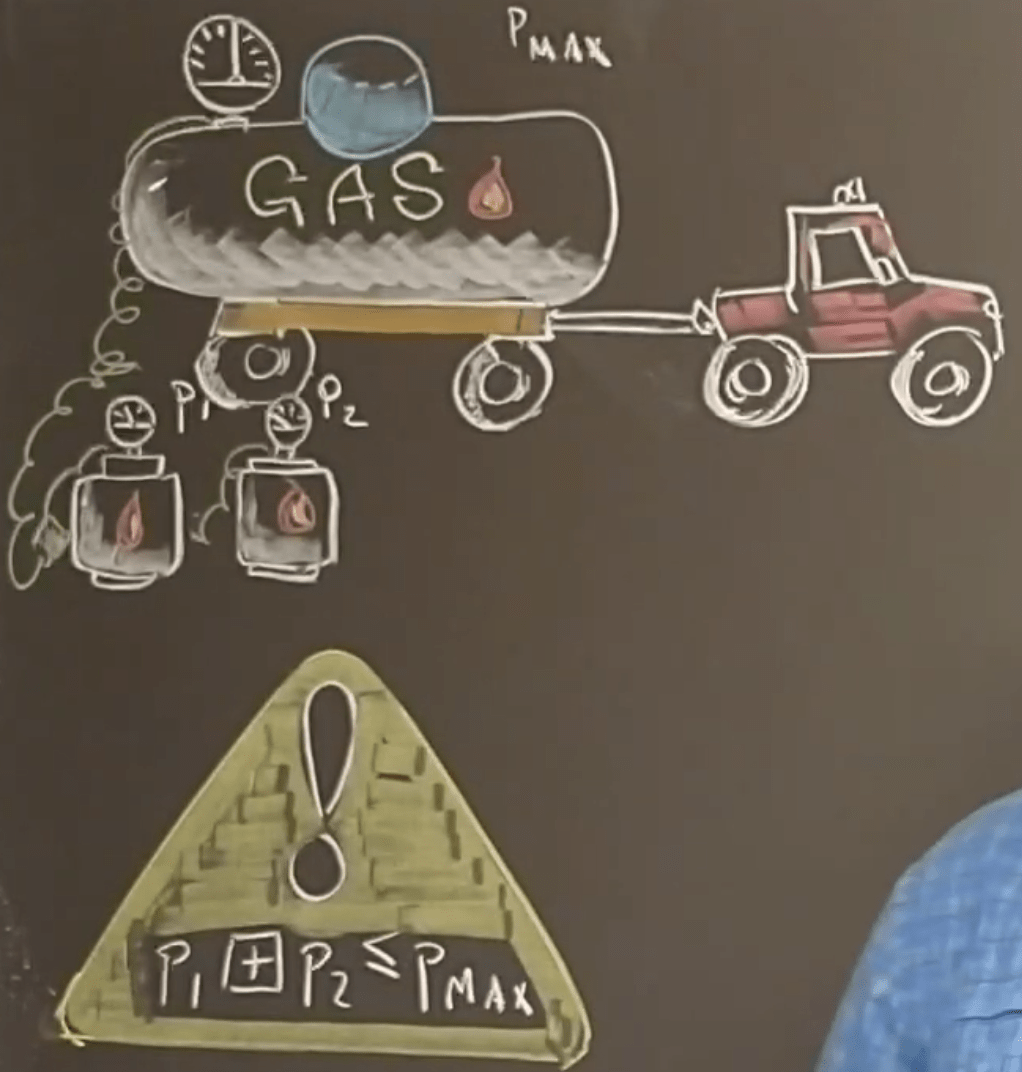
New uses? Make up new measurements
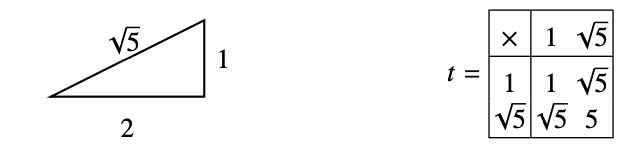
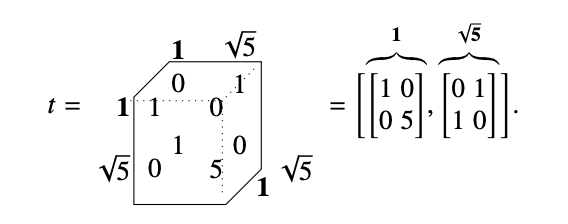
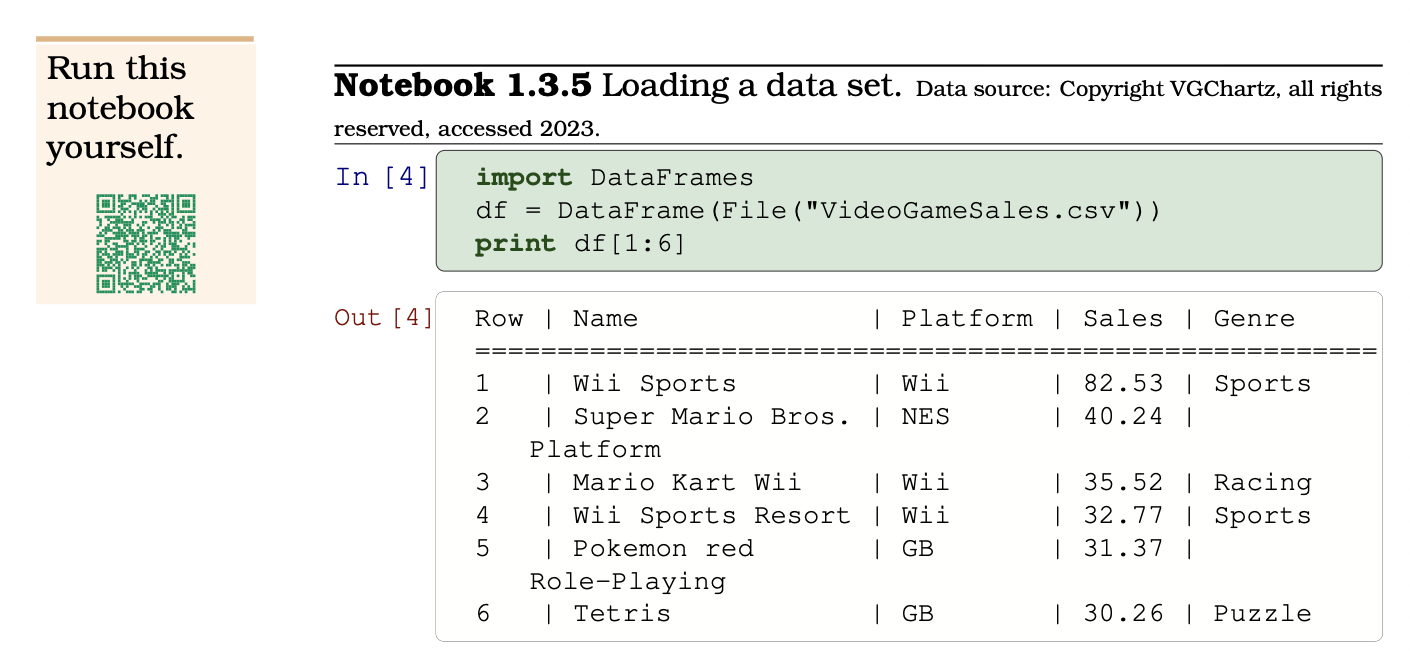
New uses? Sales Volume?
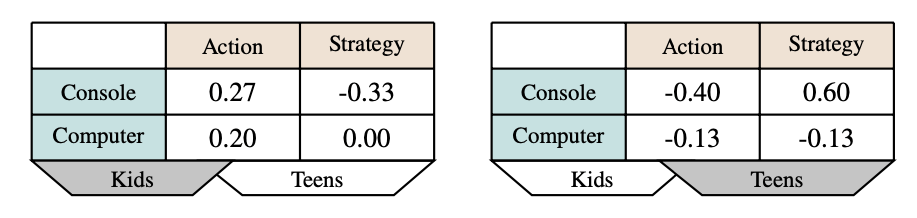
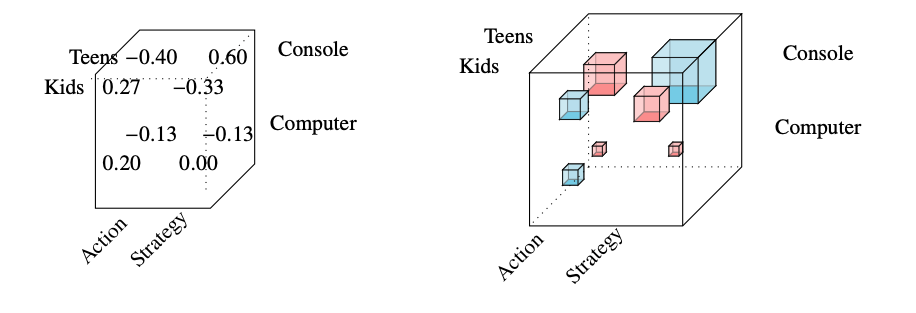
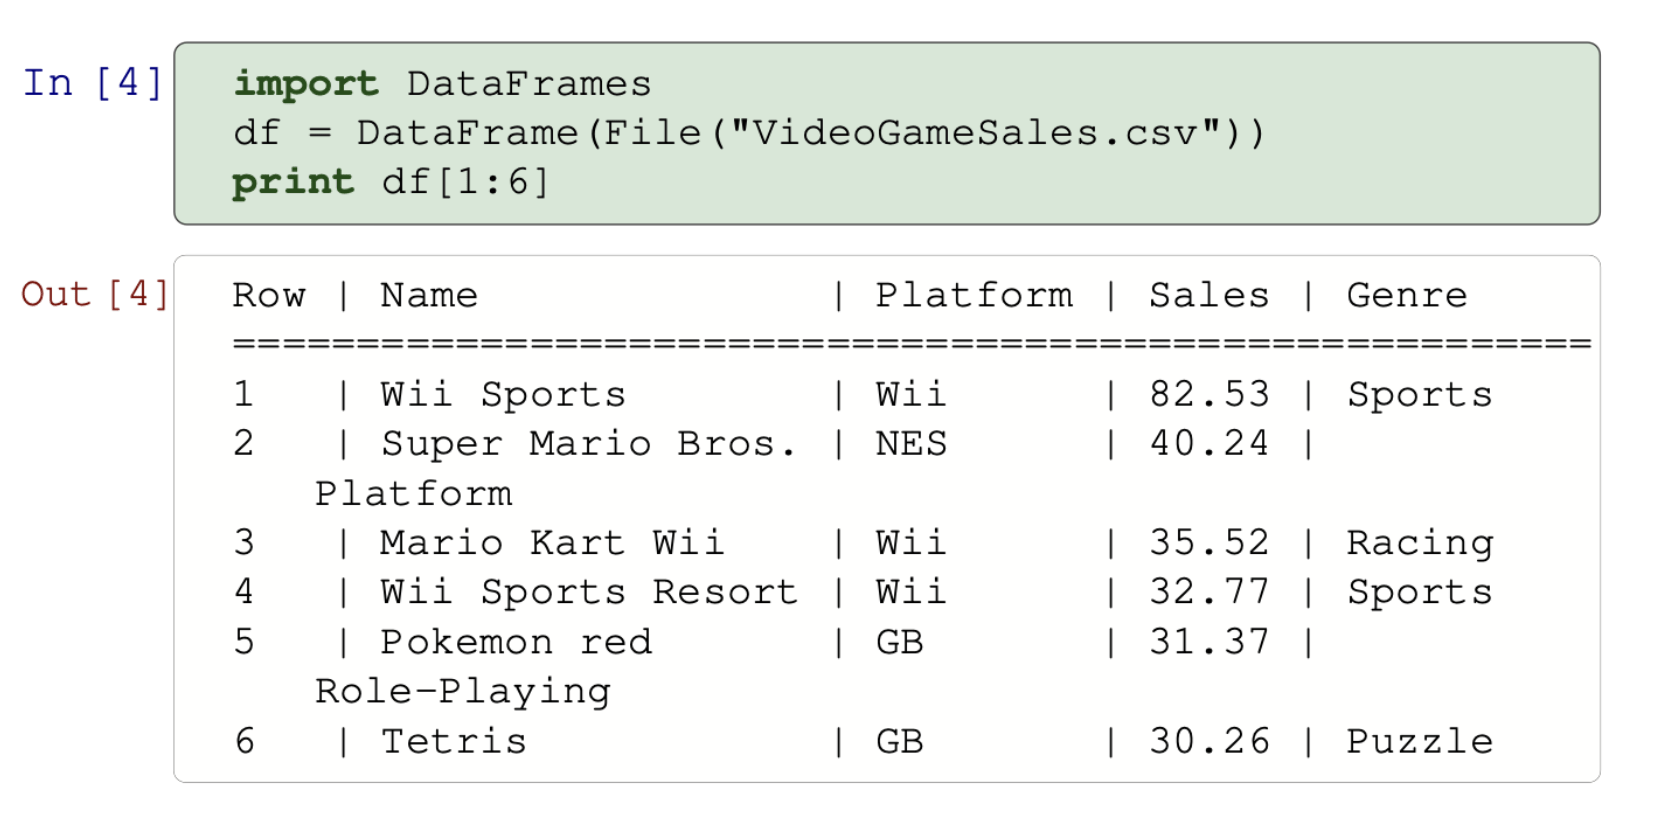
Slightly more honest
Scores from from VSChartz.com in 2021
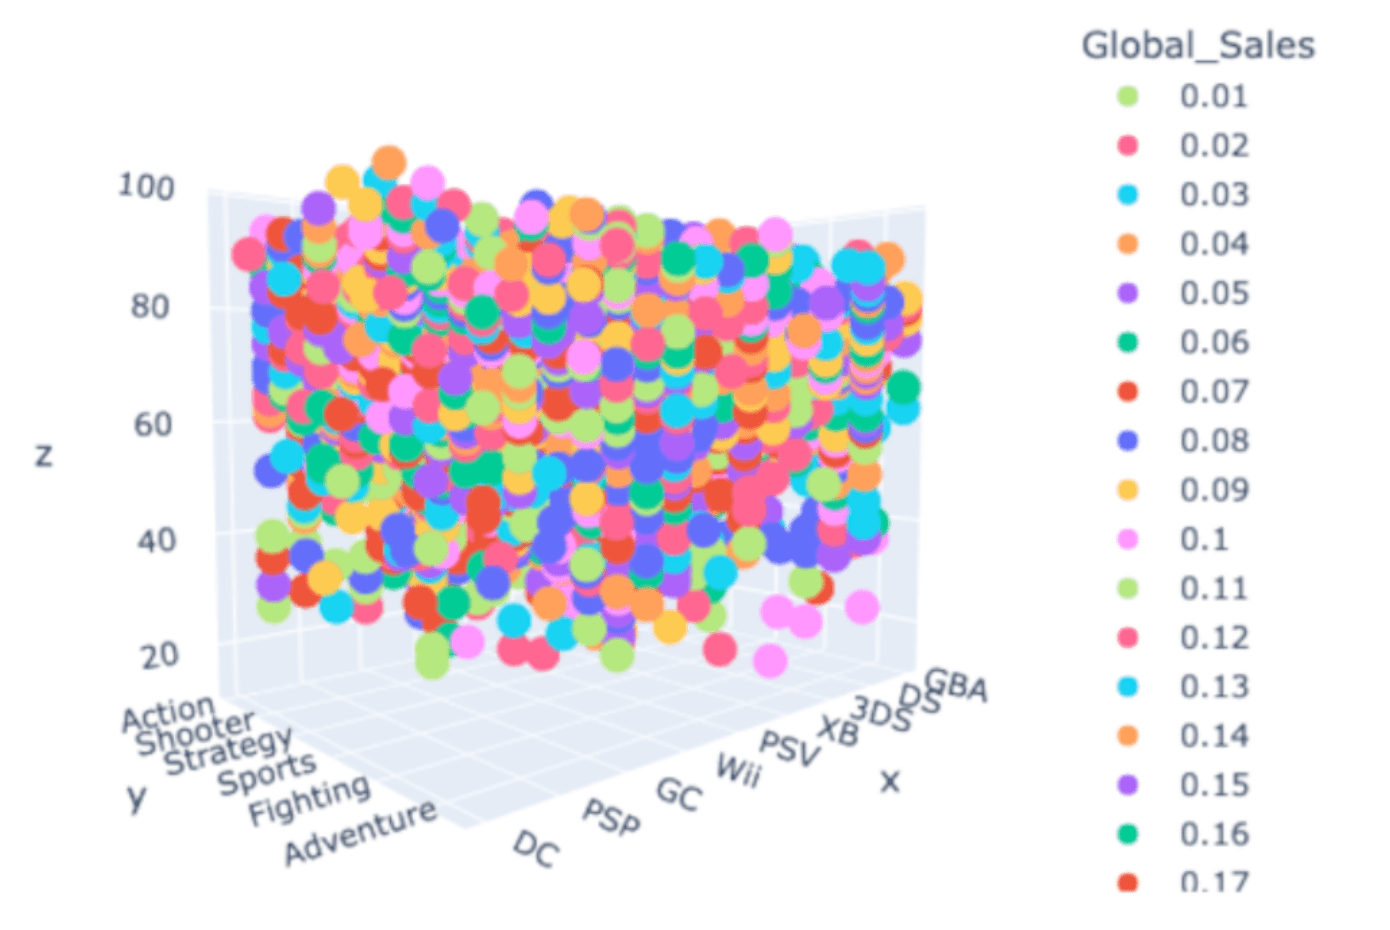
Histogram Visualization

A Tensor is...
data treated as a distributive product
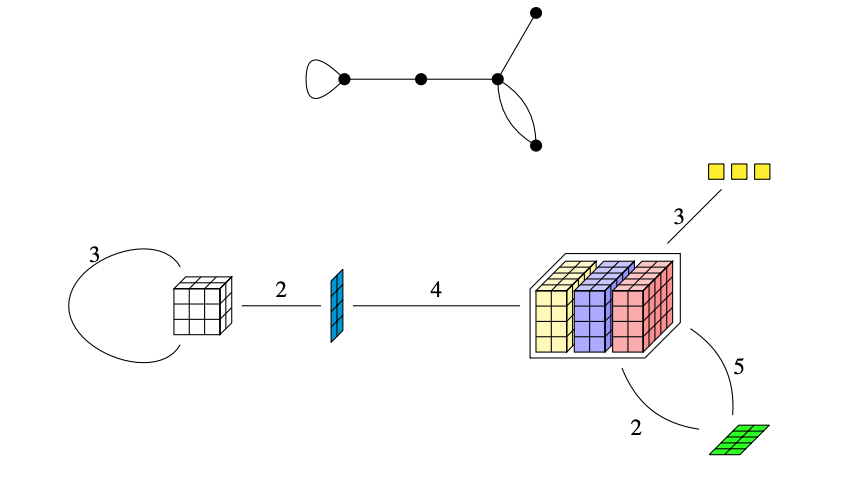
If tensor replace products \(xyz\) then networks replace polynomials

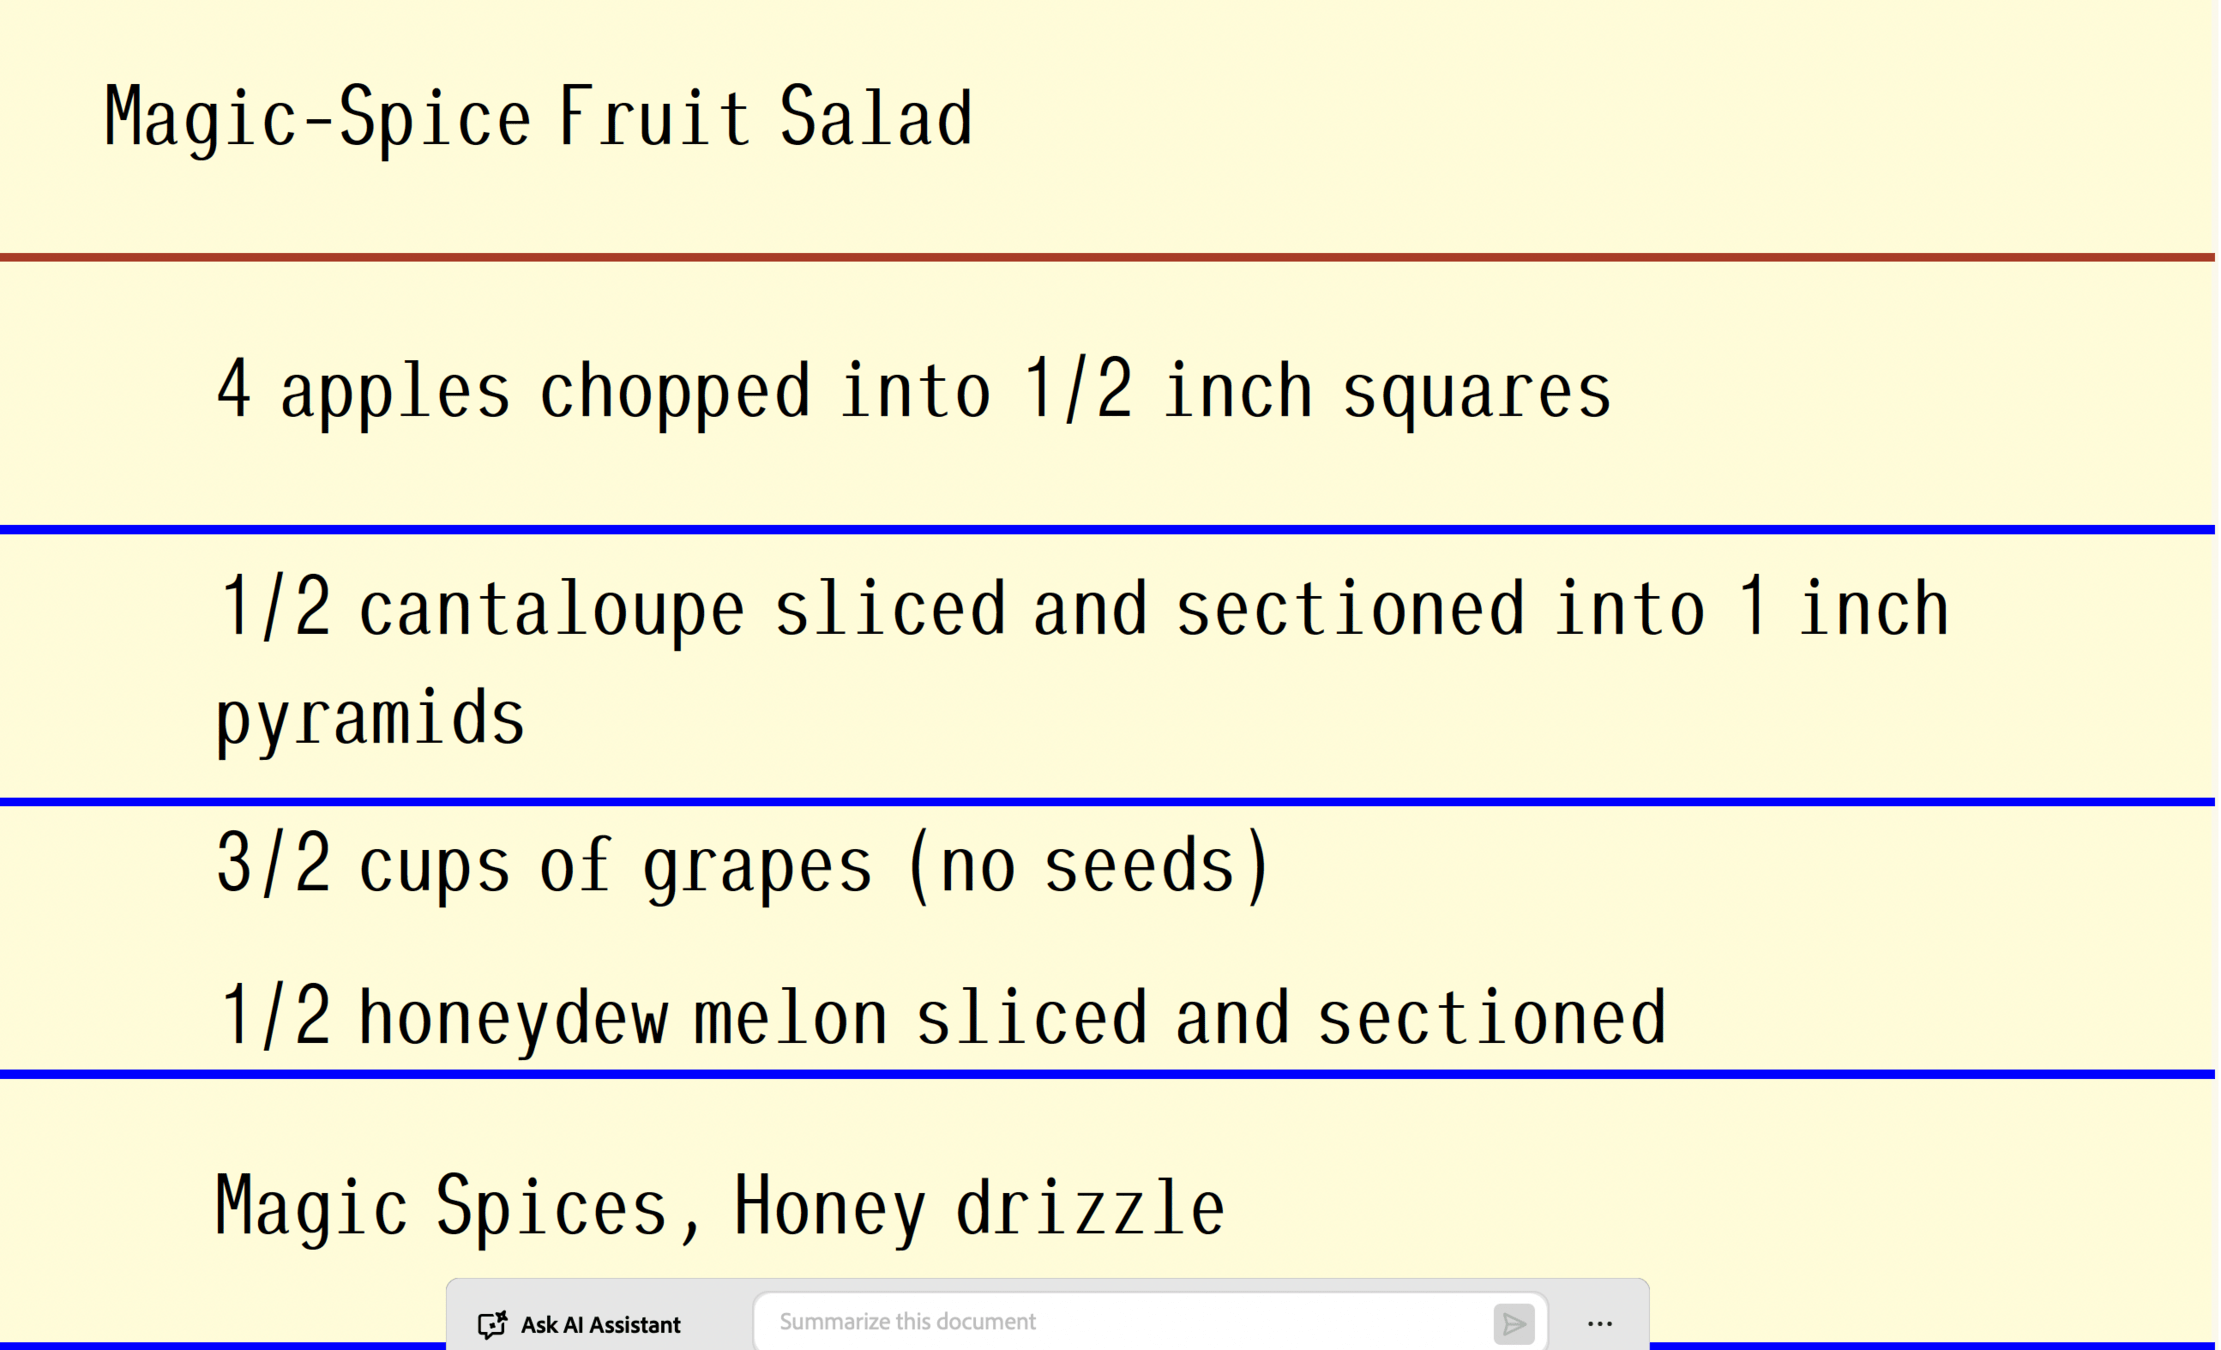
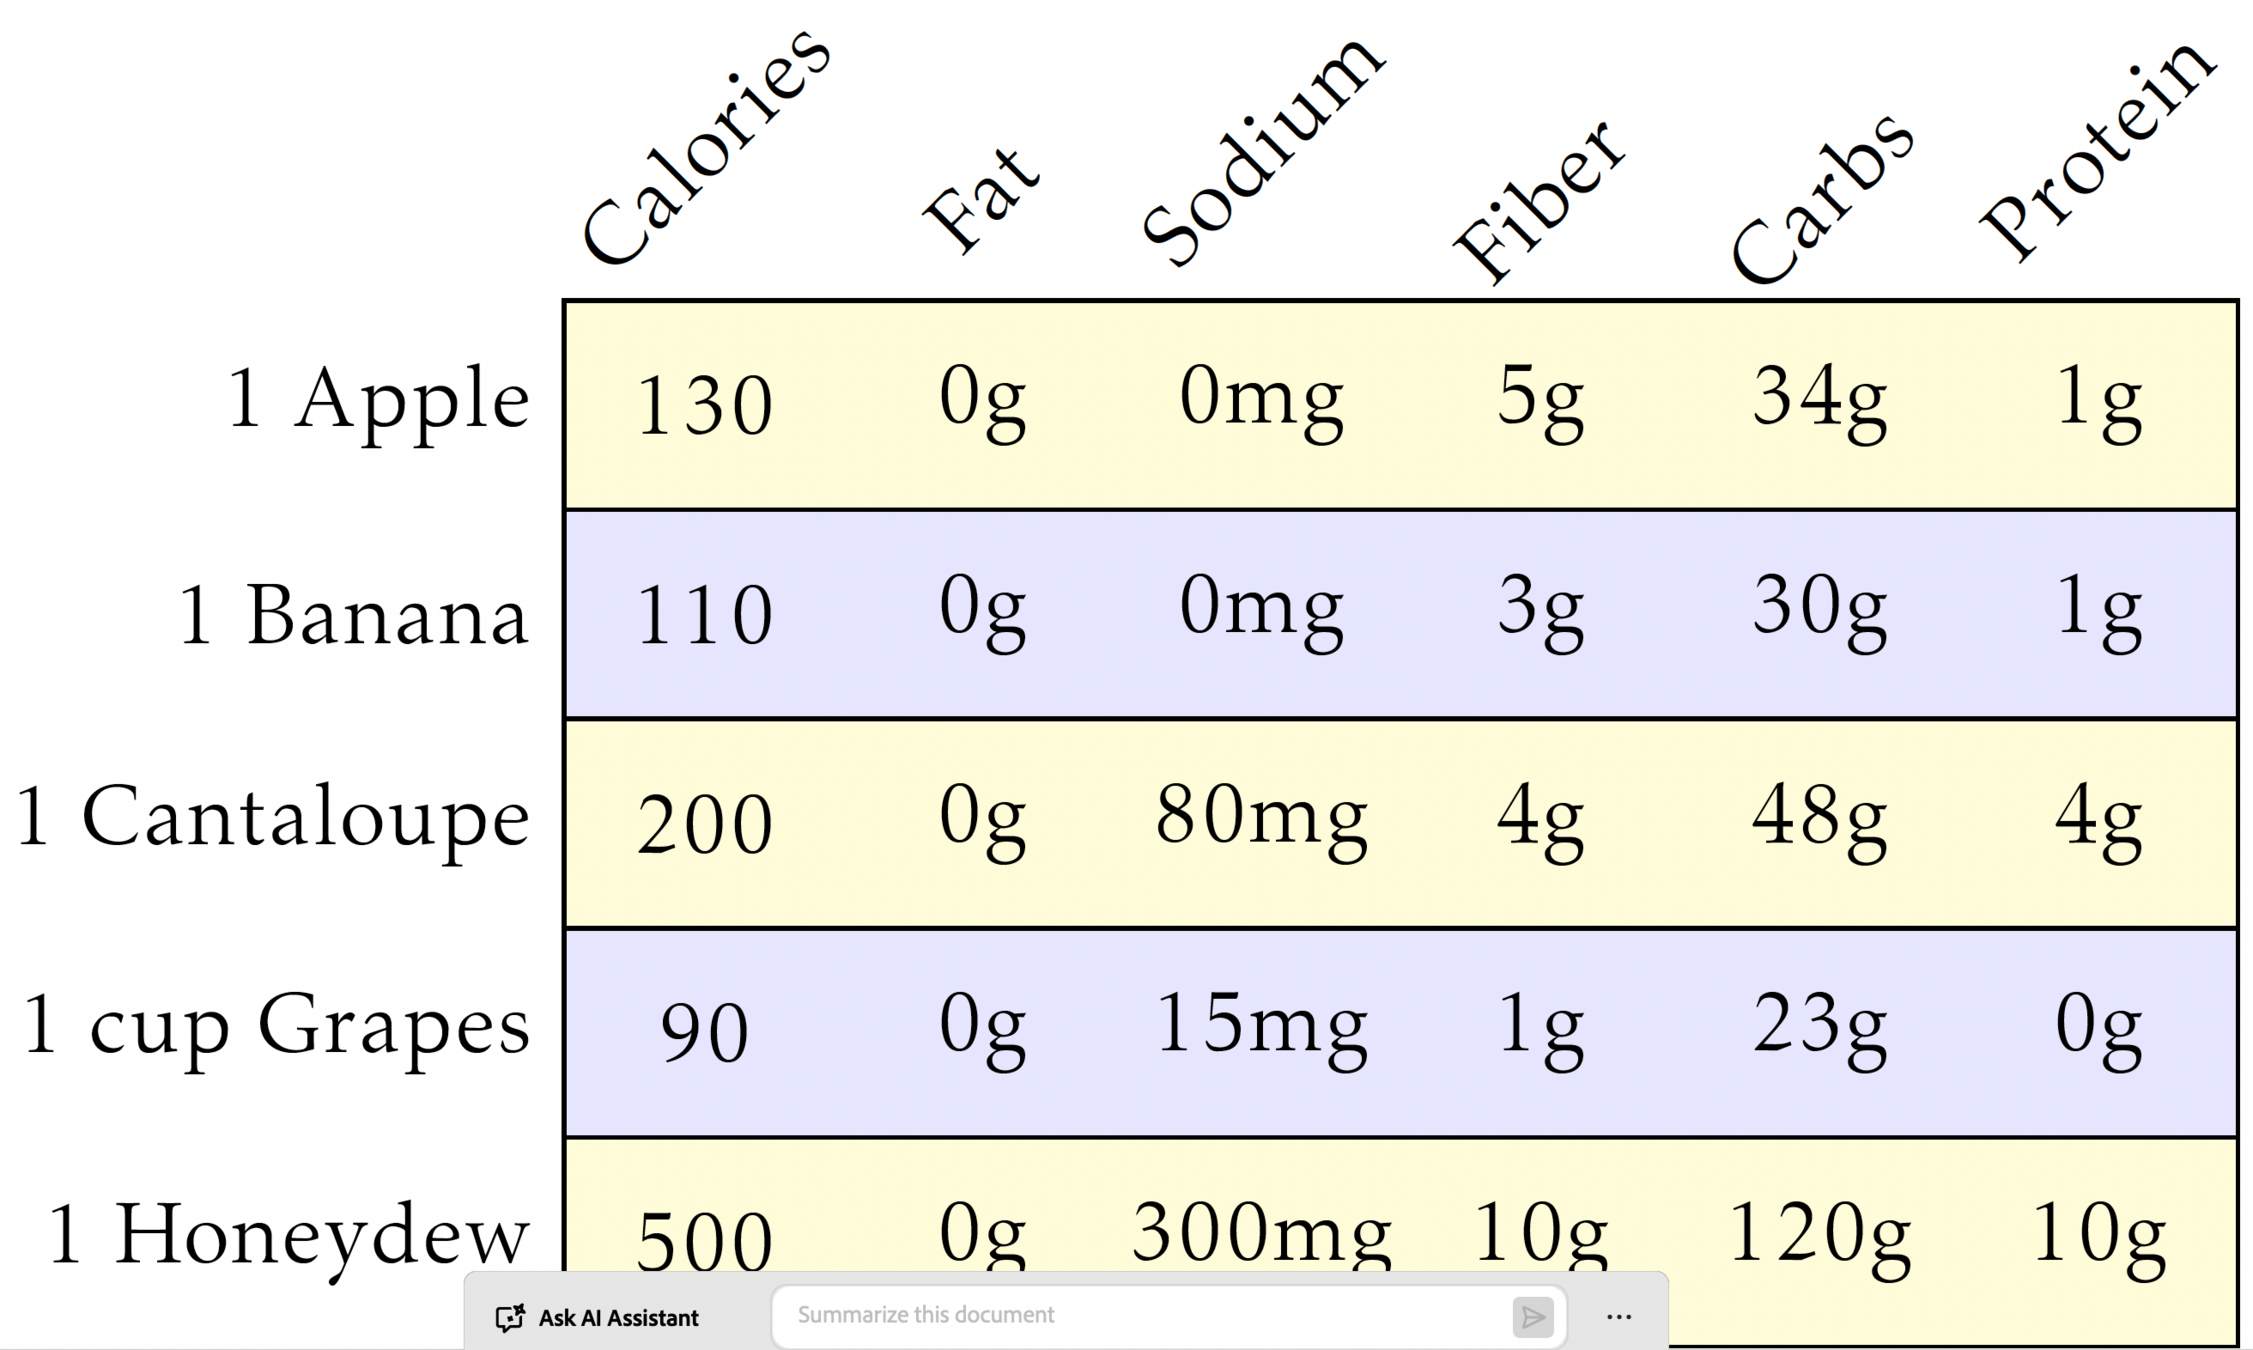
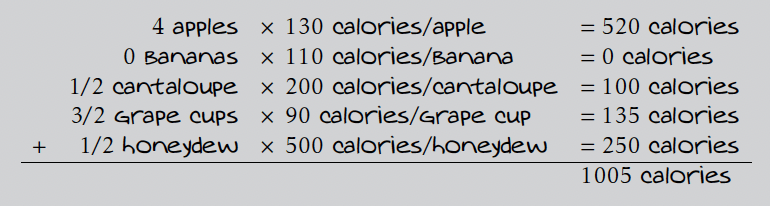
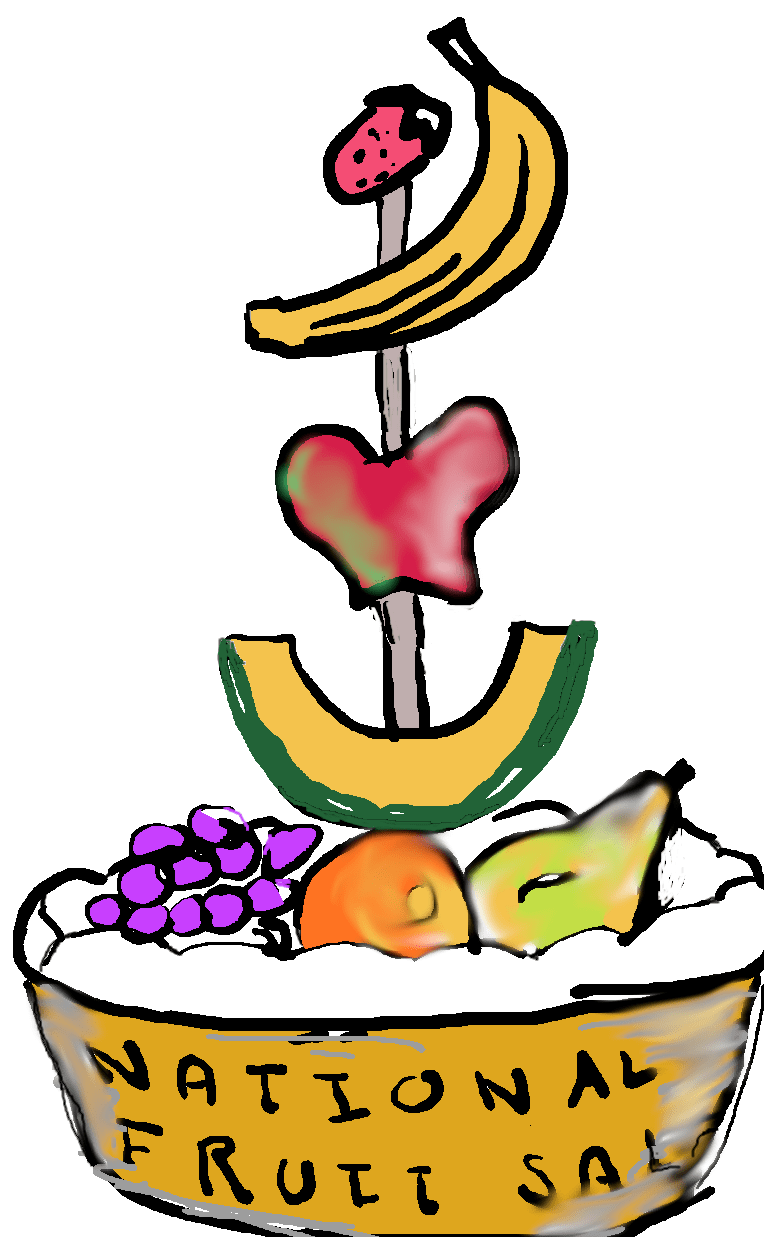
- Goal: Locate nutrition of fruit salad.
- Problem: Data table has no fruit salad row.
Solution: compute the combination of rows specified by the recipe.
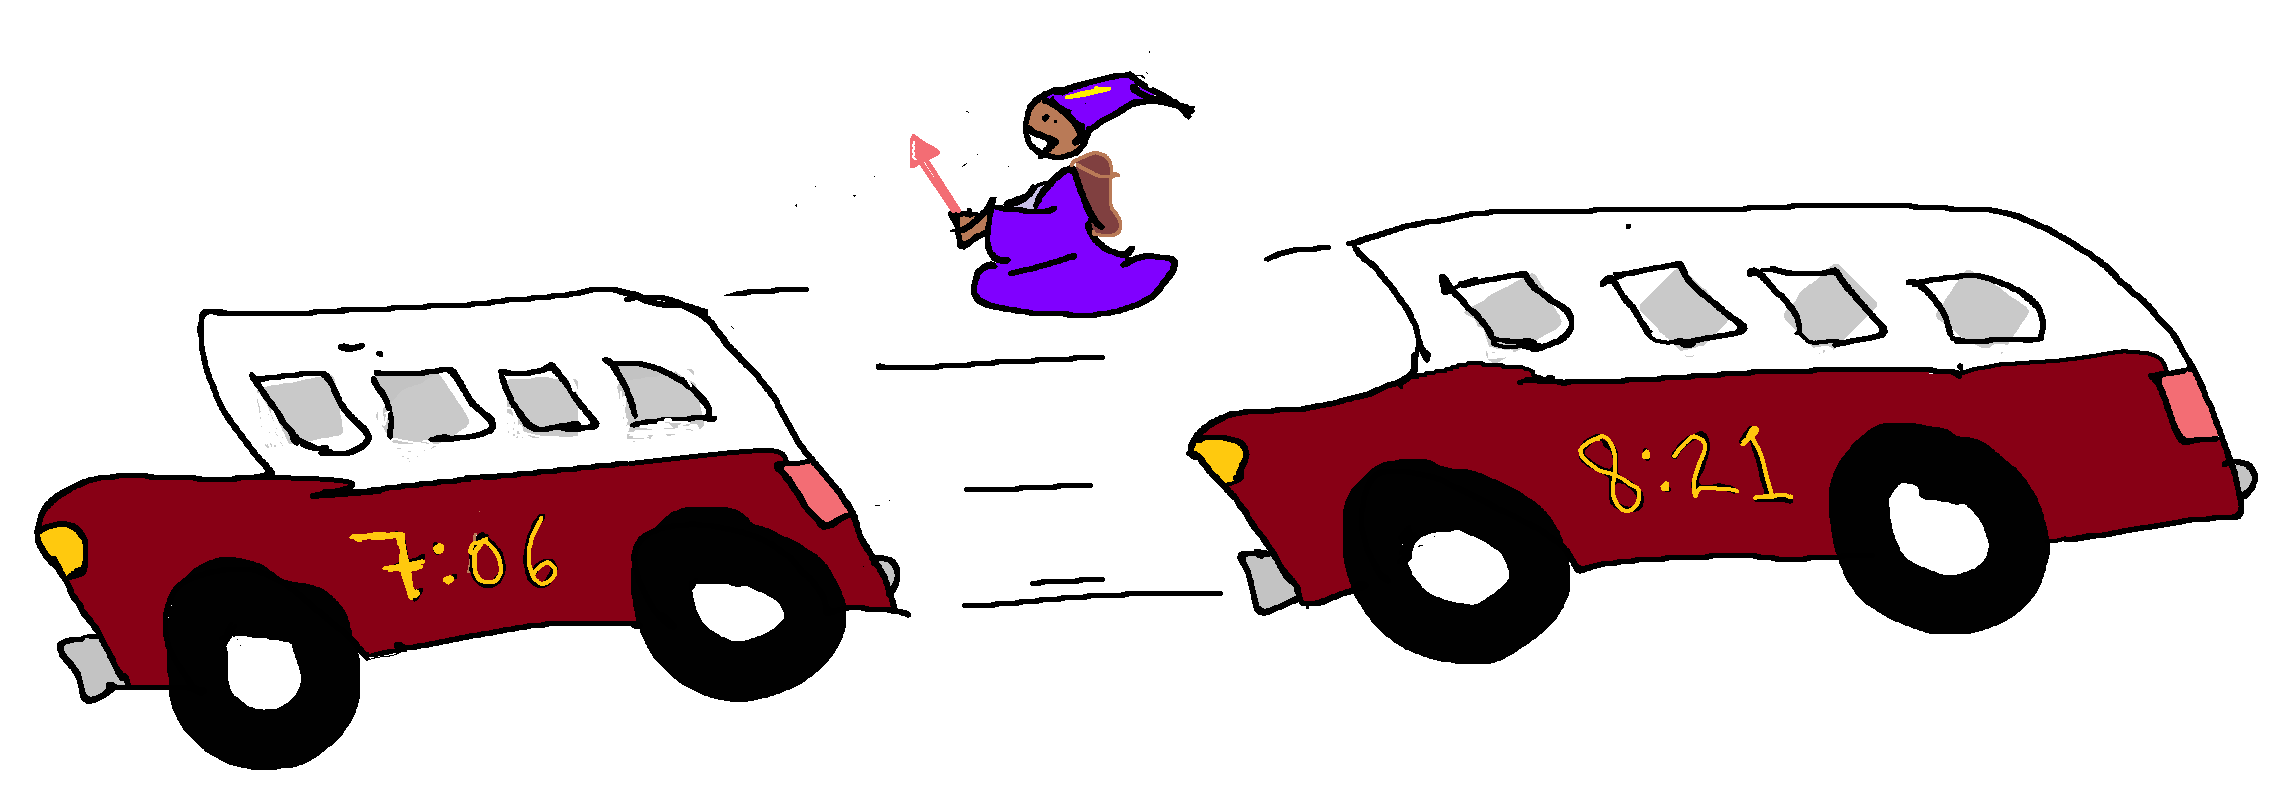
Lewisberg --- Harrisburg
18:00 ---- 20:30
19:00 ---- 21:30
Lewisberg --- Harrisburg
0.5 * 18:00 ---- 20:30
+ 0.5 * 19:00 ---- 21:30
-------------------------------------
18:30 ---- 21:00
- Goal: Arrive in Harrisburg at 21:00
- Problem: Data only has 20:30 and 21:30
Solution: Use the recipe
1/2 of bus 1 and 1/2 bus 2!
Linear data: Information is in the combinations of the table, i.e. data table => Multiplication table
Consequence: You can change coordinates!
Back to Patterns
What are the GAME markets?
Data table --> Multiplication table
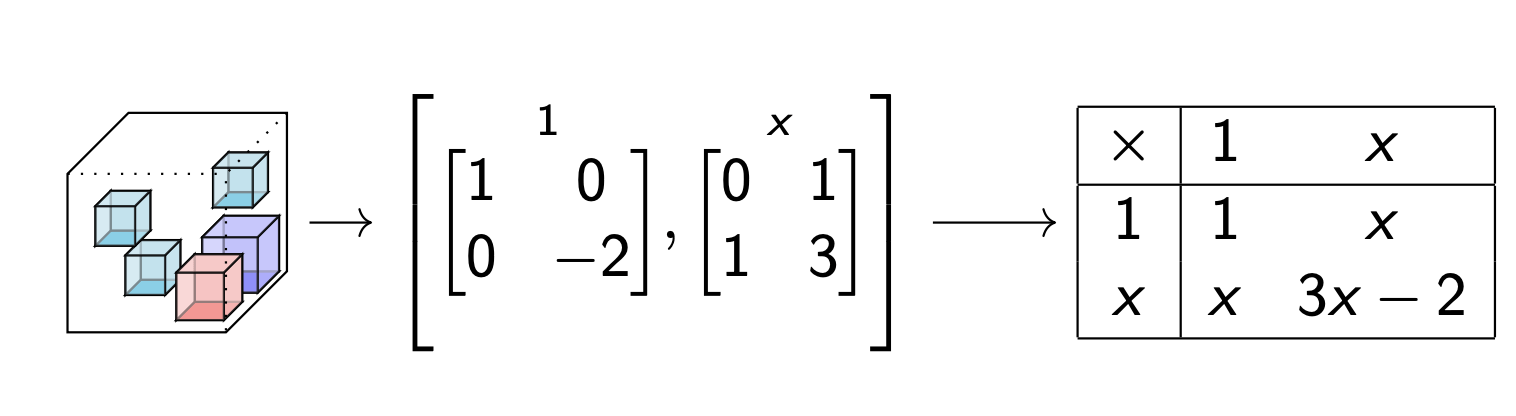
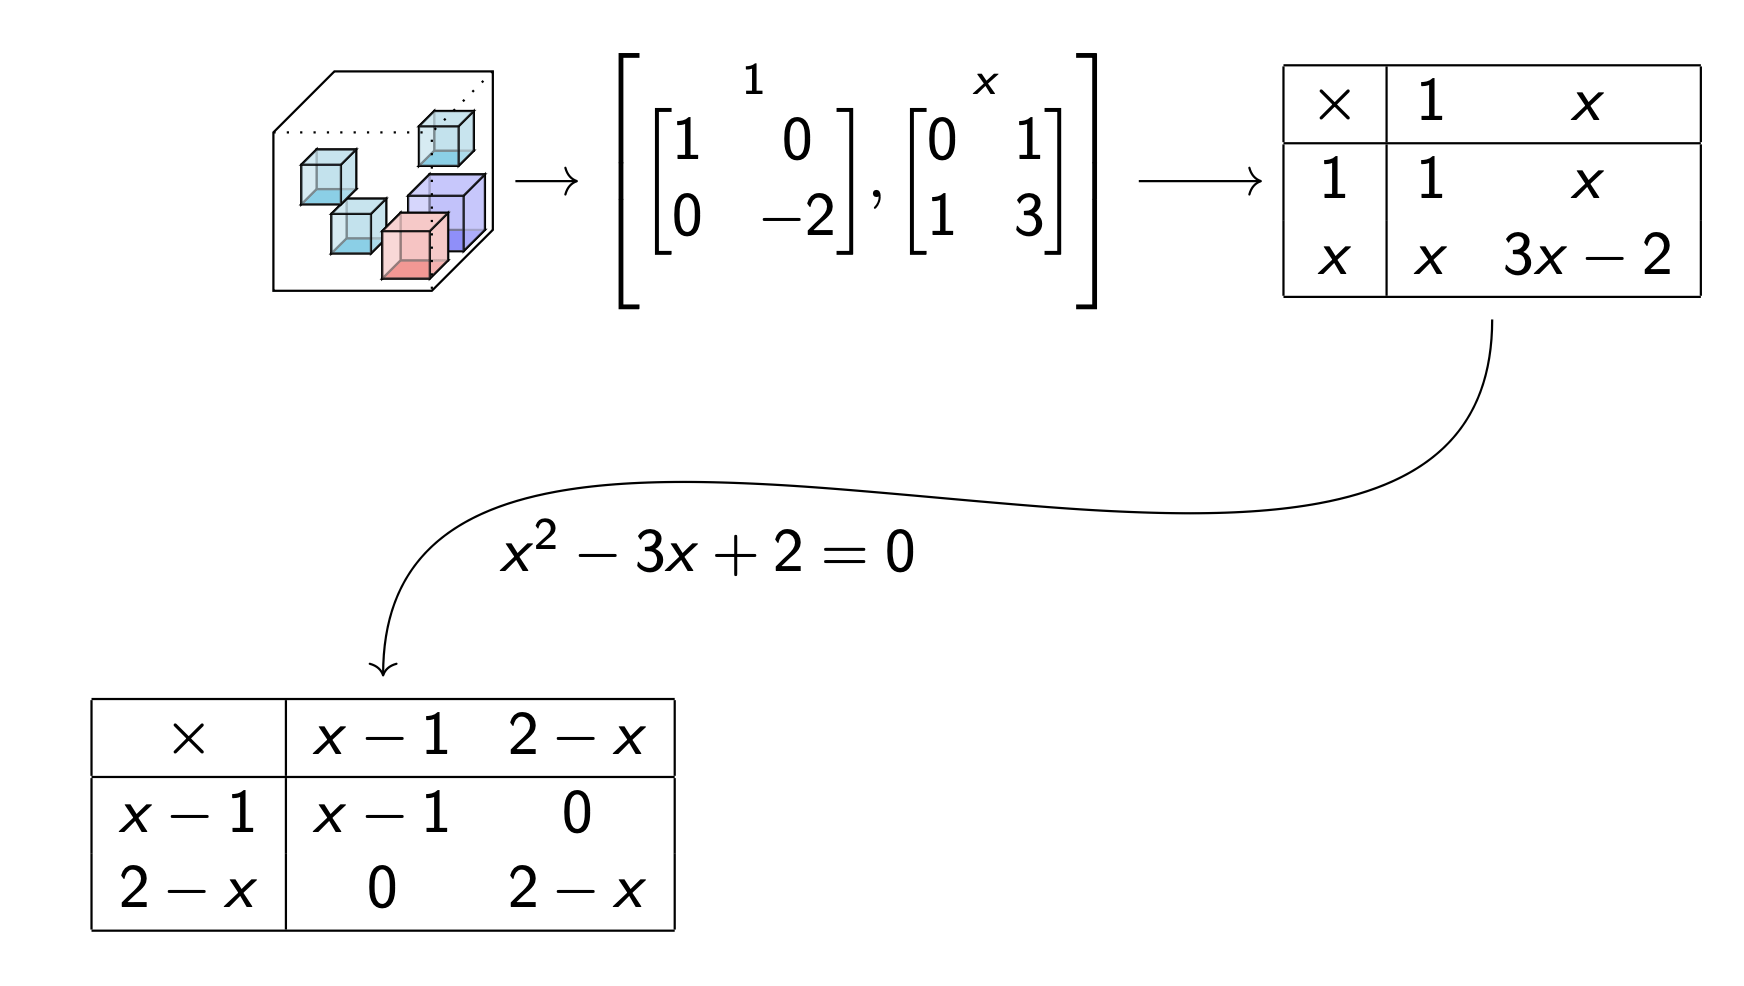
Use algebra to factor
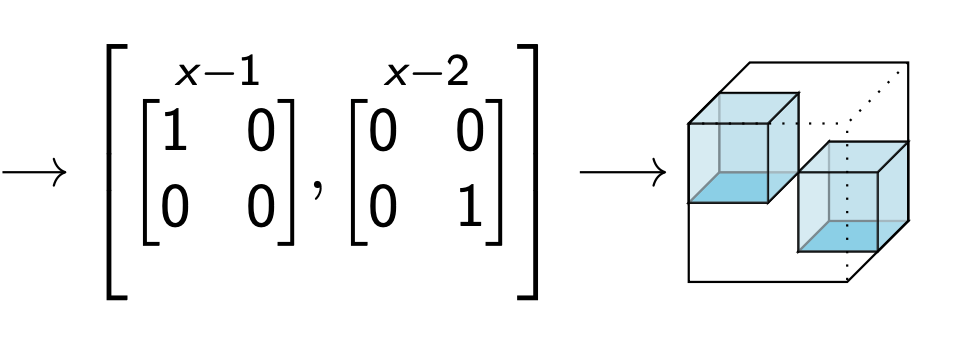
Ok... Now Factor This?
Or this...
Yes, even movies can be tensors...
Finding Good Algebra in Real Life
How do you study something curved?
How do you study something curved?
With lines tangent to it!
Product Rule:
\[D(x*y)=D(x)*y+x*D(y)\]
We can do this on ANY tensor, and notice D is linear (exponent 1)
The main fact:\[A*B=0\Rightarrow A=0\text{ or } B=0\]
Experts: A is a scalar, B is a vector
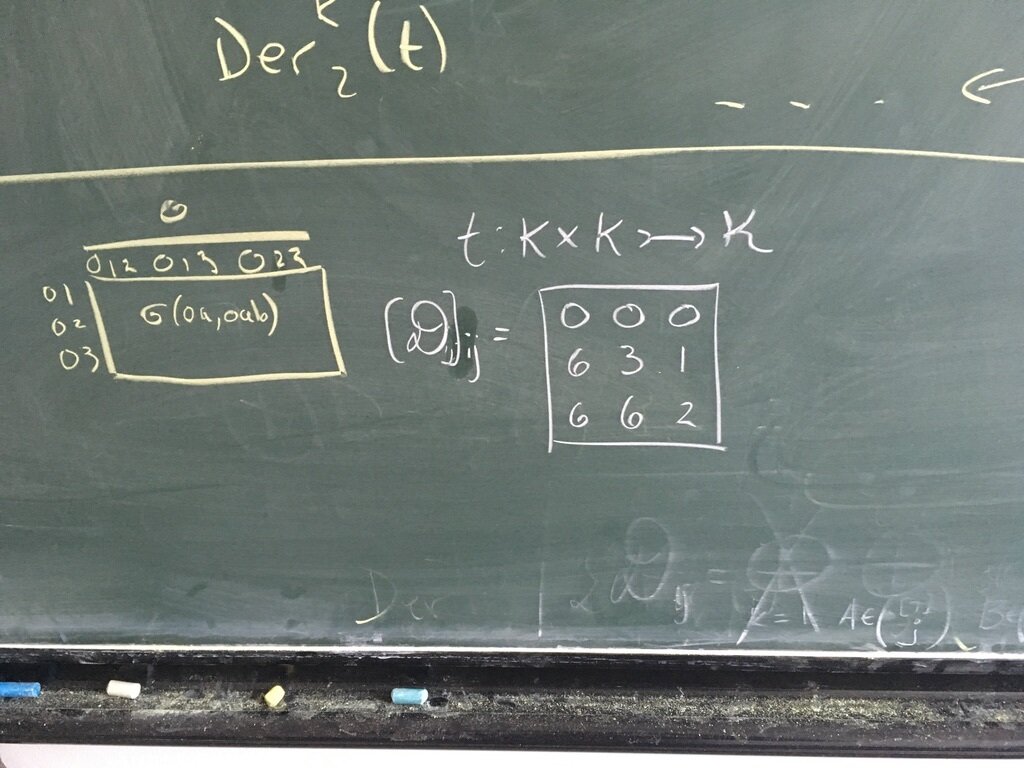
- \(D_0 (x*y) = D_1(x)*y+ x*D_2(y)\)
- \(D_0 (x*y) - D_1(x)*y - x*D_2(y) = 0\)
- \(5 (x*y) - 3x*y +2 x*y = 0\)
- \((5- 3+2)(x*y) = 0\)
- So \(x*y=0\)! I.e. a pattern! \[\begin{array}{c|ccc|} * & \cdots & y & \cdots \\ \hline \vdots & ? & ? & ? \\ x & ? & 0 & ?\\ \vdots & ? & ? & ? \\ \hline \end{array}\]
If \(D_0(x*y)=5(x*y)\), \(D_1(x)=3x\) and \(D_2(y)=-2y\). [True for Eigenvectors]
1
1
2
2
3
4
3
5
6
X Row
Y Col
Z= Page
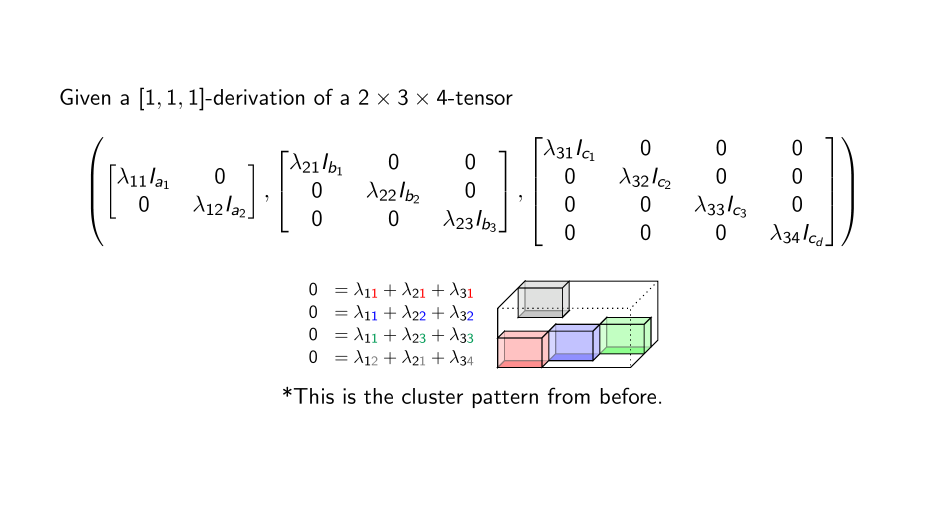
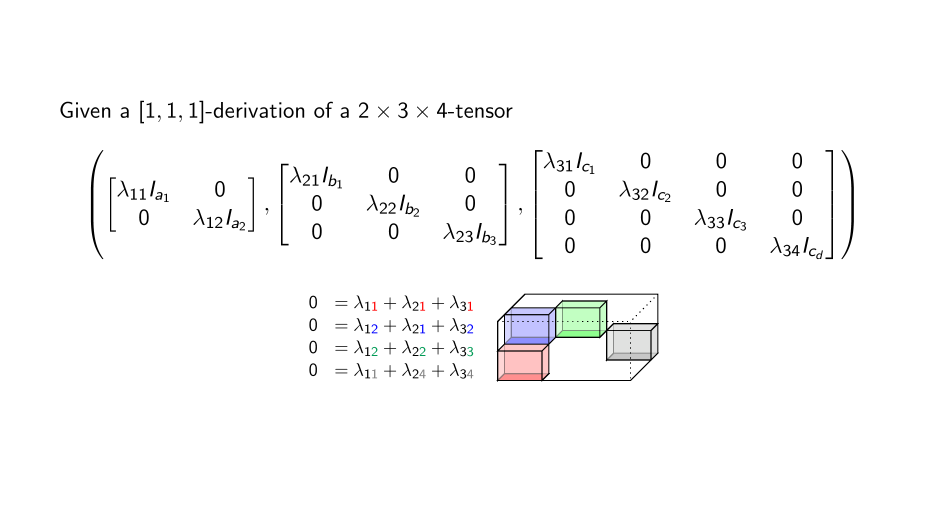
(X,Y,Z) where \[Z(u*v)=(Xu)*v+u*(Yv)\] look for \(z=x+y\)
2= 1 + 1
3= 1 + 2
4= 1 + 3
6= 5 + 1
First every universal chisel!
Generalize!
"Chisels" are selections of equations and constraints on the derivations, e.g.:\[C=\begin{bmatrix} 12 & 4 & -2 & 13\\ -1 & 0 & 1 & 5 \end{bmatrix}\] together with \[A=A^{\dagger}, B=Diag(B), C=D\]
They control what patterns can be discovered.
Theorem. (Brooksbank-Kassabov-W.) Chisels detect cluster patterns in time \(O(n^{2})\).
- Tucker (vector space) chisels \[\begin{bmatrix} 1 & 0 & 0 \end{bmatrix},\begin{bmatrix} 1 & 0 & 0 \\ 0 & 1 & 0 \end{bmatrix},\begin{bmatrix} 1 & 0 & 0 \\ 0 & 1 & 0 \\ 0 & 0 & 1 \end{bmatrix}\]
- Centroids (commutative ring) chisels\[\begin{bmatrix} 1 & 0 & -1 \\ 0 & 1 & -1 \end{bmatrix}\]
- Adjoints (ring with involution) chisels \[\begin{bmatrix} 1 & -1 & 0 \end{bmatrix}\]
- Derivations (Lie algebra) chisels\[\begin{bmatrix} 1 & 1 & -1 \end{bmatrix}\]
- In 4+ valence there \(\infty\) types.
Liu-Maglione-W.
Now \(O(n^{1+1/d})\) on average.
Theorem. Clusters you detect are essentially unique, because of the algebra.
- (Folklore) Tucker (vector space) unique, greedy solve.
- (Eberly-Giesbrecht 1990, W.08) Centroids (commutative ring) have unique patterns.
- (Parker-Norton MeatAxe, 1980's Ronyai, 1990's) (W.08, Maehara-Murota 10) Adjoints (ring with involution) have conjugate patterns.
- (BKW 2020's) Derivations (Lie algebra) unique over \(\mathbb{C}\)
REPORDUCIBLE
Is it useful?
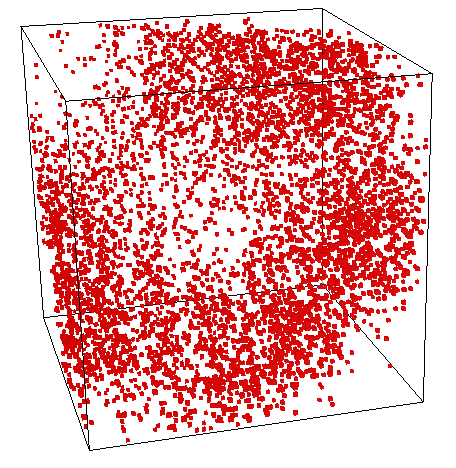
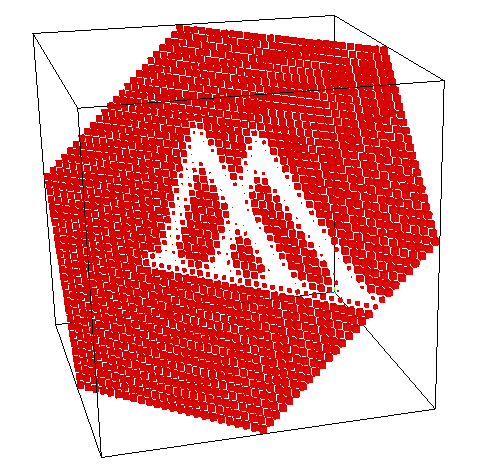
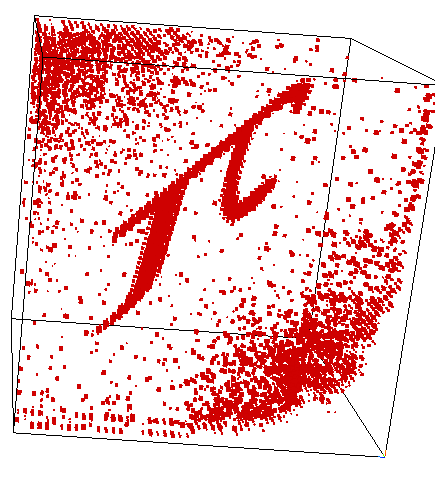
"Random" Basis Change
Blind source separation
Oulier Detection
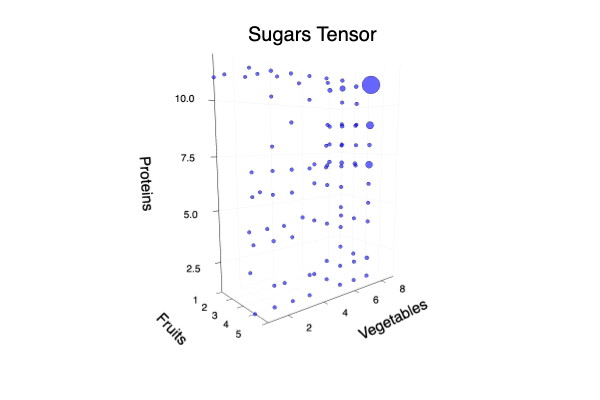
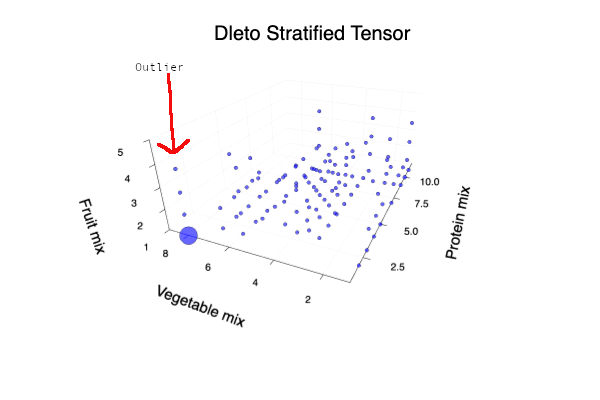
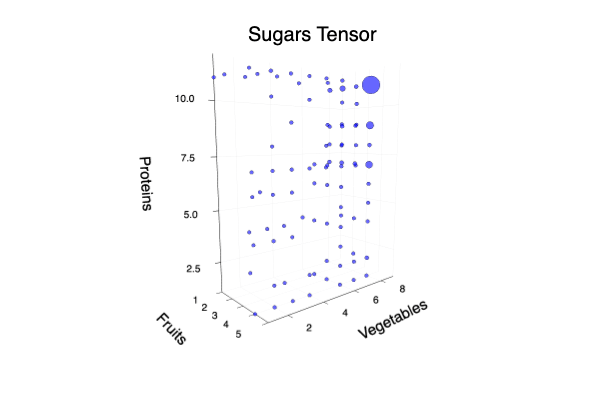
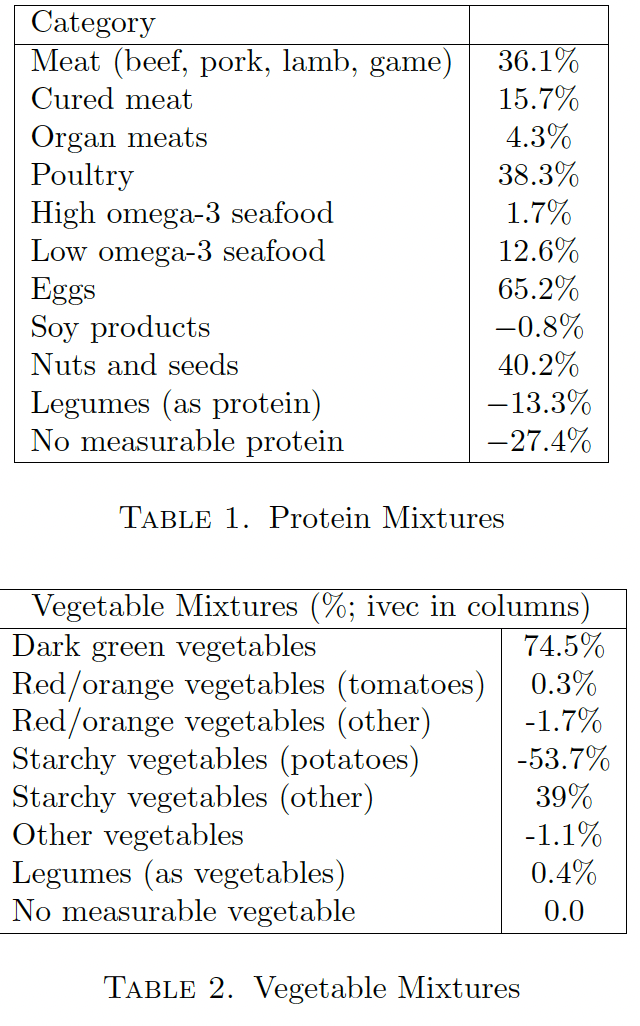
USDA Study "What We Eat in America" (add sugars data) .
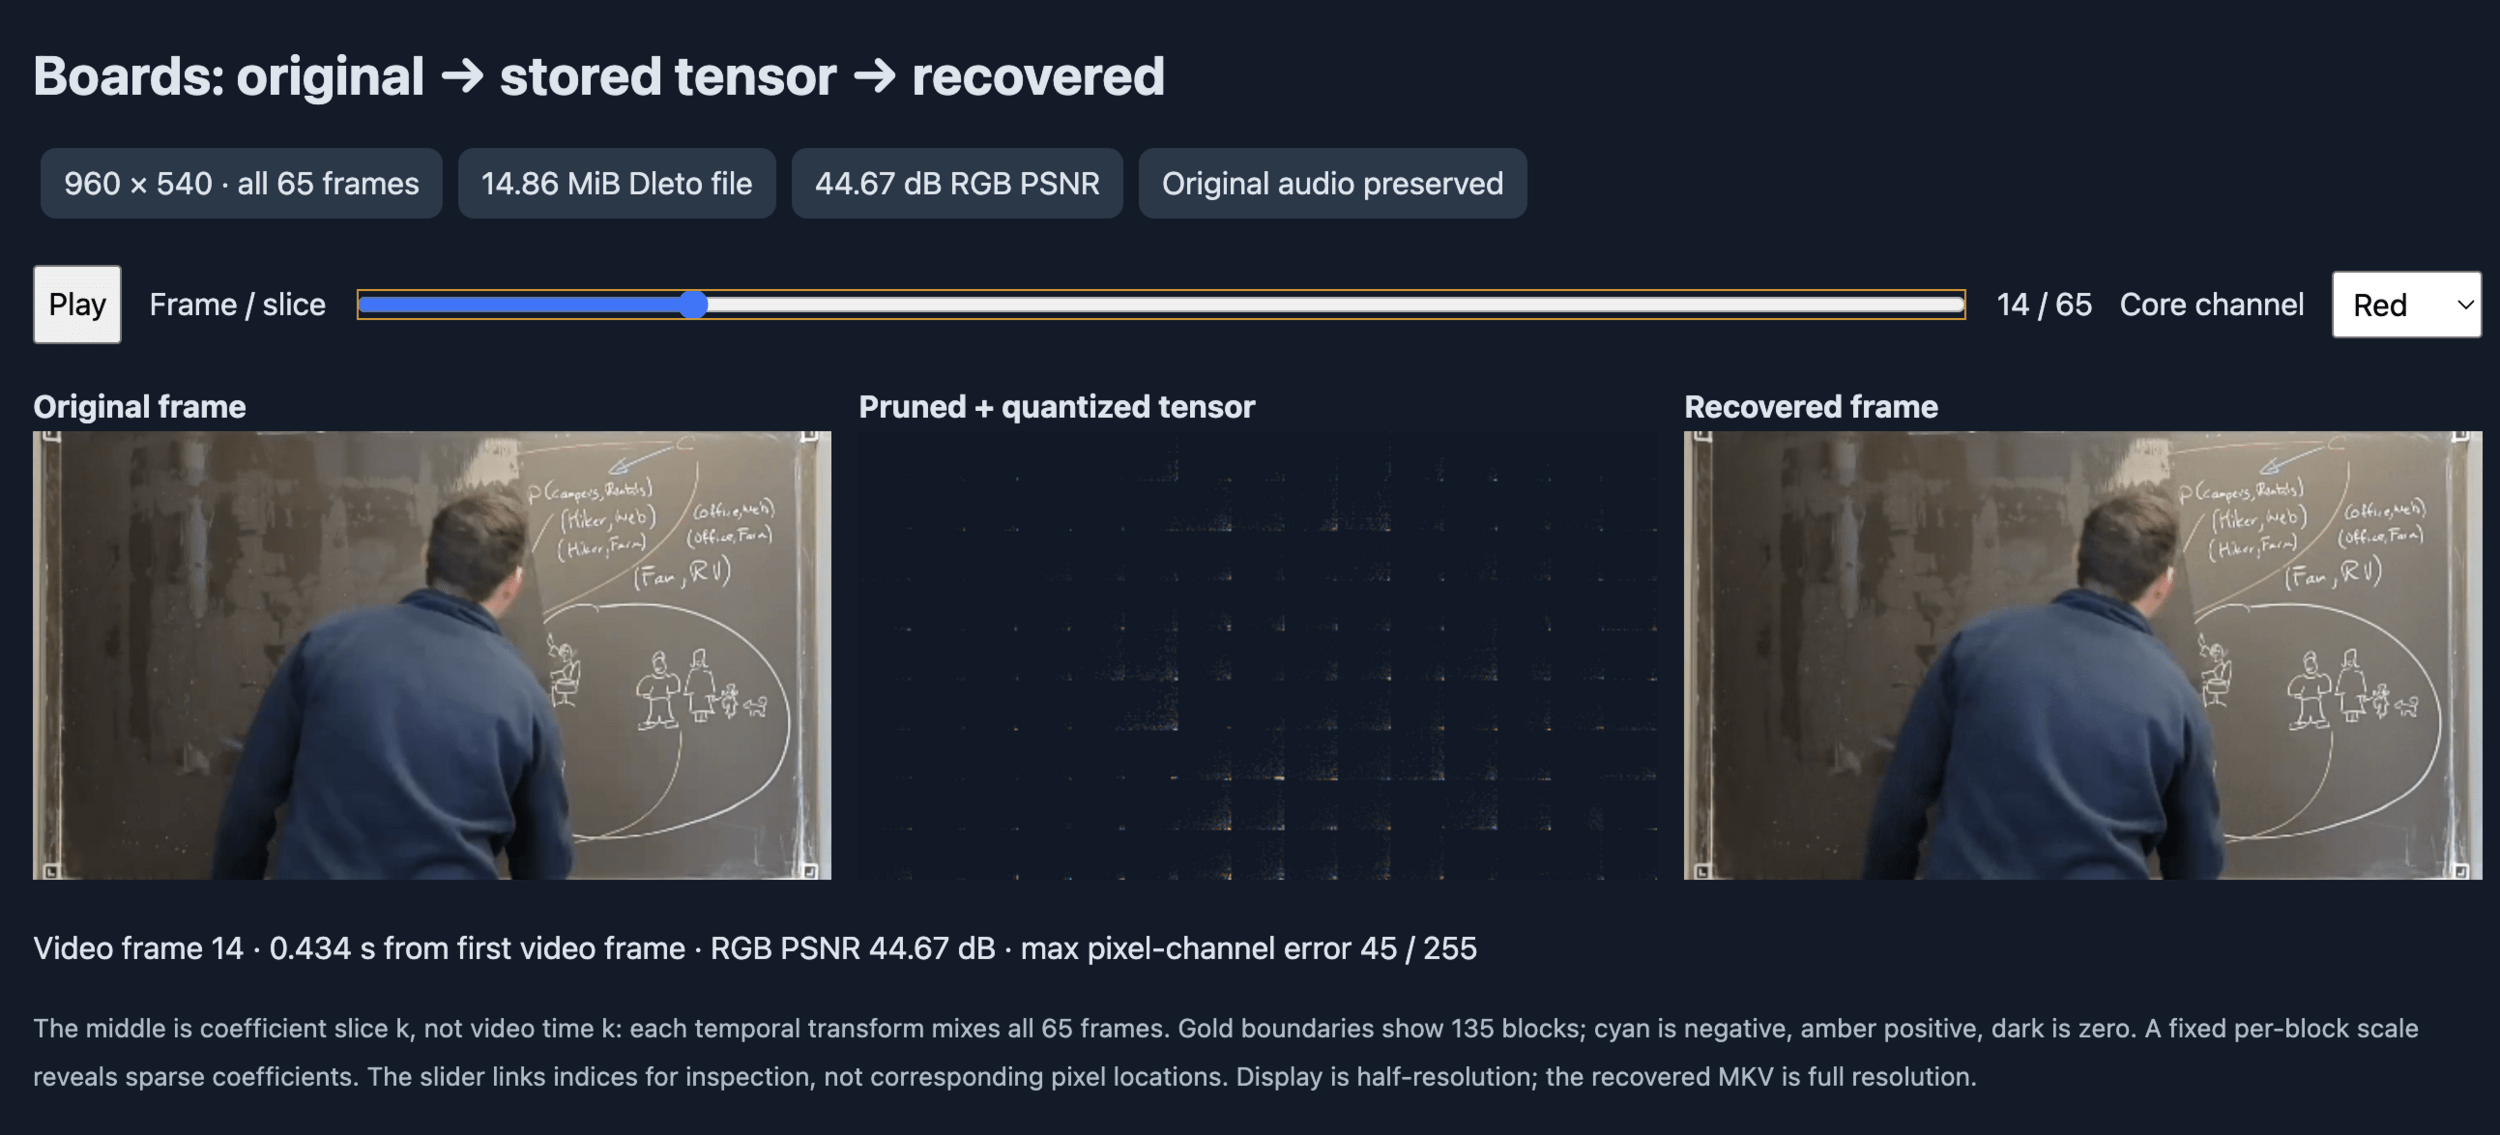
Compression? THeory says yes, Quality works, beats HOSVD, DCT, but Still Tied or worse than HEVC
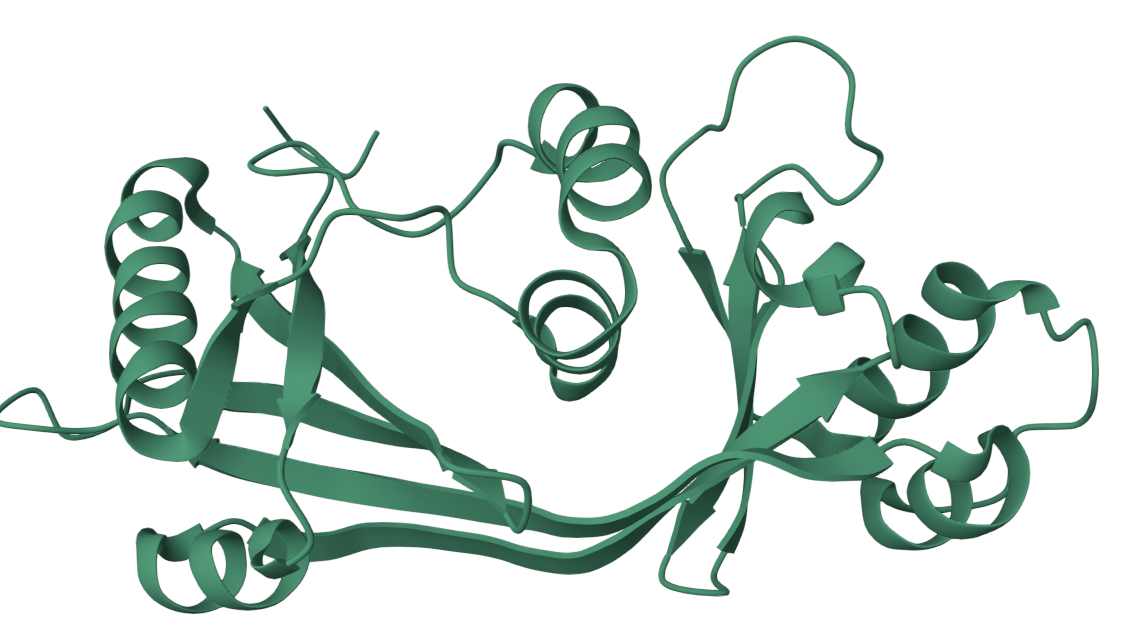
mouse thiamine triphosphatase
Video CompressionNew Theory
Bucknell's Uses?
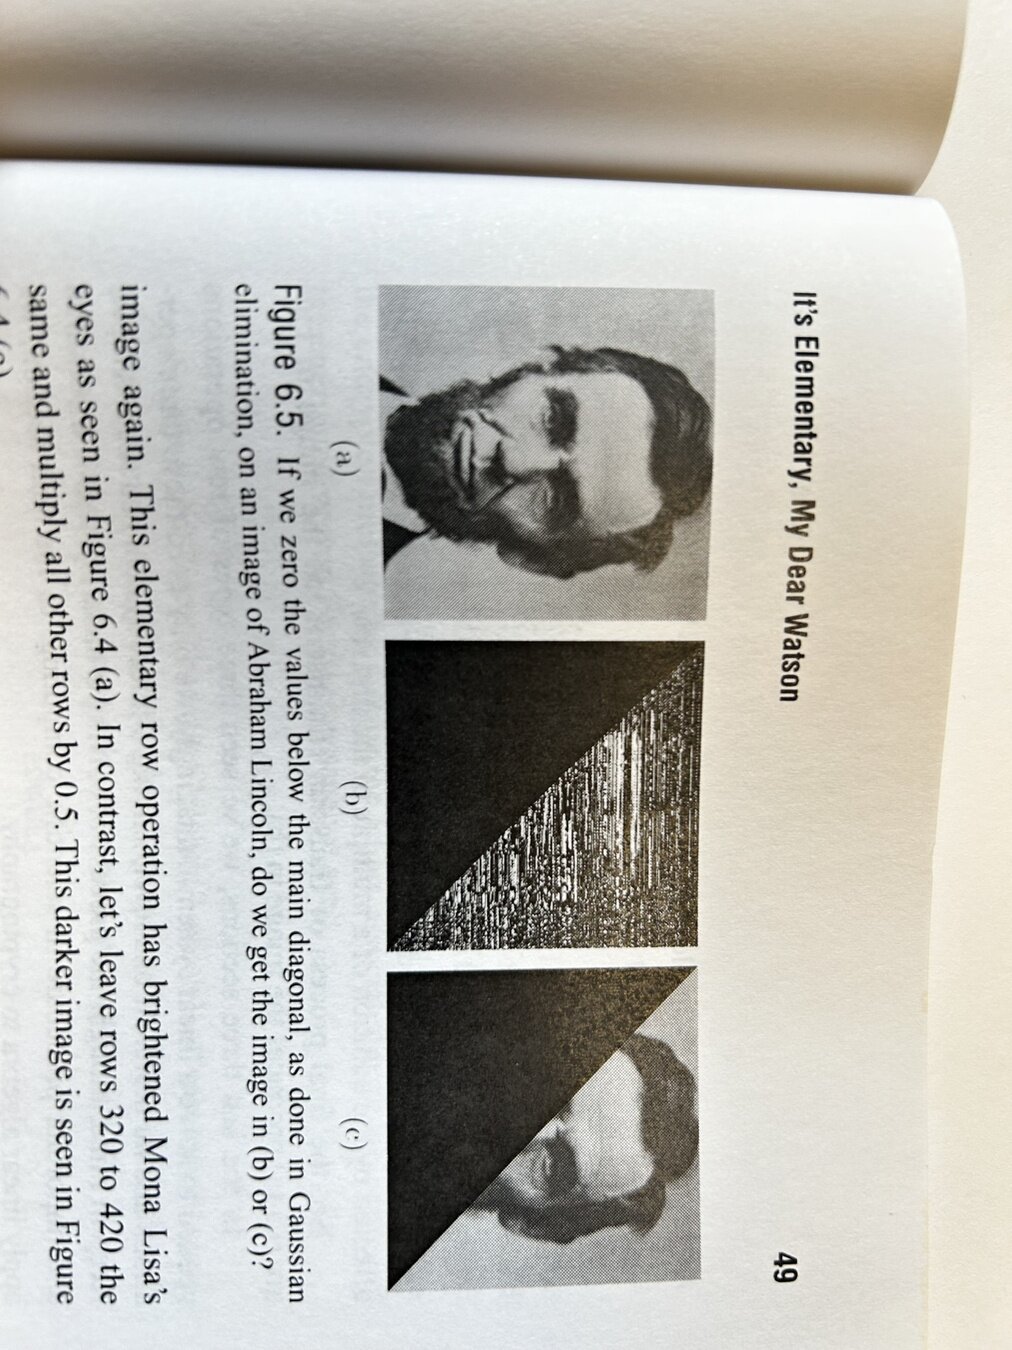
Some data ain't linear
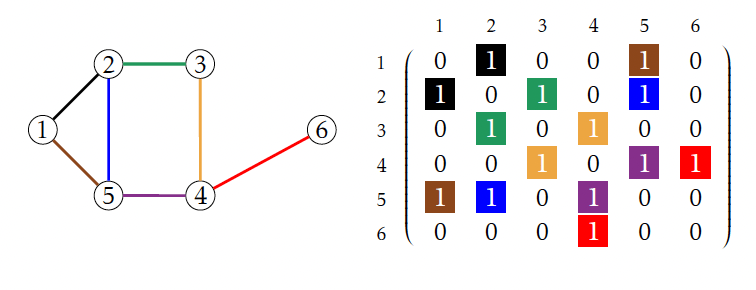
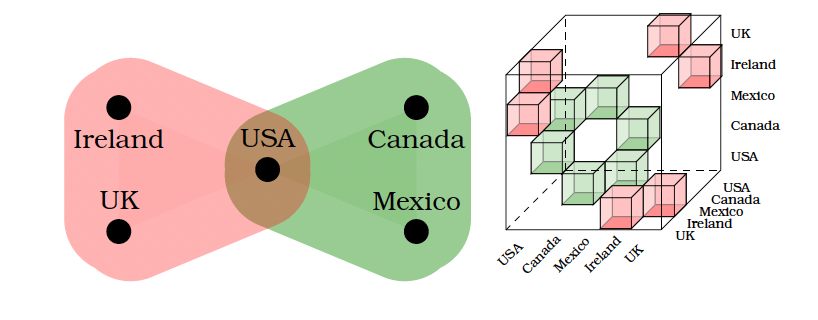
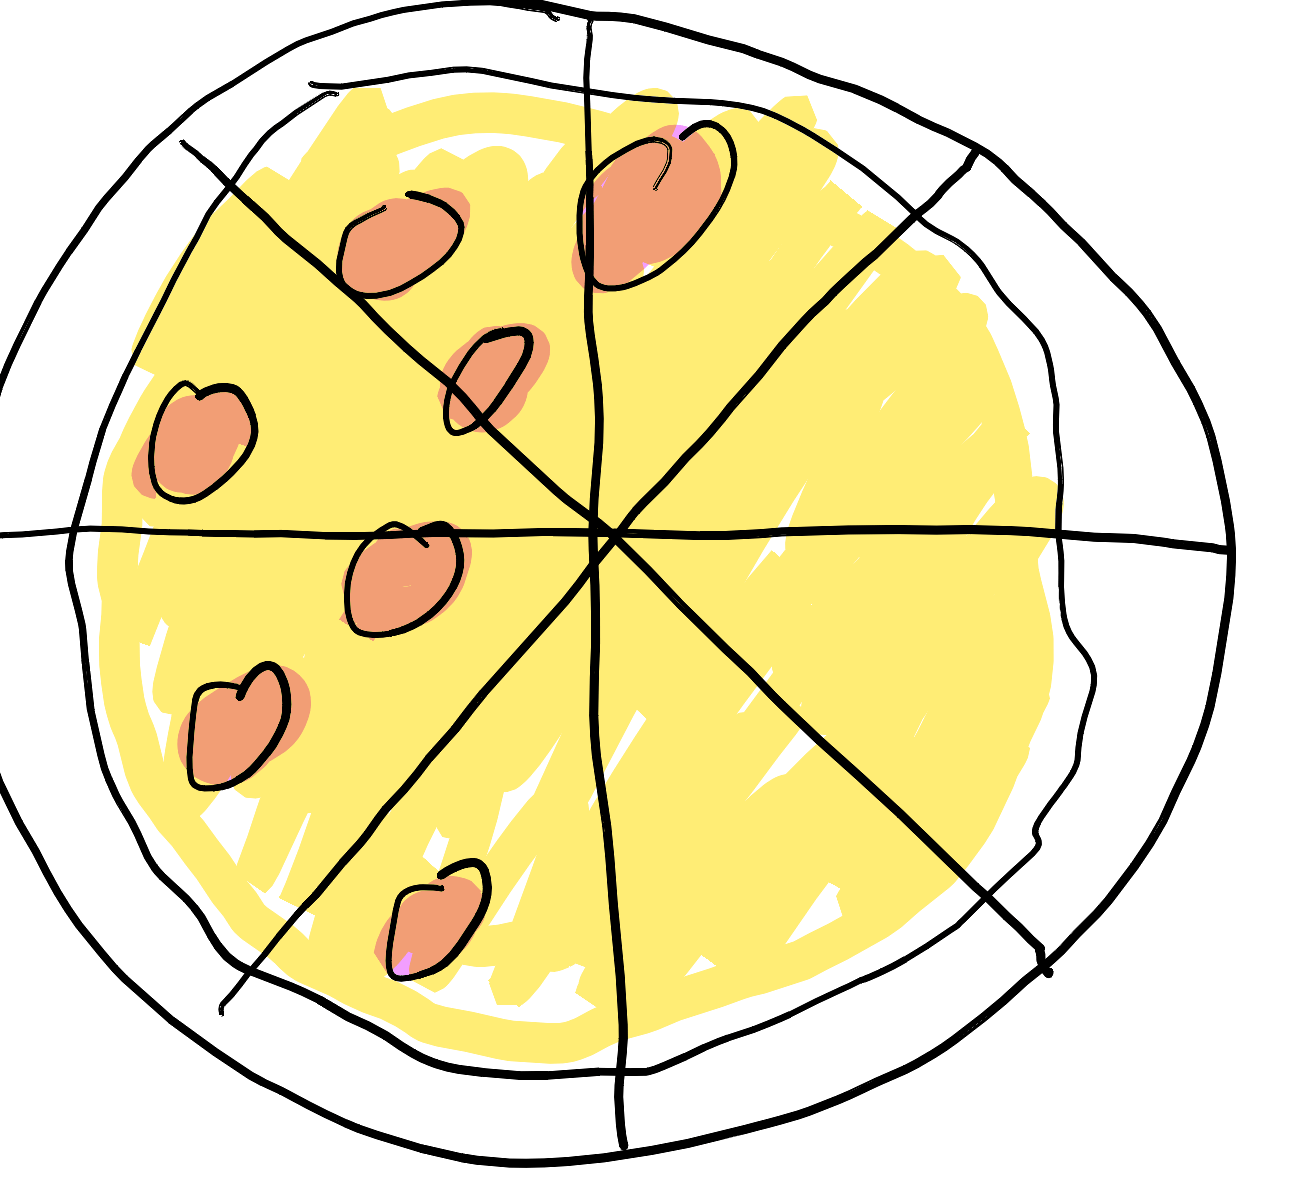
One day a pizza arrived at Lineum's home. Half cheese, half pepperoni! Yumm!!
Somewhere into his 5th slice, Matica sent Lineum a message:
Send me a picture of the pizza I ordered so I can make sure it was made right!
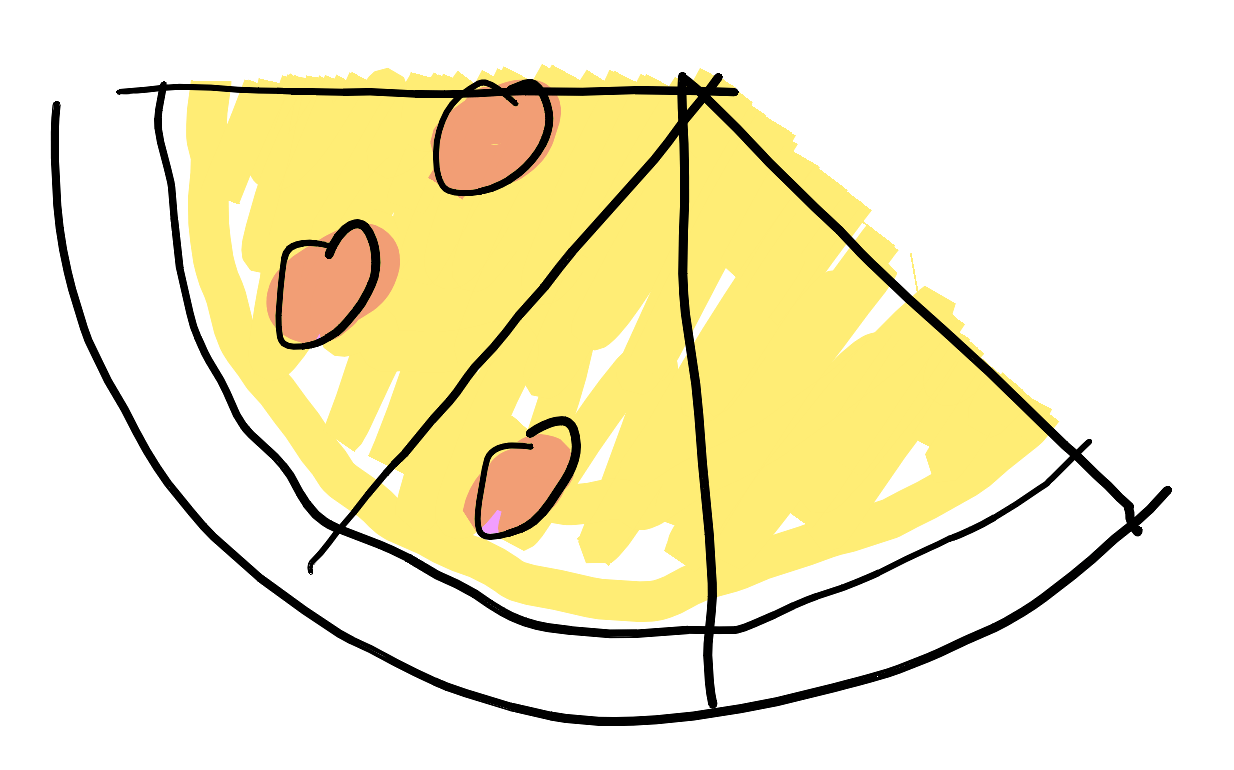
Panicked, Lineum stared at the pieces left then hatched a plan. He took a photo and then cut-and-pasted the pieces to make a whole pie and sent it to Matica.
Moral: Some ways to cut up data have a remarkable amount of similarities to the whole.
How had she known he'd already started eating it?!
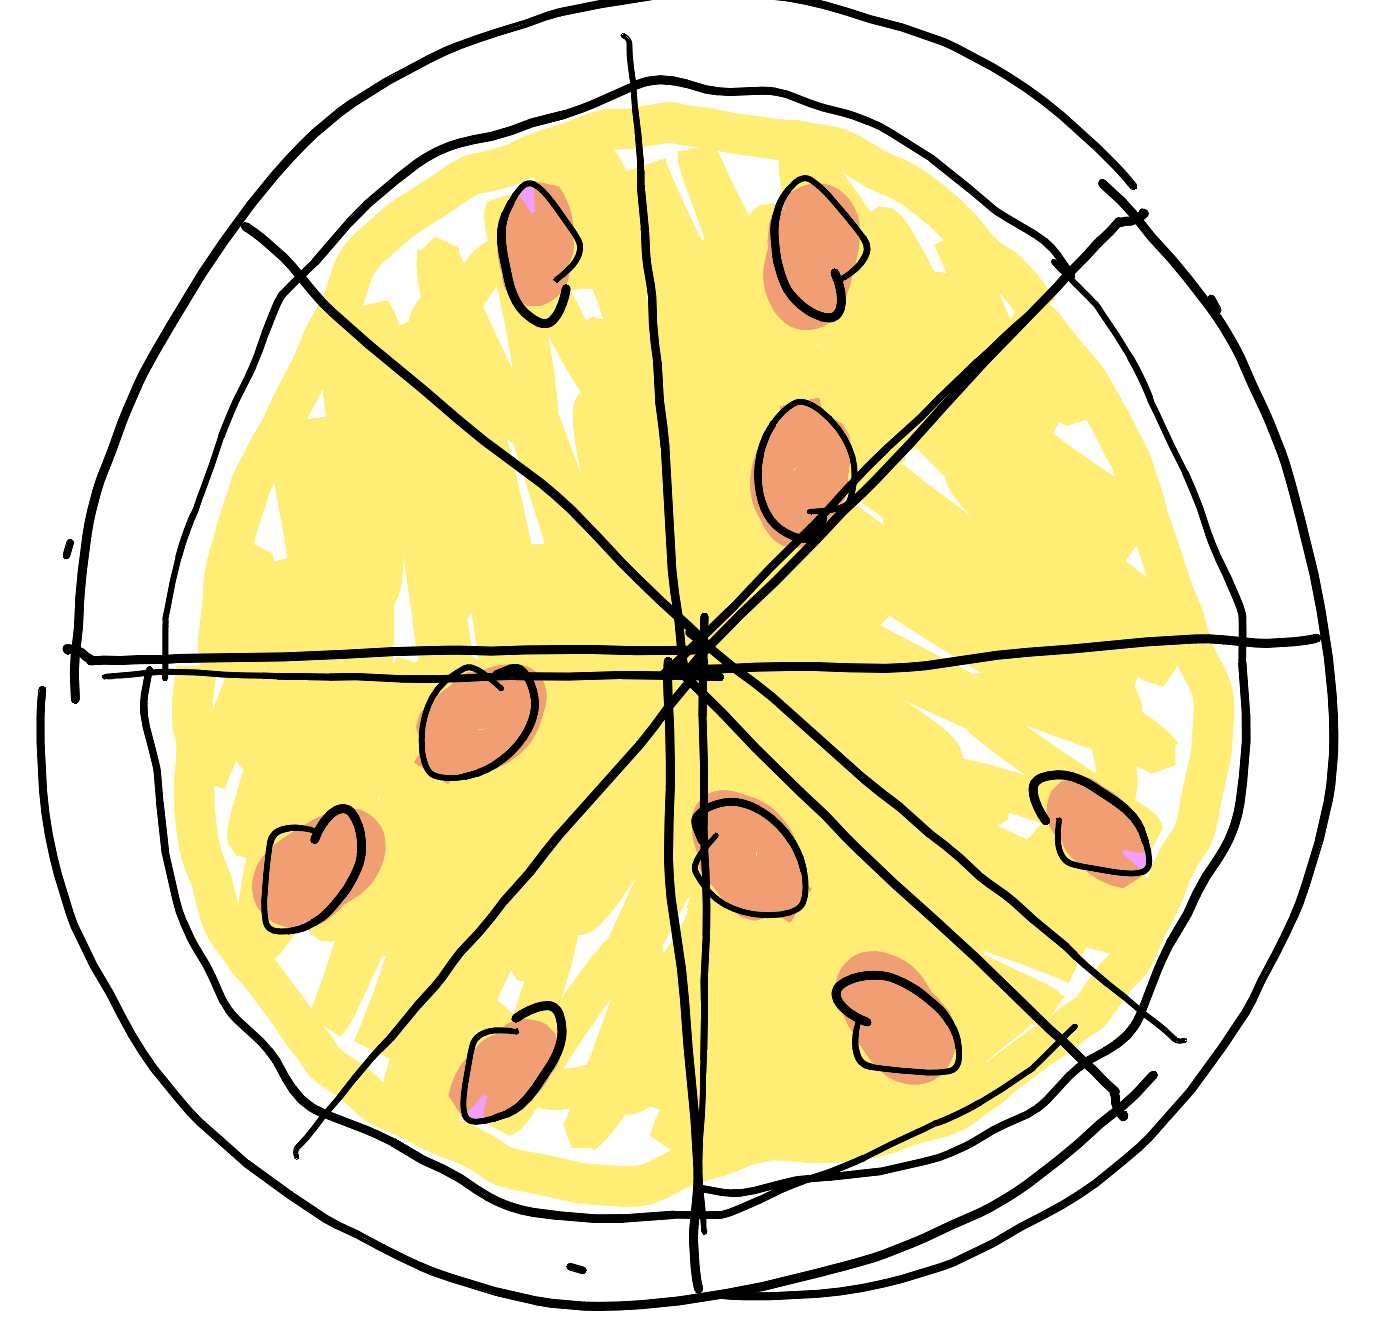
Great! Glad you liked it, but save me the rest!
Spectural Data: The information is the Geometry between the vectors, "Inner (Dot) products"
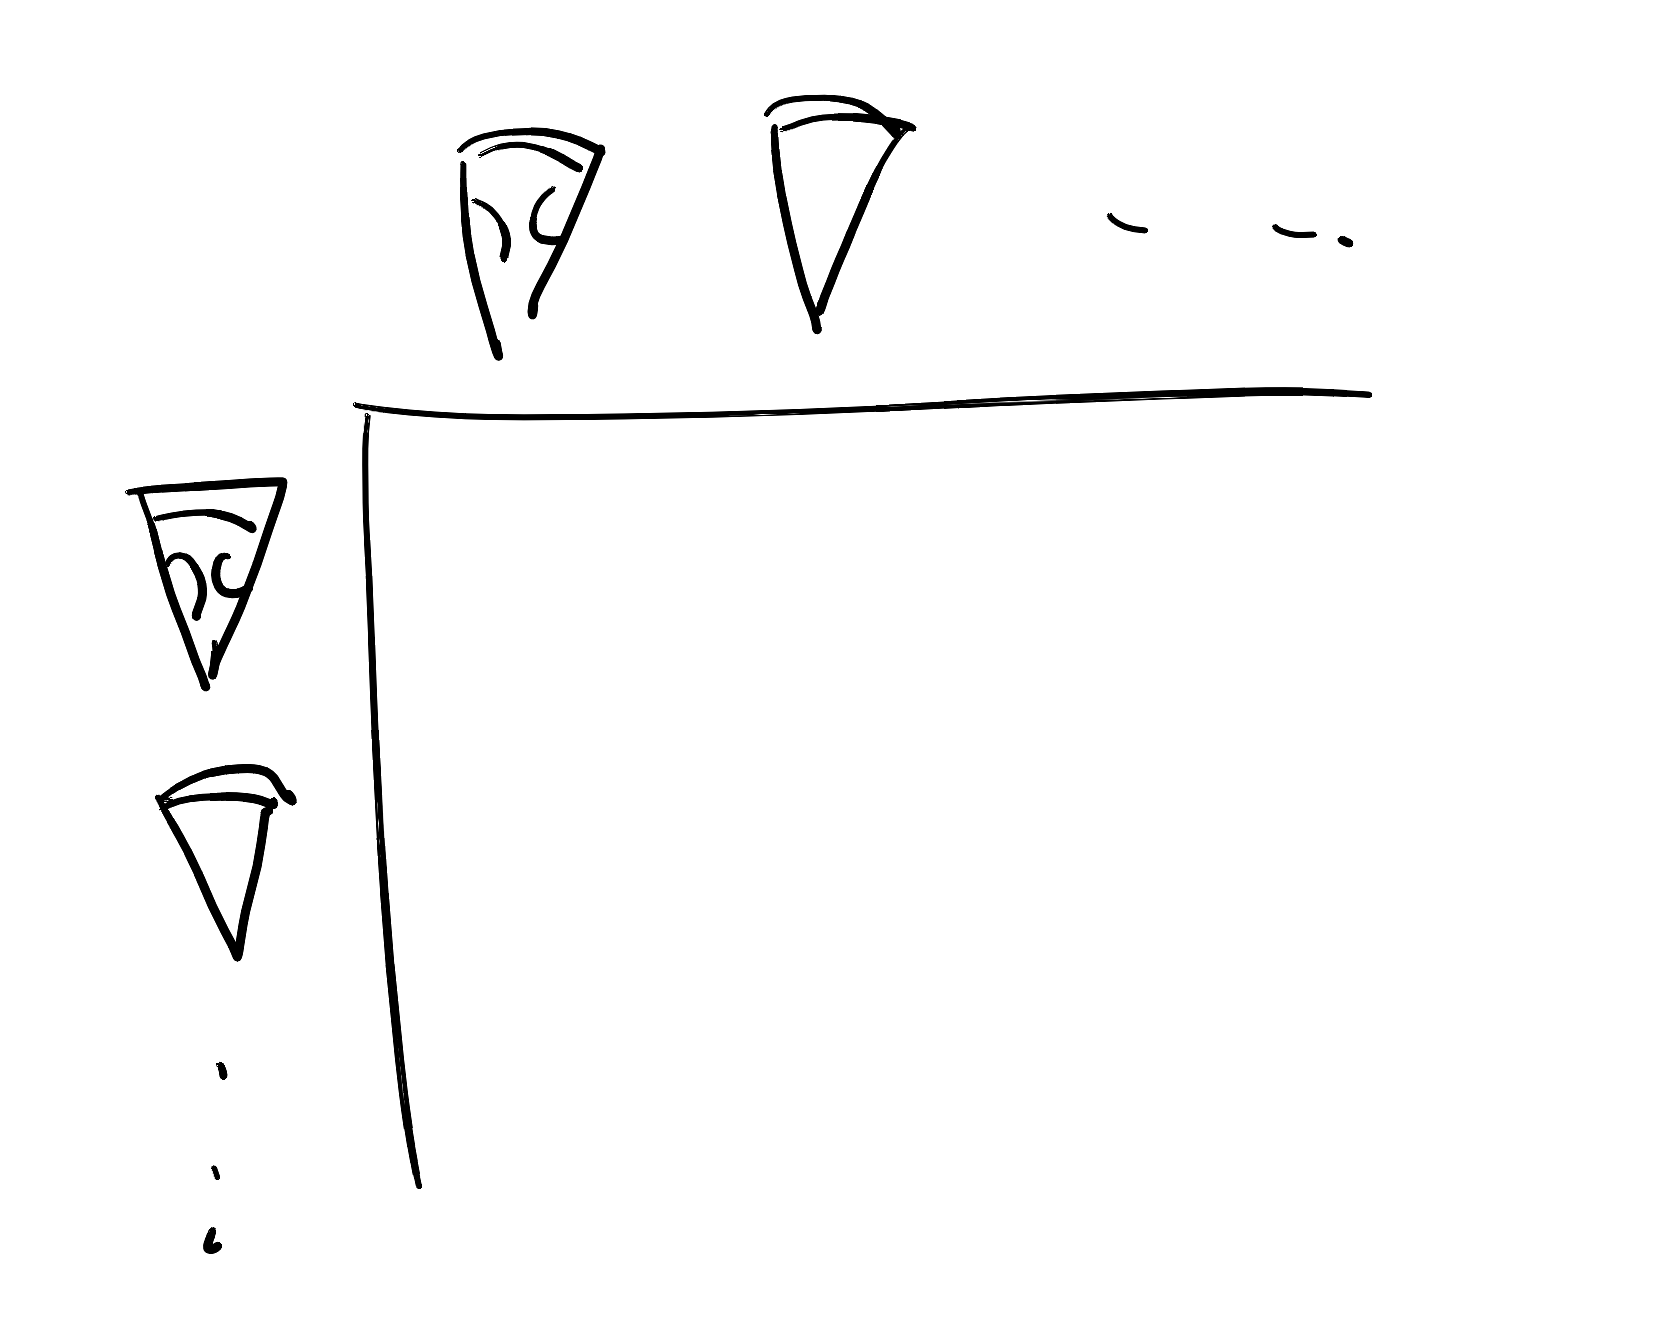
Captured by
\[\langle u,v\rangle = u_1v_1+\cdots +u_n v_n\] and with matrices as
\[M^{\top} M\]
etc.
See prof. Pete Brooksbank
Chisels work on spectral data!
Forget about looks; deeper structure
Mouse thiamine triphosphatase : pdb_00002jmu https://www.rcsb.org/3d-view/2JMU
Nuclear Magnetic Resonance NMR:
-
put some goo in a jar surrounded by magnets.
-
Turn on the radio.
-
Watch it dance.
-
Decide what your protein molecule looks like.


Mouse thiamine triphosphatase : pdb_00002jmu https://www.rcsb.org/3d-view/2JMU
NMR Tensor?
(Experts: I don't know any better! Teach me!)
-
Watch magnetic changes under pulses that excite Hydrogen, Nitrogen, Carbonyl gives 3 axes.
-
Look for coordinates in wave space to identify what "tugs" on what, i.e. is the hydrogen attached to the nitrogen or the Carbon, etc.
-
Peaks in the wave frequency are the key.
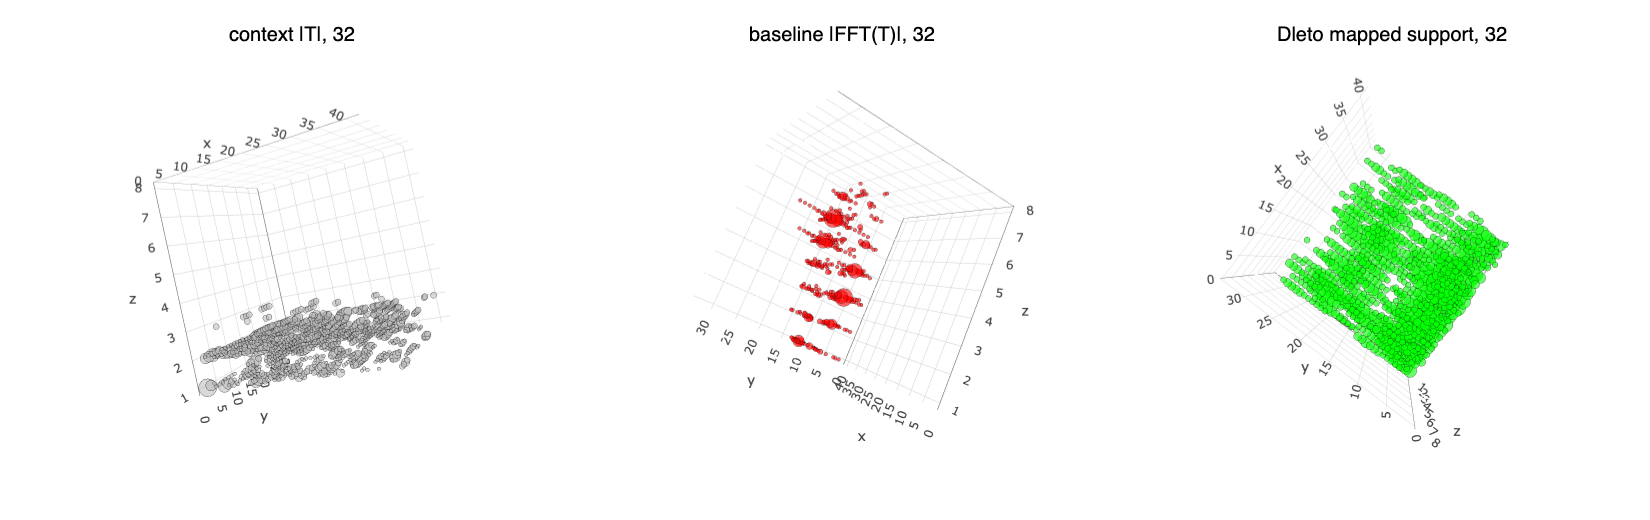
To the eye, the FFT looks far more organized than Dleto (not always the case just this example)
Look with instruments; Dleto is actually quite systematic.
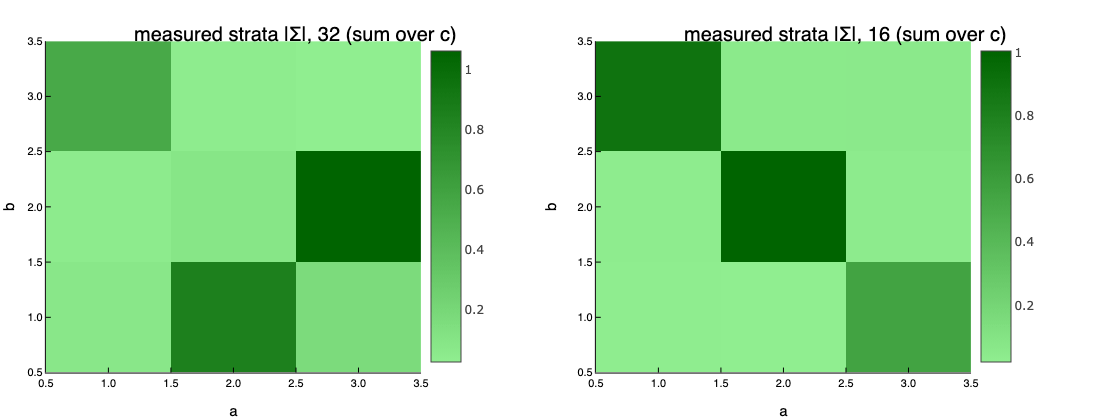
Molecule shape tracks with how atoms move.
More Peaks = More structure (more dots to connect)
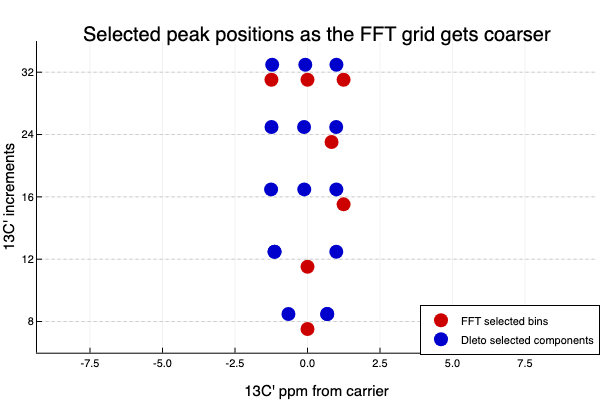
-
FFT needs more measurements to find all 3 peaks.
-
Chiseling can retain statistically significant with data 1/2 to even 1/8 the data of the FFT.
-
Twice as fast means...
-
Half price.
-
More scans.
-
Finer features at same price.
-
Why?
-
FFT assumes frequency bins like keys on a piano.
-
Need more frequencies? Build a bigger piano.


- Chiseling scans the data you have and decides what bins to make.
- It's tuning your instrument for the music instead of building a bigger one.

When Data tables => Multiplication Tables
Cluster patterns => algebra
=> Reproducible Algorithms
Summary
Talks, Articles, and Books
PleaseDistribute.Org
Software:
TheTensor.Space (links to GitHub projects)
Tell me what I need to learn: James.Wilson@ColoState.Edu