Analyzing tens of thousands of neutralization curves to understand viral evolution
Jesse Bloom
Fred Hutch Cancer Center / HHMI
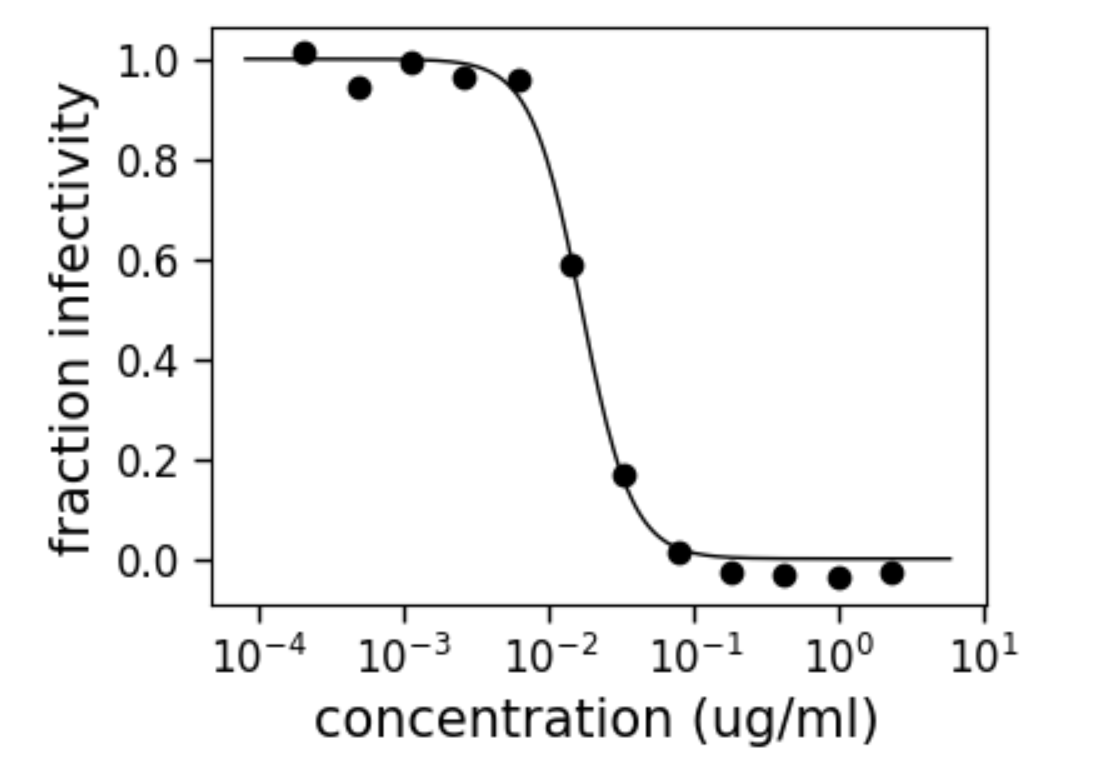
Neutralization curves measure viral infectivity as function of antibody concentration
We developed way to measure these curves in much higher throughput


We barcode virions and read out infectivity by sequencing
At a high level, we convert counts to infectivity then fit curve
Component 1: Python package that fits neutralization curves
Component 2: pipeline that processes data to fit tens of thousands of curves

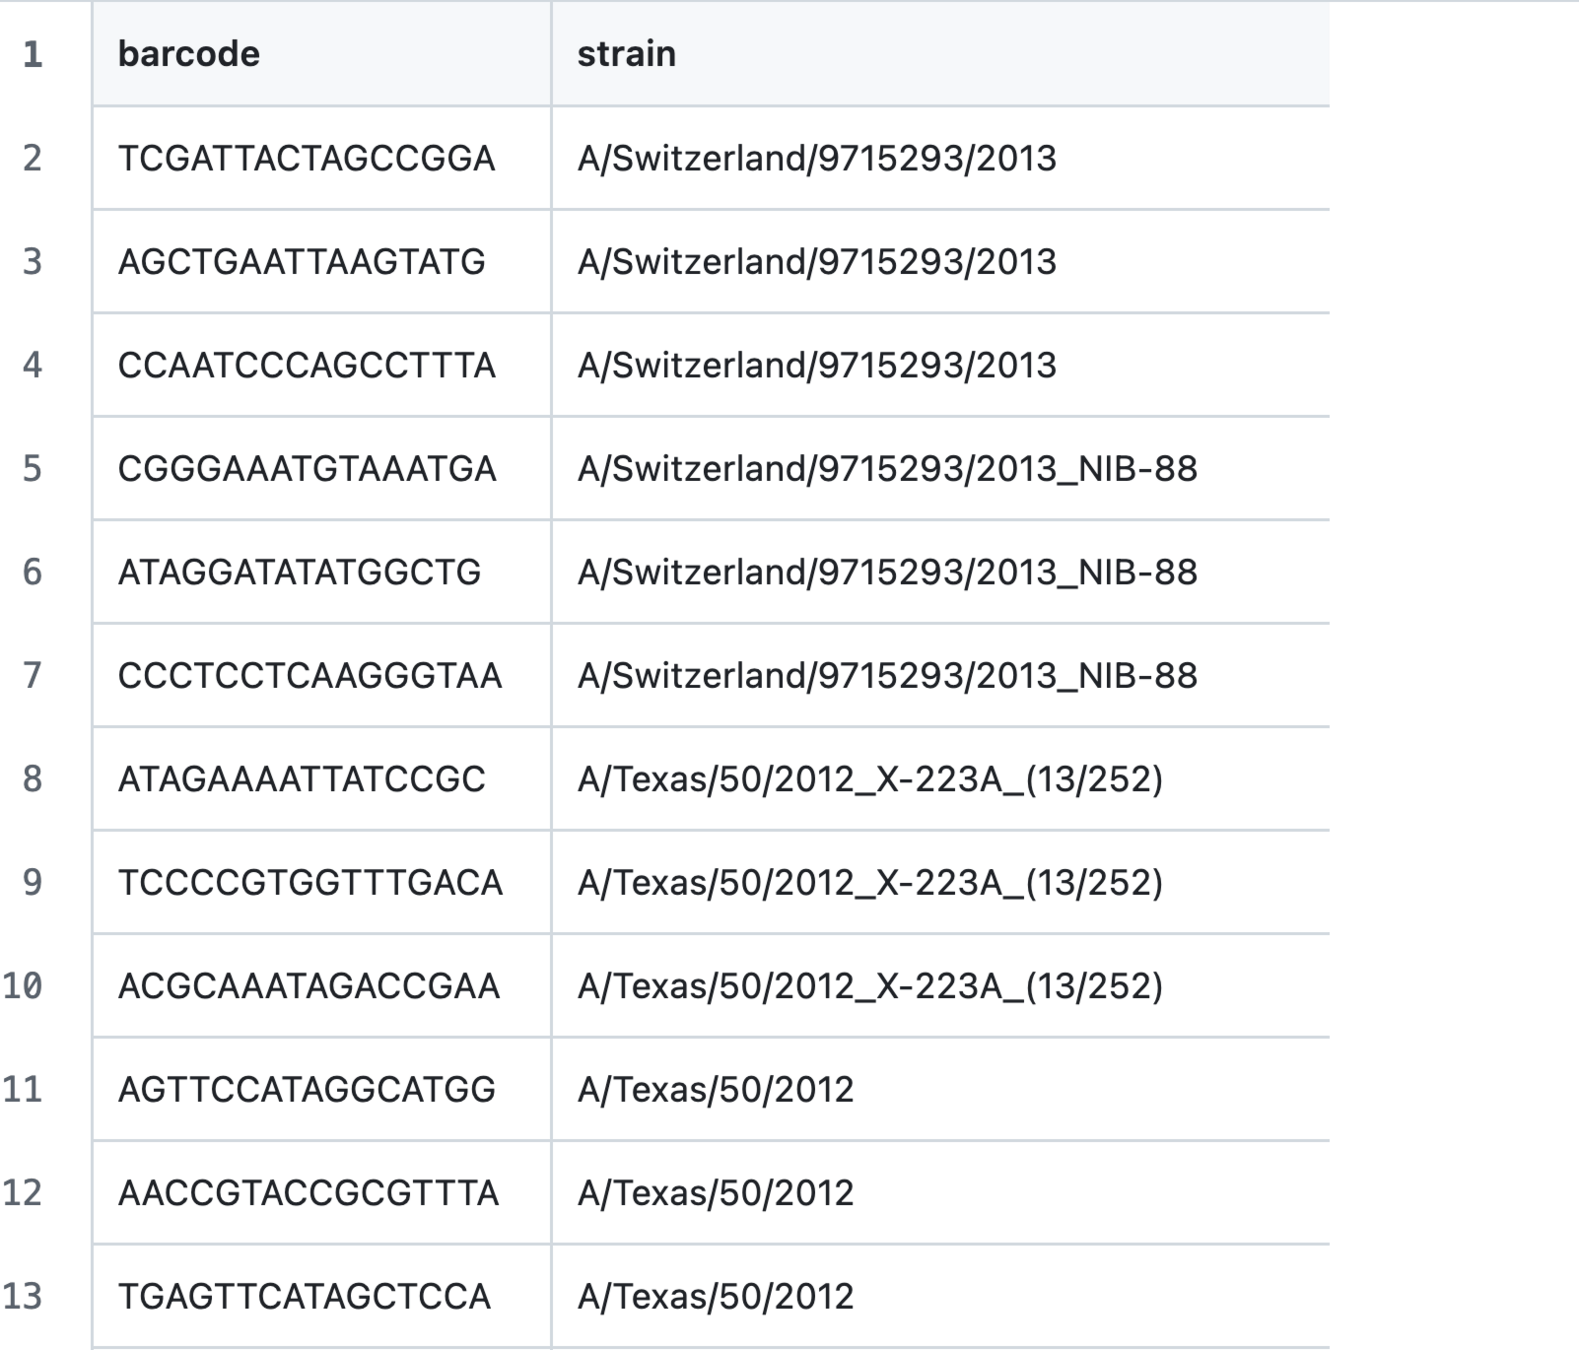
Input 1: list of viral barcodes
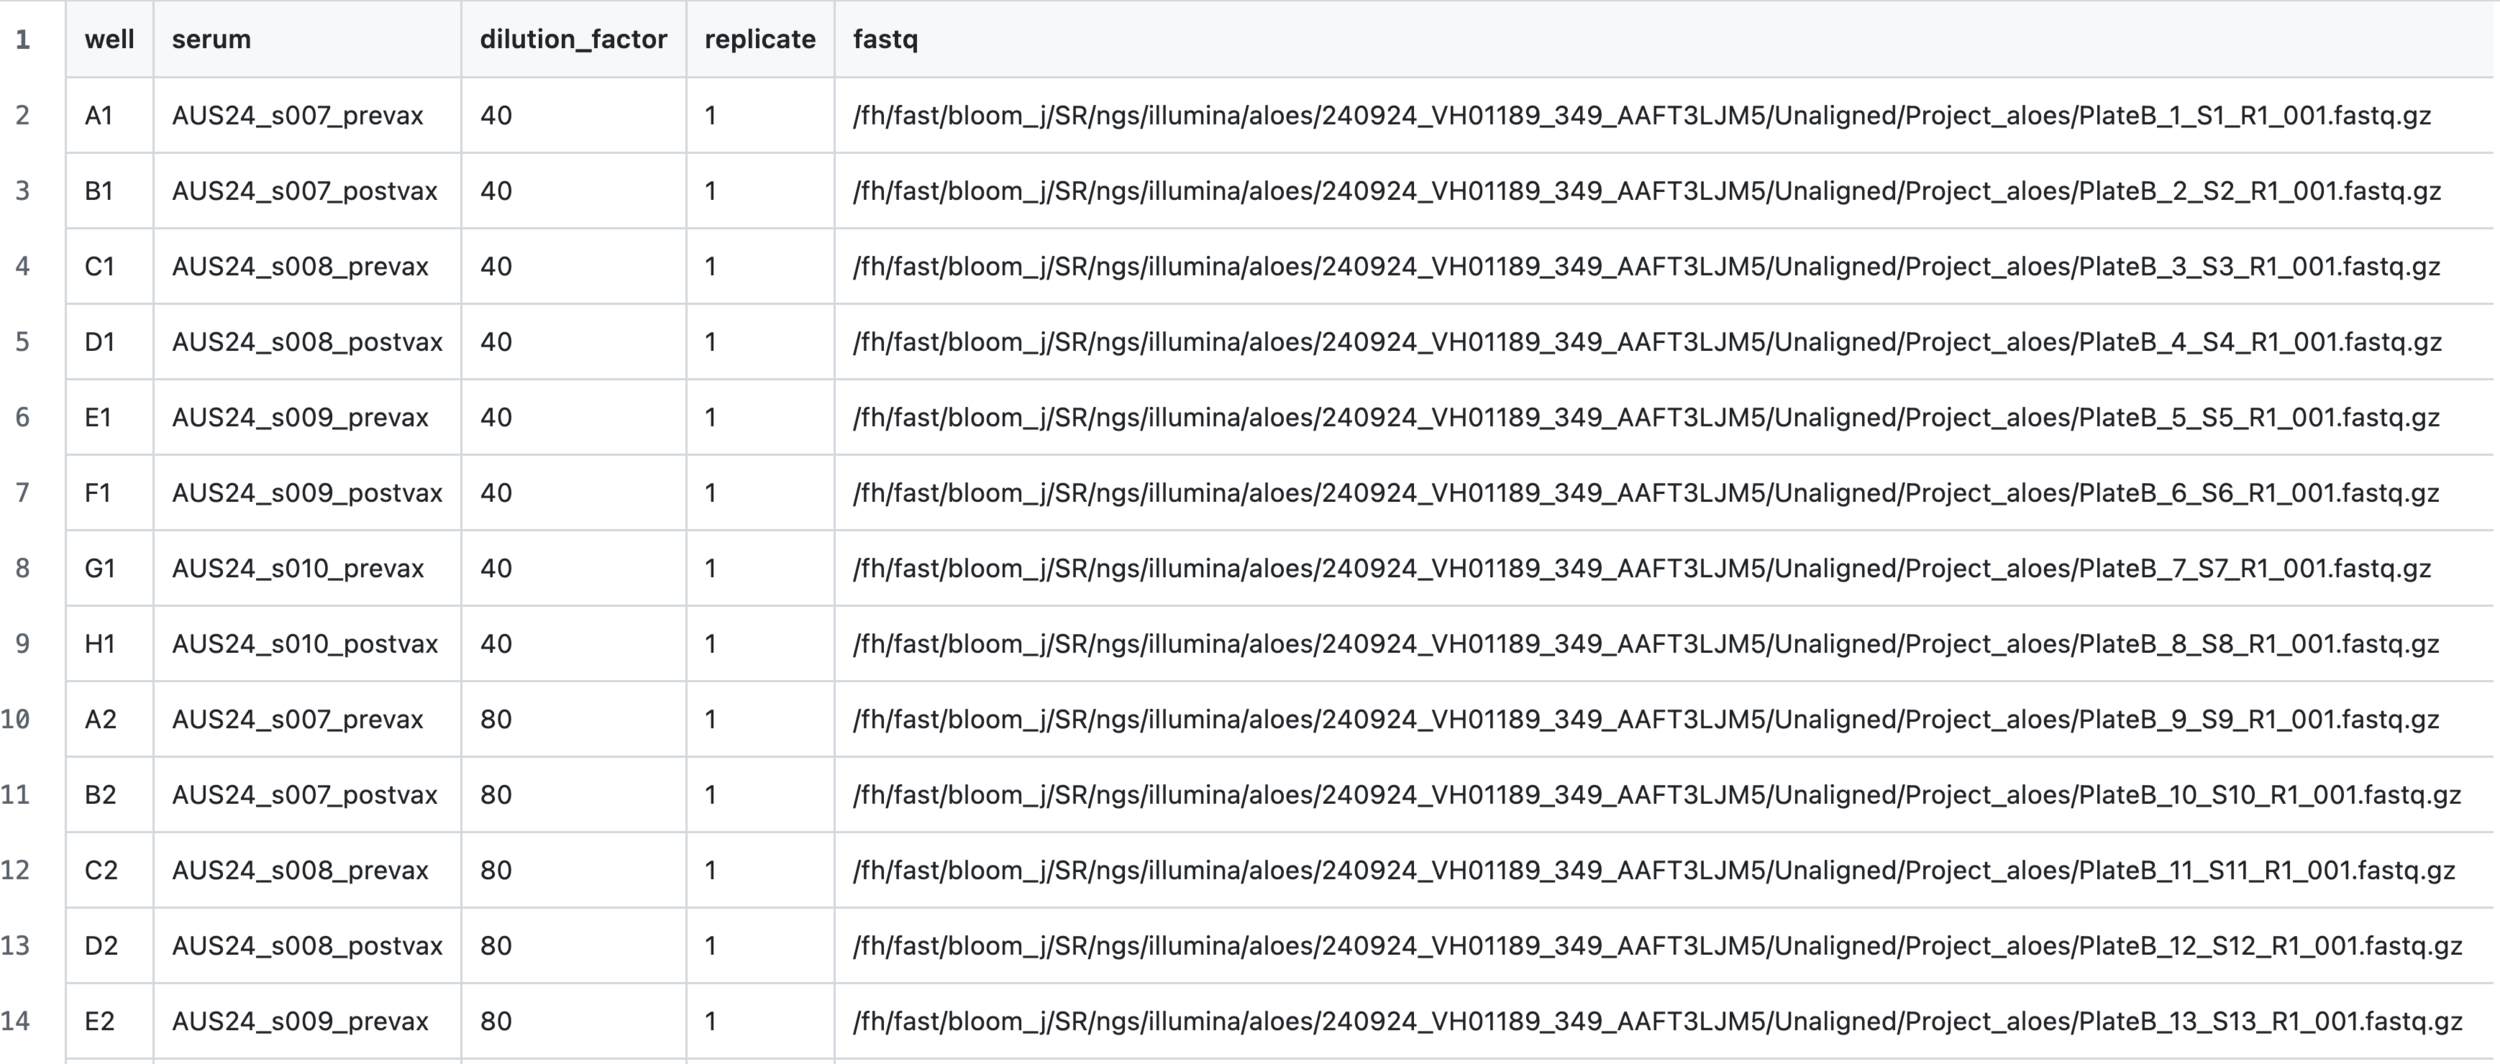
Input 2: sample and sequencing data for each well of 96-well plate
Input 3: overall configuration file
Output: all curves for each sera
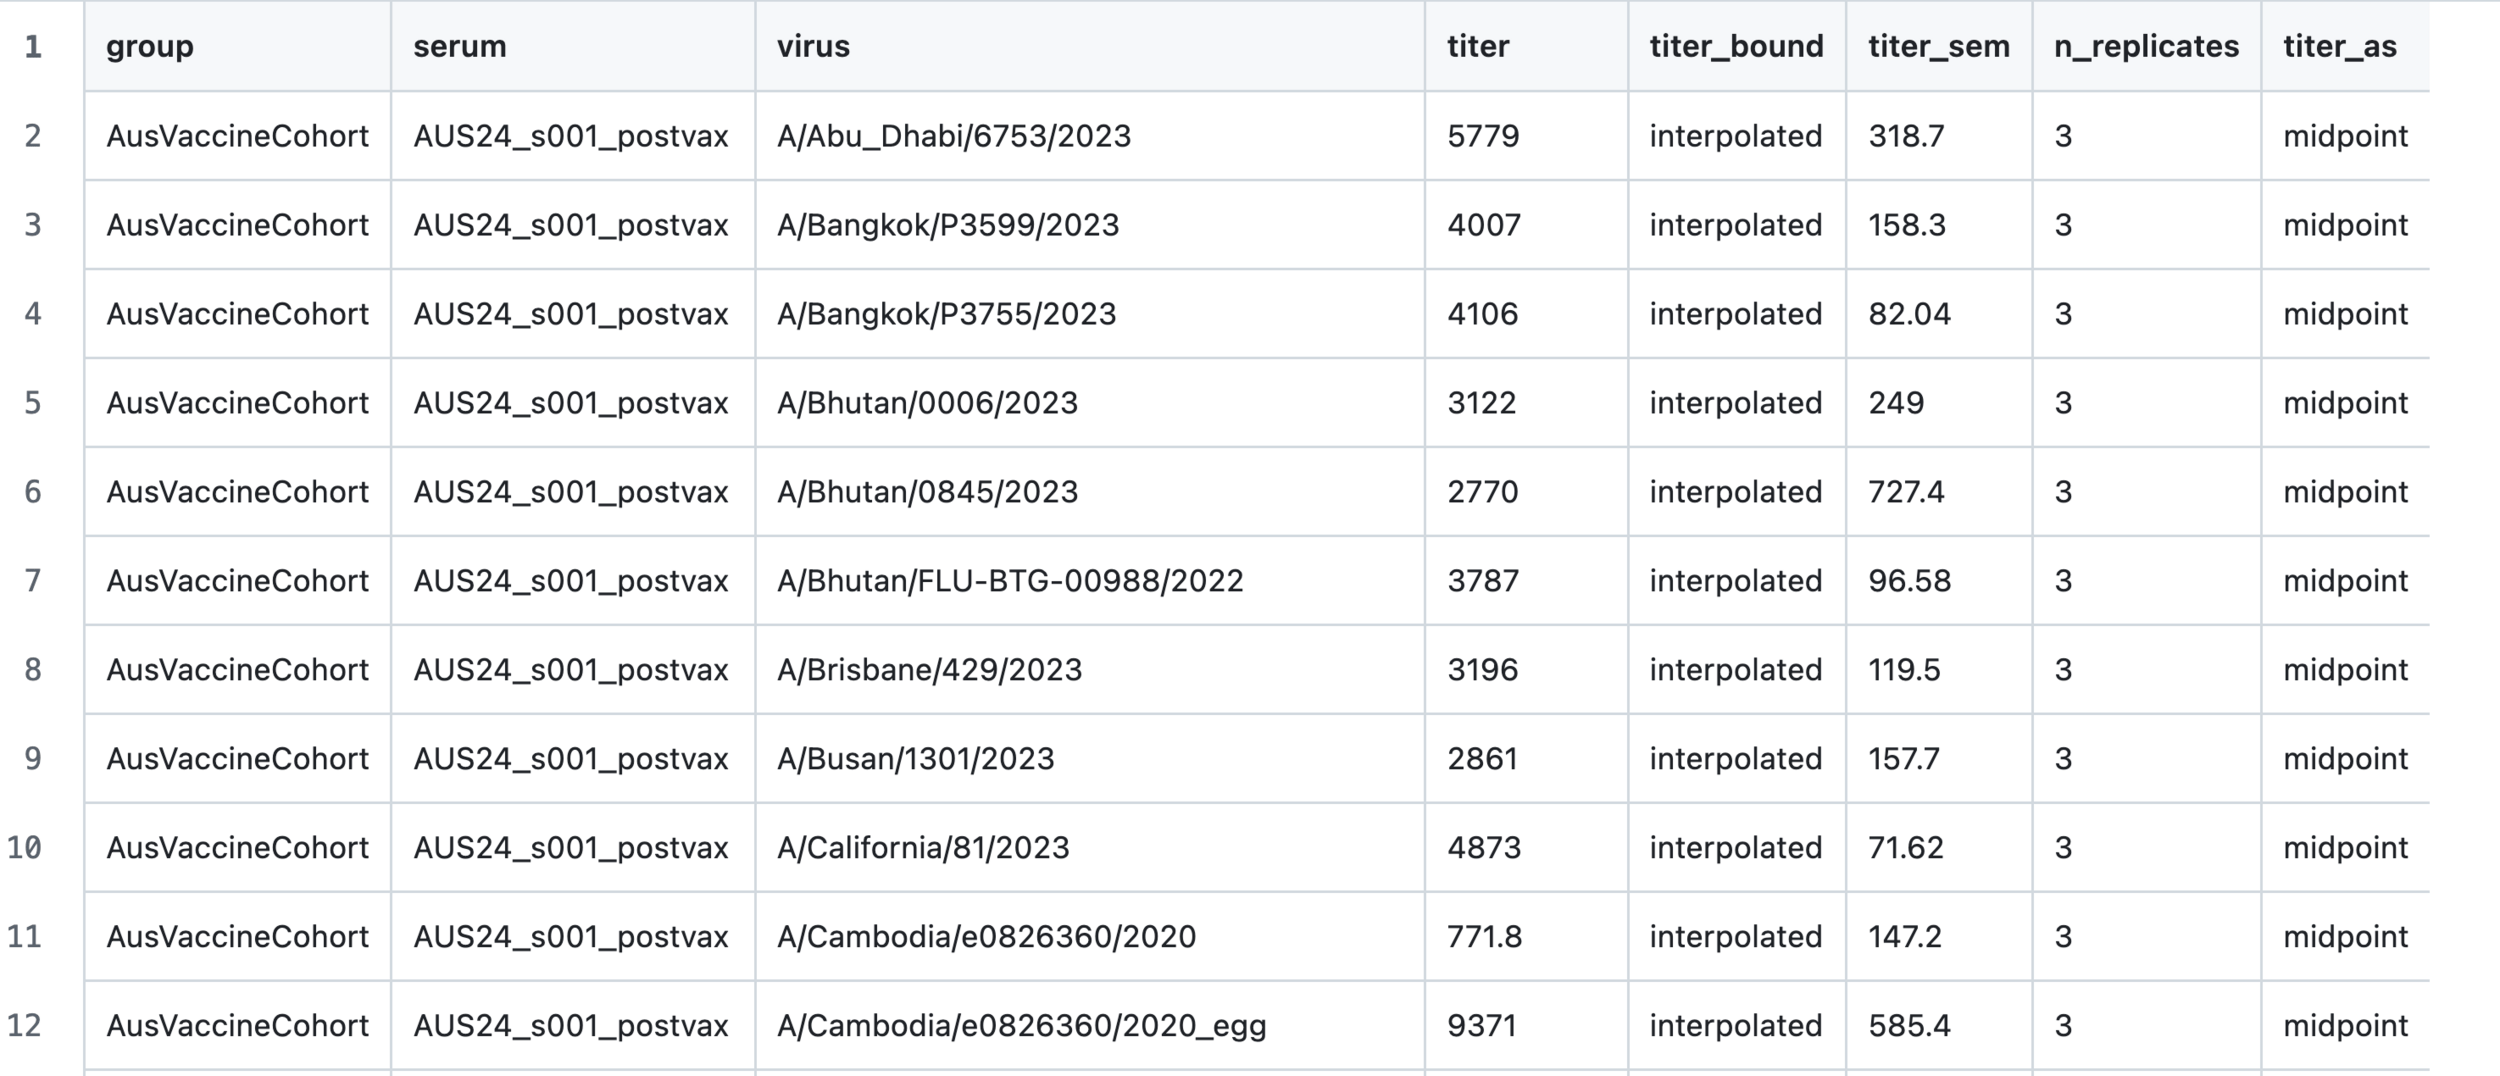
Output: numerical titers for all sera
Component 3: visualization of results
Summary
We now have a method by which one graduate student can measure ~25,000 neutralization titers in a few months
However, analyzing the data is harder than just looking at a hemagglutination-inhibition assay plate
The computational methods described here make the analysis easy enough that many labs will start using this approach