Machine learning interpretability
to study biology?
J. Sulam

Institute for Computational Medicine
September 2nd, 2025


"The biggest lesson that can be read from 70 years of AI research is that general methods that leverage computation are ultimately the most effective, and by a large margin. [...] Seeking an improvement that makes a difference in the shorter term, researchers seek to leverage their human knowledge of the domain, but the only thing that matters in the long run is the leveraging of computation. [...]
We want AI agents that can discover like we can, not which contain what we have discovered."
The Bitter Lesson, Rich Sutton 2019

Interpreting machine learning predictors for discovery in biology?
1. Interpreting Opaque ML models
2. Interpretable ML models

sick
healthy


(large \(n\), small Bayes error)
(small \(n\), non-negligable Bayes error)
Interpreting Opaque ML models
What parts of the image are important for this prediction?
What are the subsets of the input so that

Interpreting Opaque ML models
-
Sensitivity or Gradient-based perturbations
-
Shapley coefficients
-
Variational formulations
-
Counterfactual & causal explanations
LIME [Ribeiro et al, '16], CAM [Zhou et al, '16], Grad-CAM [Selvaraju et al, '17]
Shap [Lundberg & Lee, '17], ...
RDE [Macdonald et al, '19], ...
[Sani et al, 2020] [Singla et al '19],..

Shapley Values

efficiency
nullity
symmetry
exponential complexity
Lloyd S Shapley. A value for n-person games. Contributions to the Theory of Games, 2(28):307–317, 1953.
Let be an -person cooperative game with characteristic function
How important is each player for the outcome of the game?
marginal contribution of player i with coalition S
Shapley Values
Lloyd S Shapley. A value for n-person games. Contributions to the Theory of Games, 2(28):307–317, 1953.

-
Efficiency
-
Linearity
-
Symmetry
-
Nullity
Shapley Explanations for ML
sick
healthy
inputs
responses
predictor
Shapley Explanations for ML
inputs
responses
predictor
Question 2:
How can we, or when, compute \(\phi_i(v)\)?
Question 3:
What do \(\phi_i(v)\) say (and don't) about the problem?
Question 1:
How should we choose the function \(v_f(S)\)?

Question 4:
What can we do with them?
Question 1:
How should we choose the function \(v\)?
\(v_f(S,x) = \mathbb{E} [f(x_S,\tilde{X}_{\bar{S}})|X_S = x_S]\)
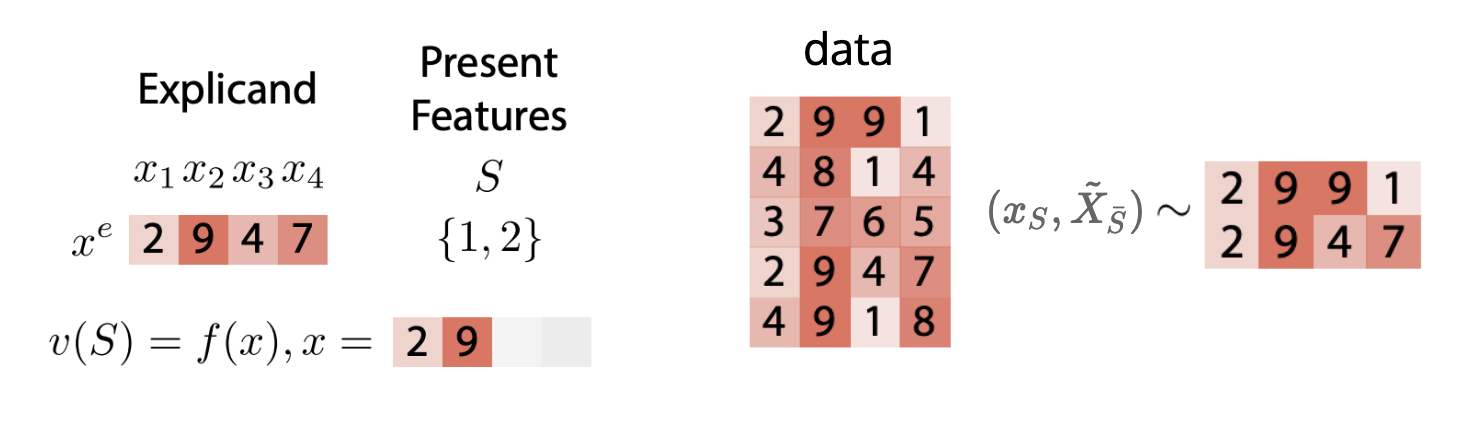
"True to the data"
- Conditional Data Distribution
[Chen et al, Algorithms to estimate Shapley value feature attributions, 2022] [Aas et al, 2019] [Teneggi et al, 2023][Frye et al, 2021][Janzing et al, 2019][Chen et al, 2020]Question 1:
How should we choose the function \(v\)?

\(v_f(S,x) = \mathbb{E} [f(x_S,\tilde{X}_{\bar{S}})|X_S = x_S]\)
- Conditional Data Distribution
[Chen et al, Algorithms to estimate Shapley value feature attributions, 2022] [Aas et al, 2019] [Teneggi et al, 2023][Frye et al, 2021][Janzing et al, 2019][Chen et al, 2020]Question 2:
How can we, or when, compute \(\phi_i(v)\)?
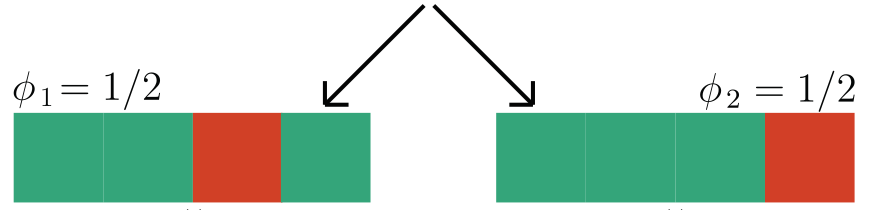
Example:
if contains a sick cell
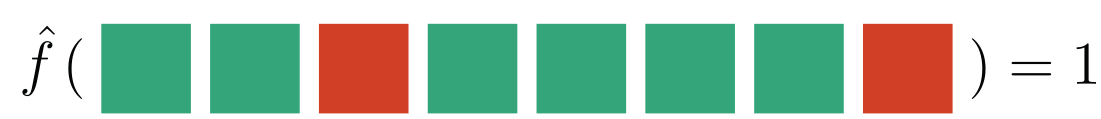
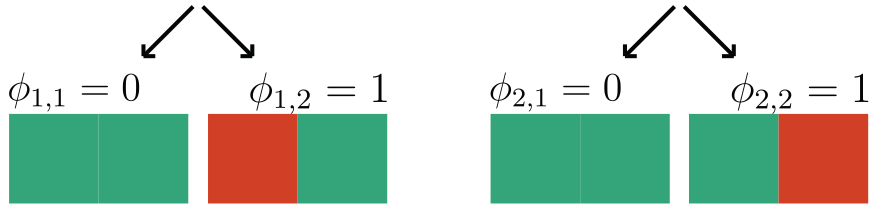
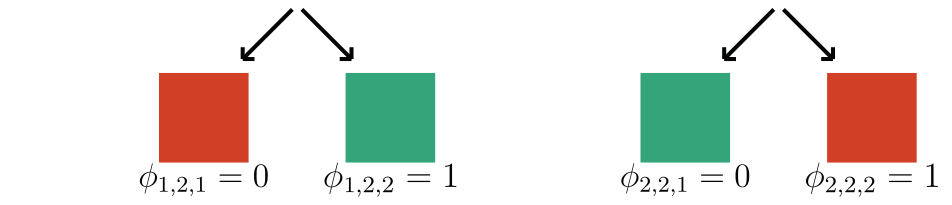
-
Hierarchical Shapley (h-Shap)
[Teneggi et al, 2022]
Observation: \(f(x) = 1 \Leftrightarrow \exist~ i: f(x_i,\tilde{X}_{-i}) = 1\) (A1)
-
Hierarchical Shapley (h-Shap)
[Teneggi et al, 2022]
-
Under A1, \(\phi^\text{h-Shap}_i(f) = \phi_i(f)\)
Bounded approximation as deviating from A1
2. Correct approximation (informal)
1. Complexity \(\mathcal O(2^\gamma k \log n)\)
Observation: \(f(x) = 1 \Leftrightarrow \exist~ i: f(x_i,\tilde{X}_{-i}) = 1\) (A1)


Question 2:
How can we, or when, compute \(\phi_i(v)\)?
-
Hierarchical Shapley (h-Shap)
[Teneggi et al, 2022]
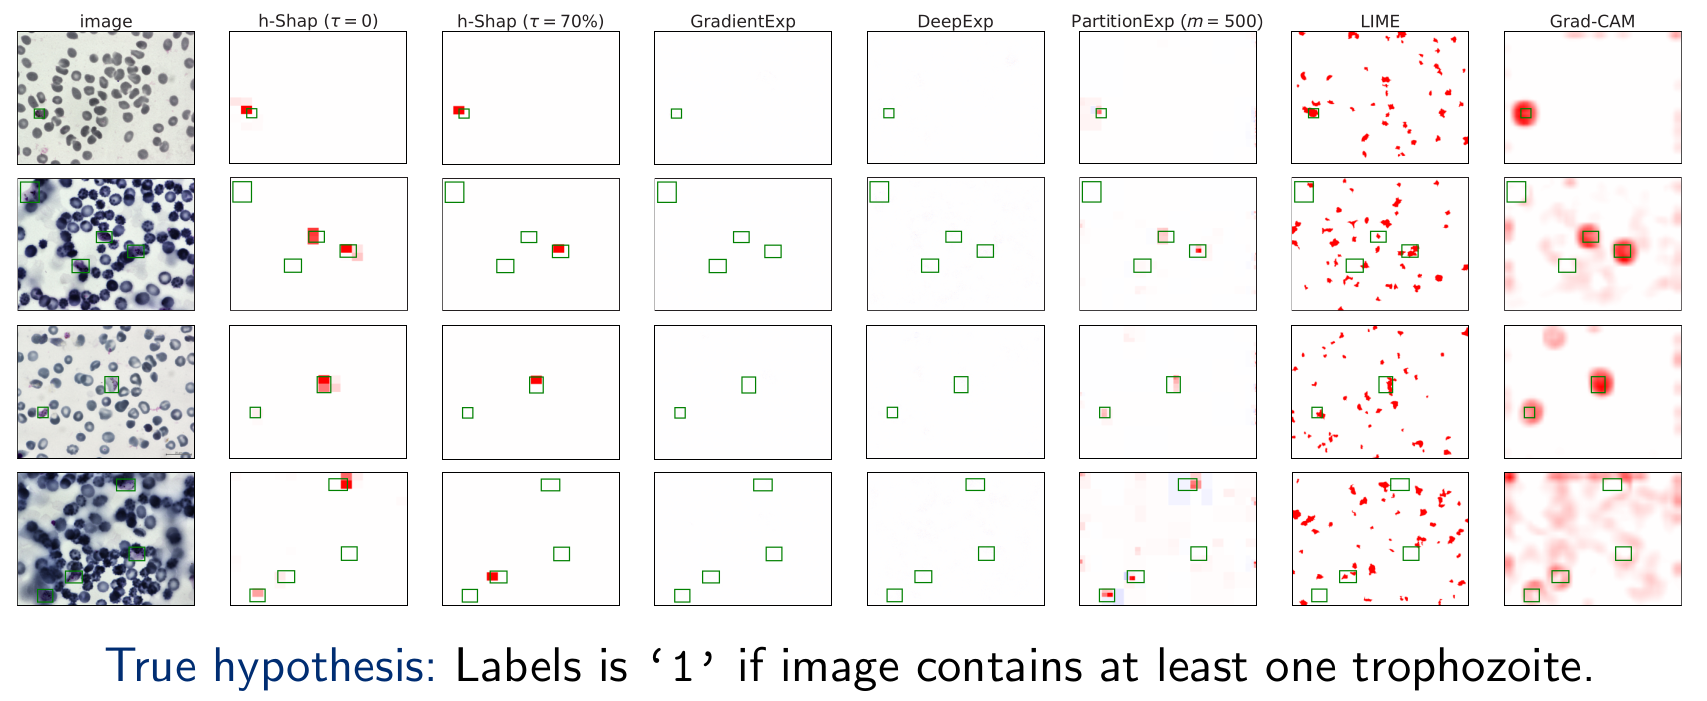
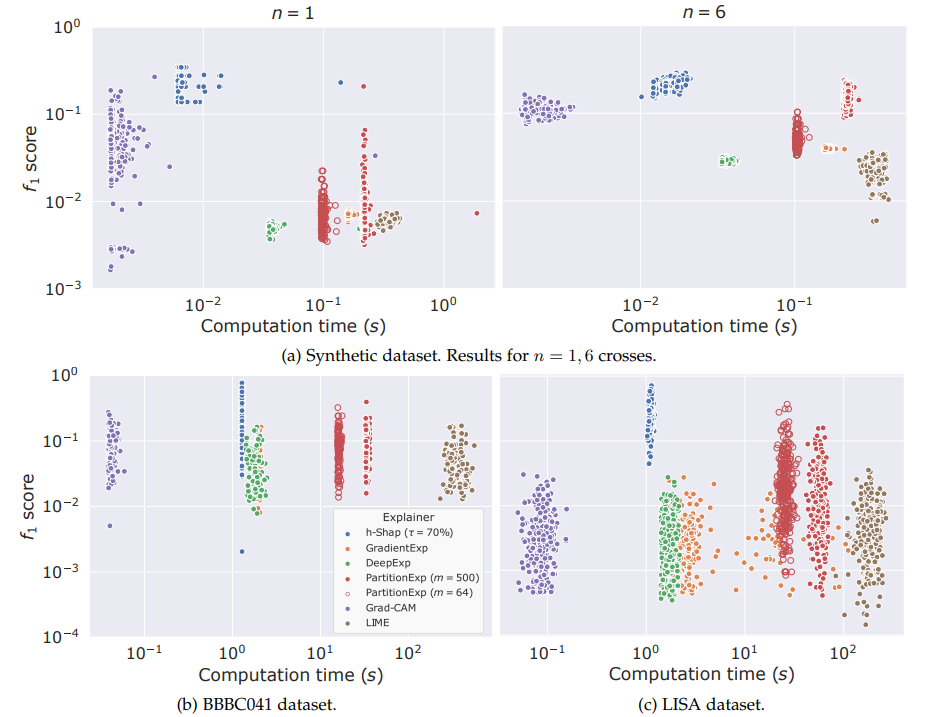
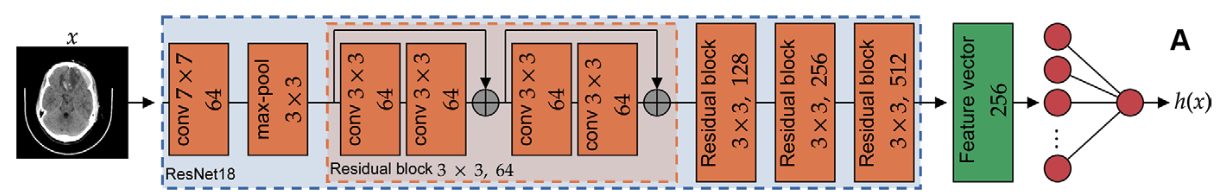
Fast hierarchical games for image explanations, Teneggi, Luster & S., IEEE Transactions on Pattern Analysis and Machine Intelligence, 2022

-
Hierarchical Shapley (h-Shap)
[Teneggi et al, 2022]
Question 4:
What can we do with them?
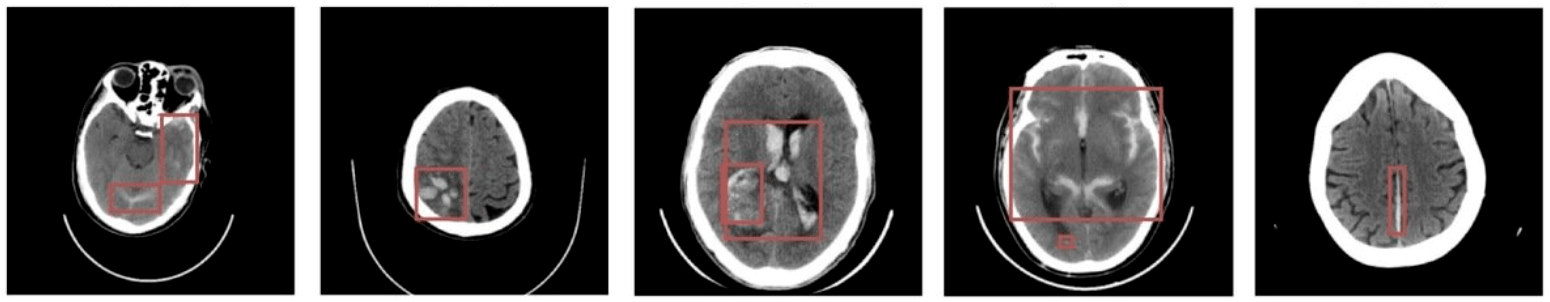
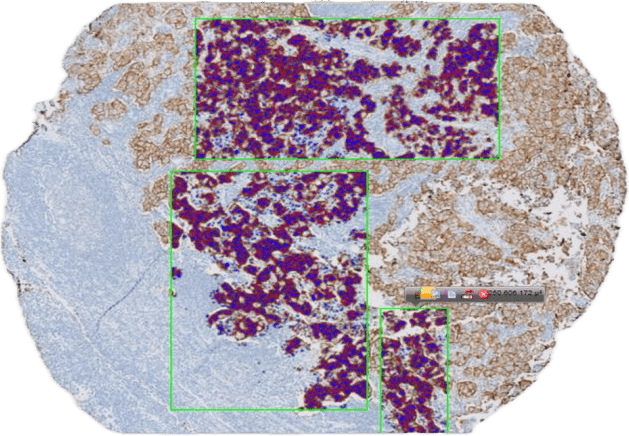
Hemorrhage detection in head CT
Question 4:
What can we do with them?
Image-by-image supervision (strong learner)
one label per image!
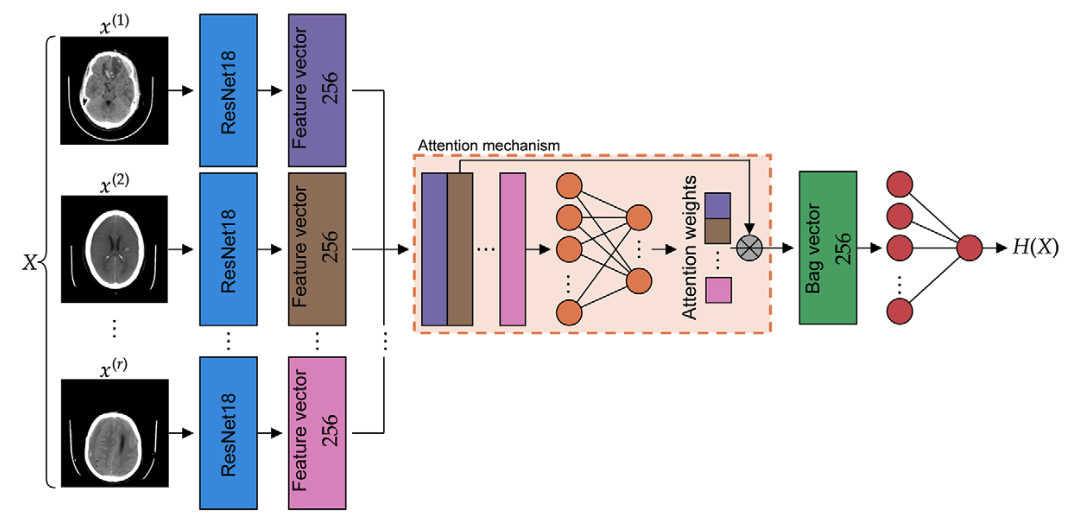
Study/volume supervision (weak learner)
one label per study!
Question 4:
What can we do with them?
Weak learner is more efficient for detecting positive slices
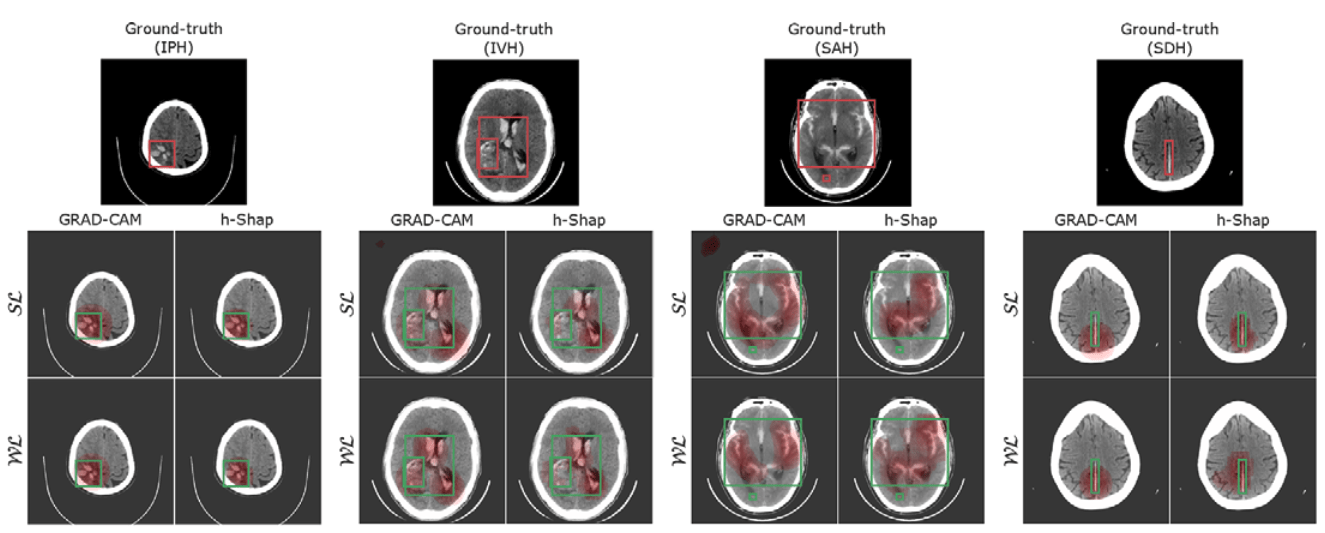
-
Can find hemorrhages without labels
Image-by-image supervision (strong learner)
one label per image!
Study/volume supervision (weak learner)
one label per study!
Teneggi, J., Yi, P. H., & Sulam, J. (2023). Examination-level supervision for deep learning–based intracranial hemorrhage detection at head CT. Radiology: Artificial Intelligence

Interpreting machine learning predictors for discovery in biology?
1. Interpreting Opaque ML models
2. Interpretable ML models
sick
healthy
[Marilyn Bui]Cancer biology/pathology
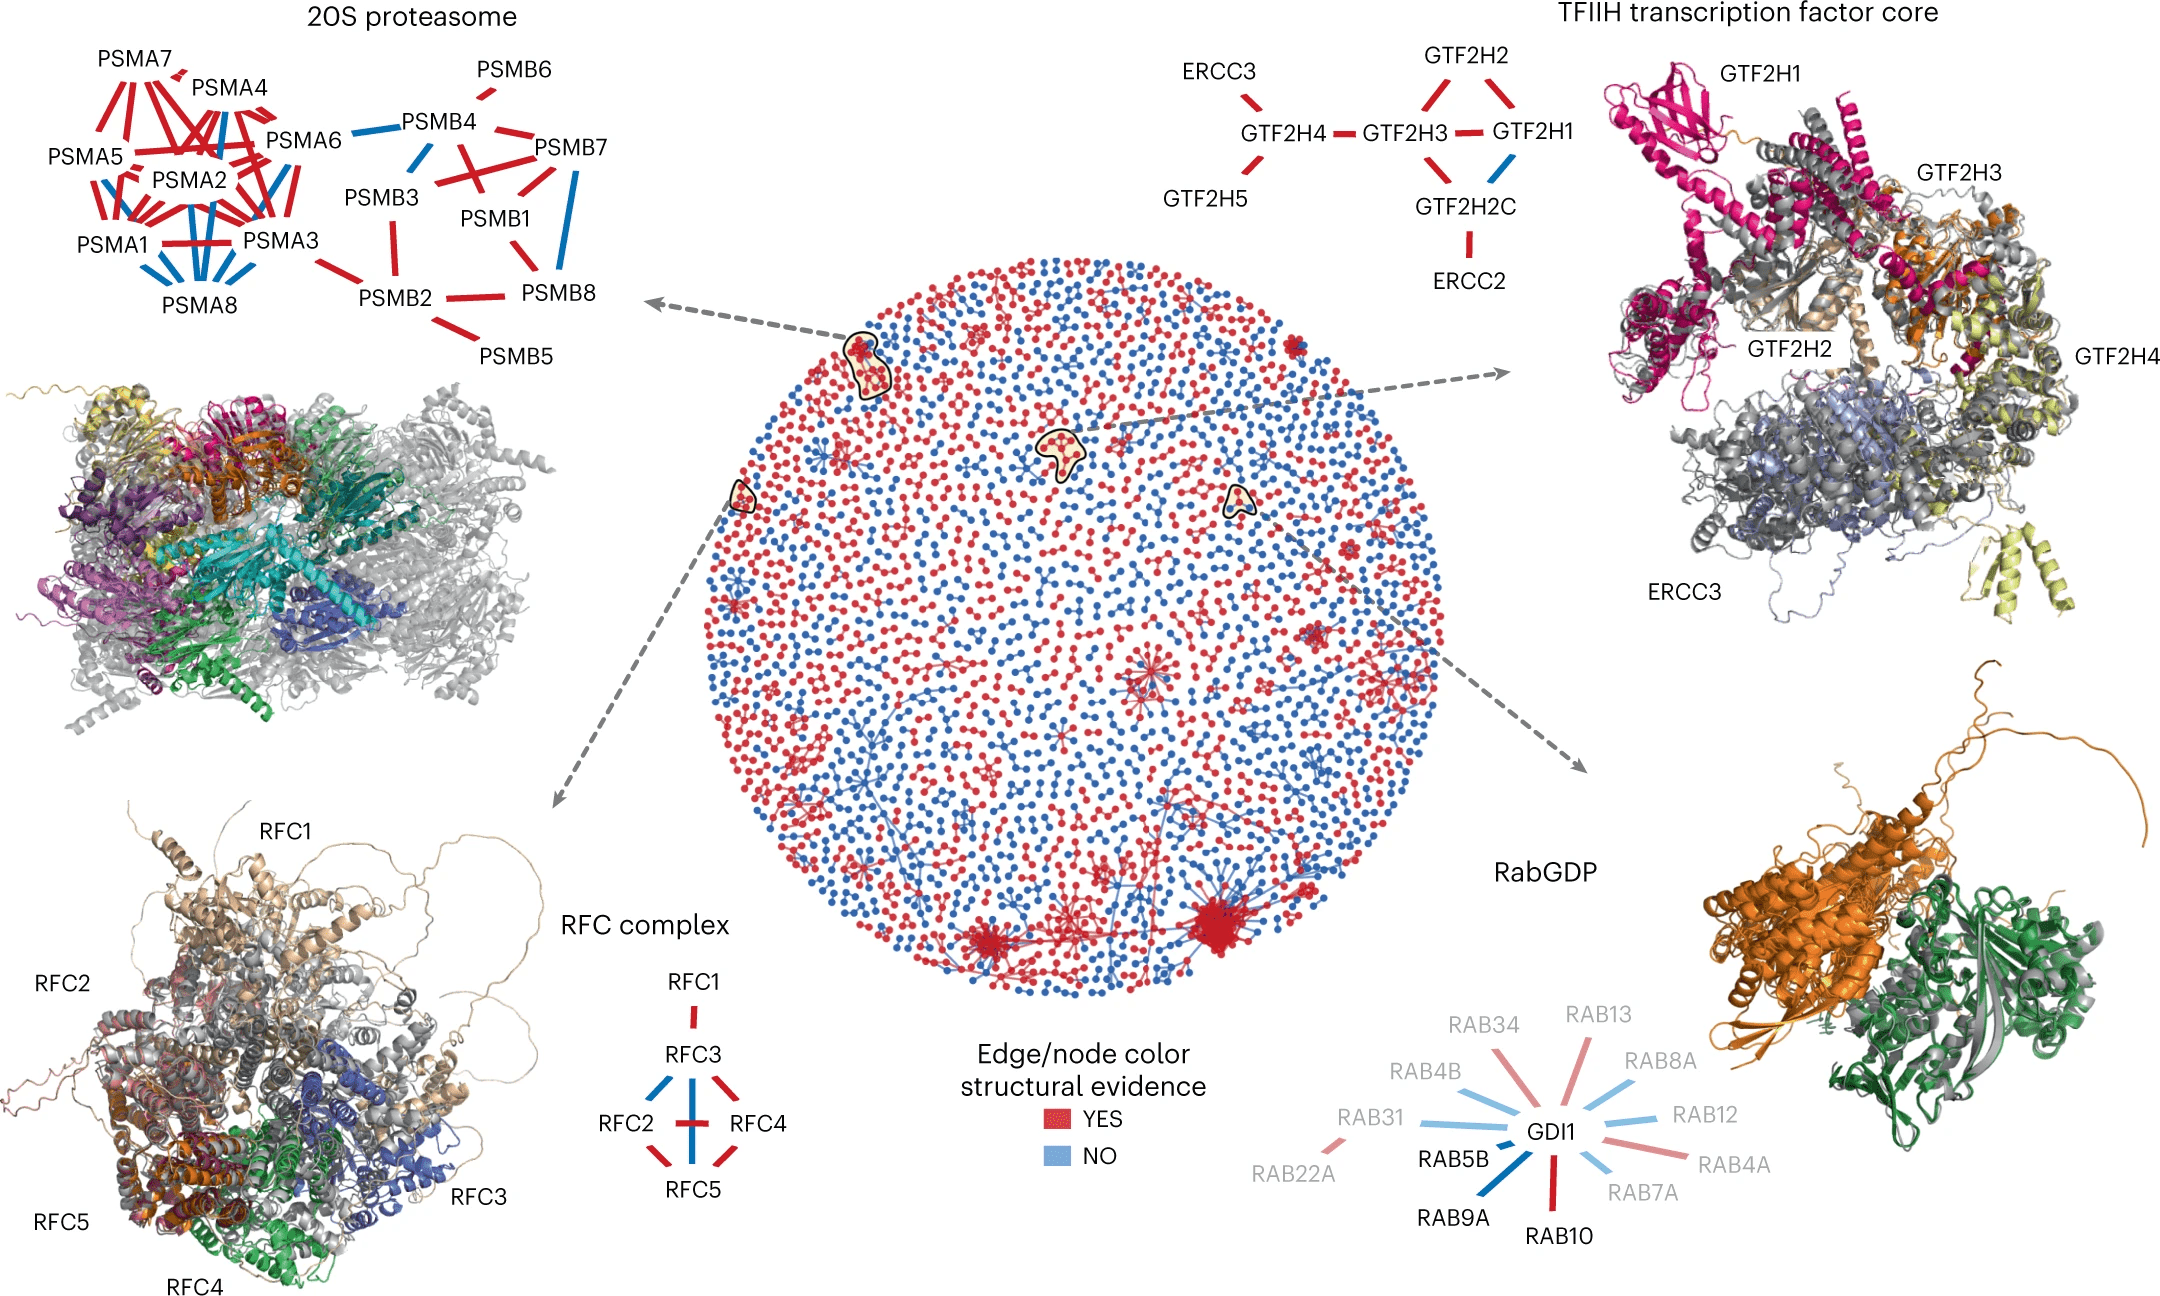
[Burke et al]
Protein-Protein interactions
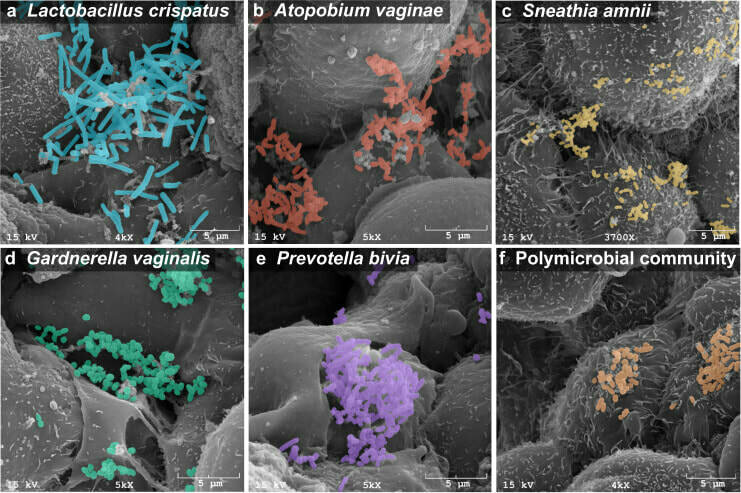
[Herbst-Kralovetz Lab]
Host/microbe interactions
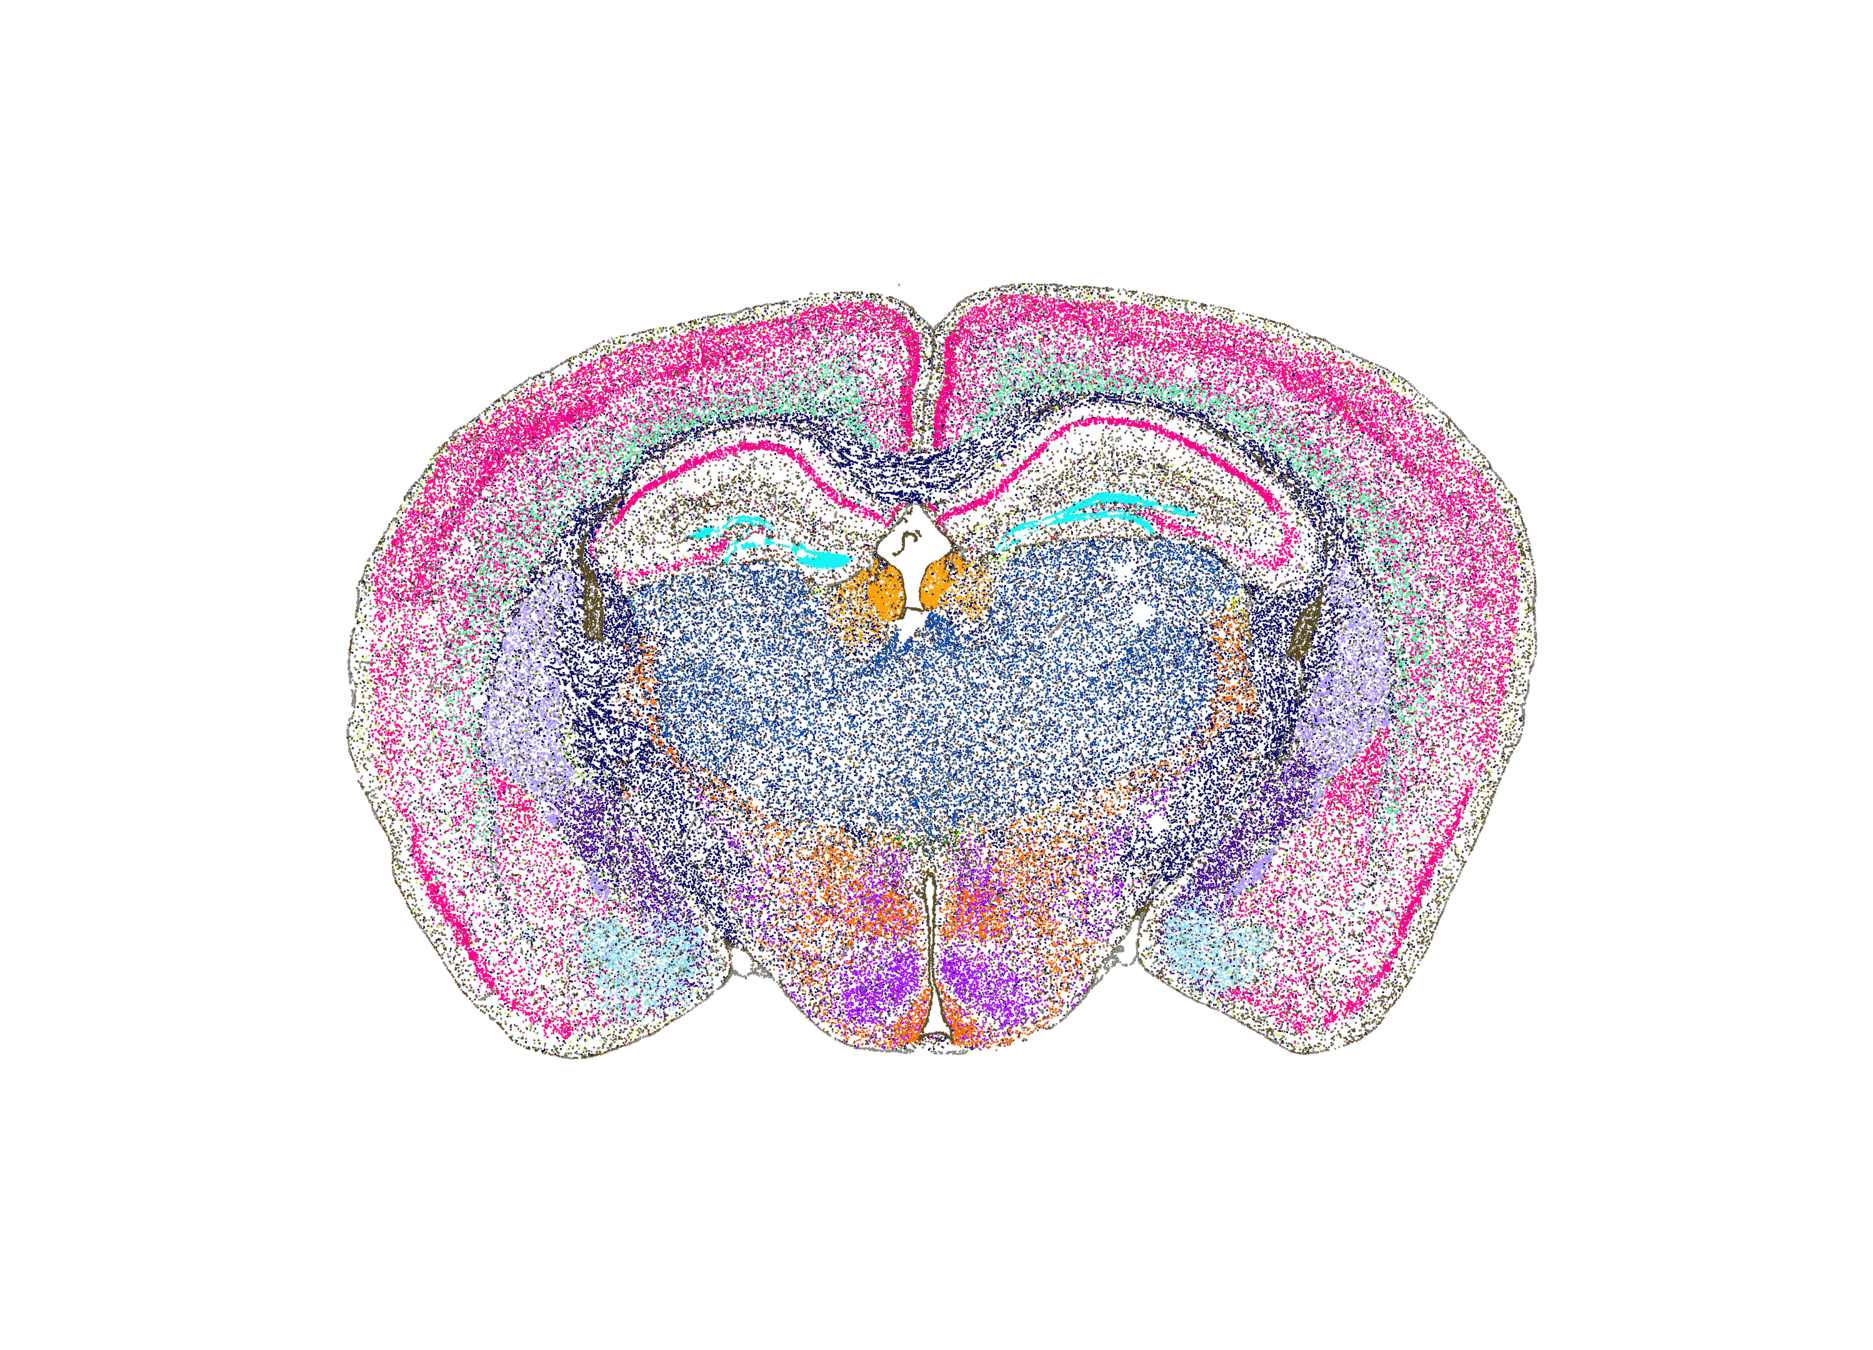
[Allen Institute]
Spatial transcriptomics
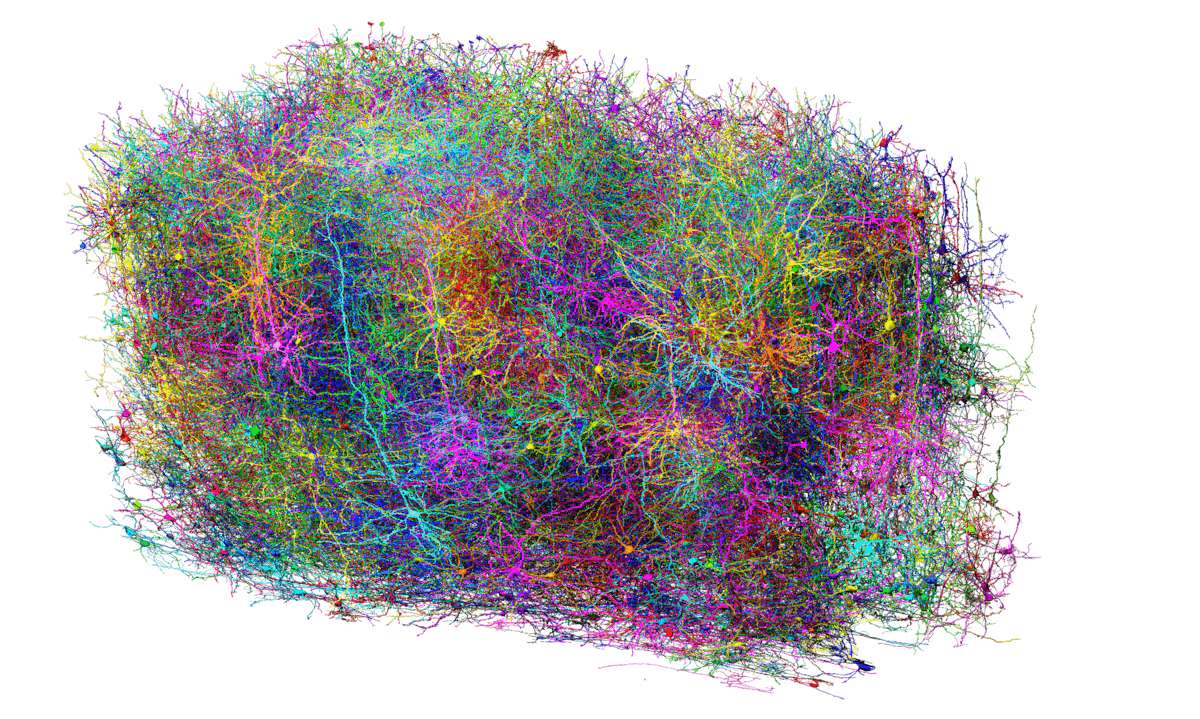
[MICrONs]Connectomics
How can we learn descriptive local patterns for different phenotypes?
2. Interpretable ML models
Breast Cancer
- Highly heterogeneous: multiple subtypes (e.g., HR+/HER2−, HER2+, TNBC), distinct biological and clinical behavior, subtype-specific treatment strategies.
-
HR+/HER2- (Hormone Receptor-Positive, HER2-Negative)
- Express estrogen/progesterone receptors but not HER2
- Generally favorable prognosis
-
HER2+ (HER2-positive, regardless of HR)
- Over-express HER2 (a receptor that promotes cell growth).
- Traditionally poor prognosis, now better with therapy
-
TNBC (Triple negative breast cancer)
- Don't express estrogen, progesterone, nor HER2 receptors
- Aggressive, poor prognosis - good immunotherapy in some cases!
Breast Cancer
-
Highly heterogeneous: multiple subtypes (e.g., HR+/HER2−, HER2+, TNBC), distinct biological and clinical behavior, subtype-specific treatment strategies.
- Subtypes are limited clinical biomarkers for prognosis (or therapeutic response)
- Tumor MicroEnvironment (TME) influences tumor progression & treatment [Hinshaw et al, Khalaf et al]
[Jackson et al, 2020]
Breast Cancer
-
Highly heterogeneous: multiple subtypes (e.g., HR+/HER2−, HER2+, TNBC), distinct biological and clinical behavior, subtype-specific treatment strategies.
- Subtypes are limited clinical biomarkers for prognosis (or therapeutic response)
-
Tumor MicroEnvironment (TME) influences tumor progression & treatment [Hinshaw et al, Khalaf et al]
- Imaging Mass Cytometry (IMC): "large" and new datasets of protein expression
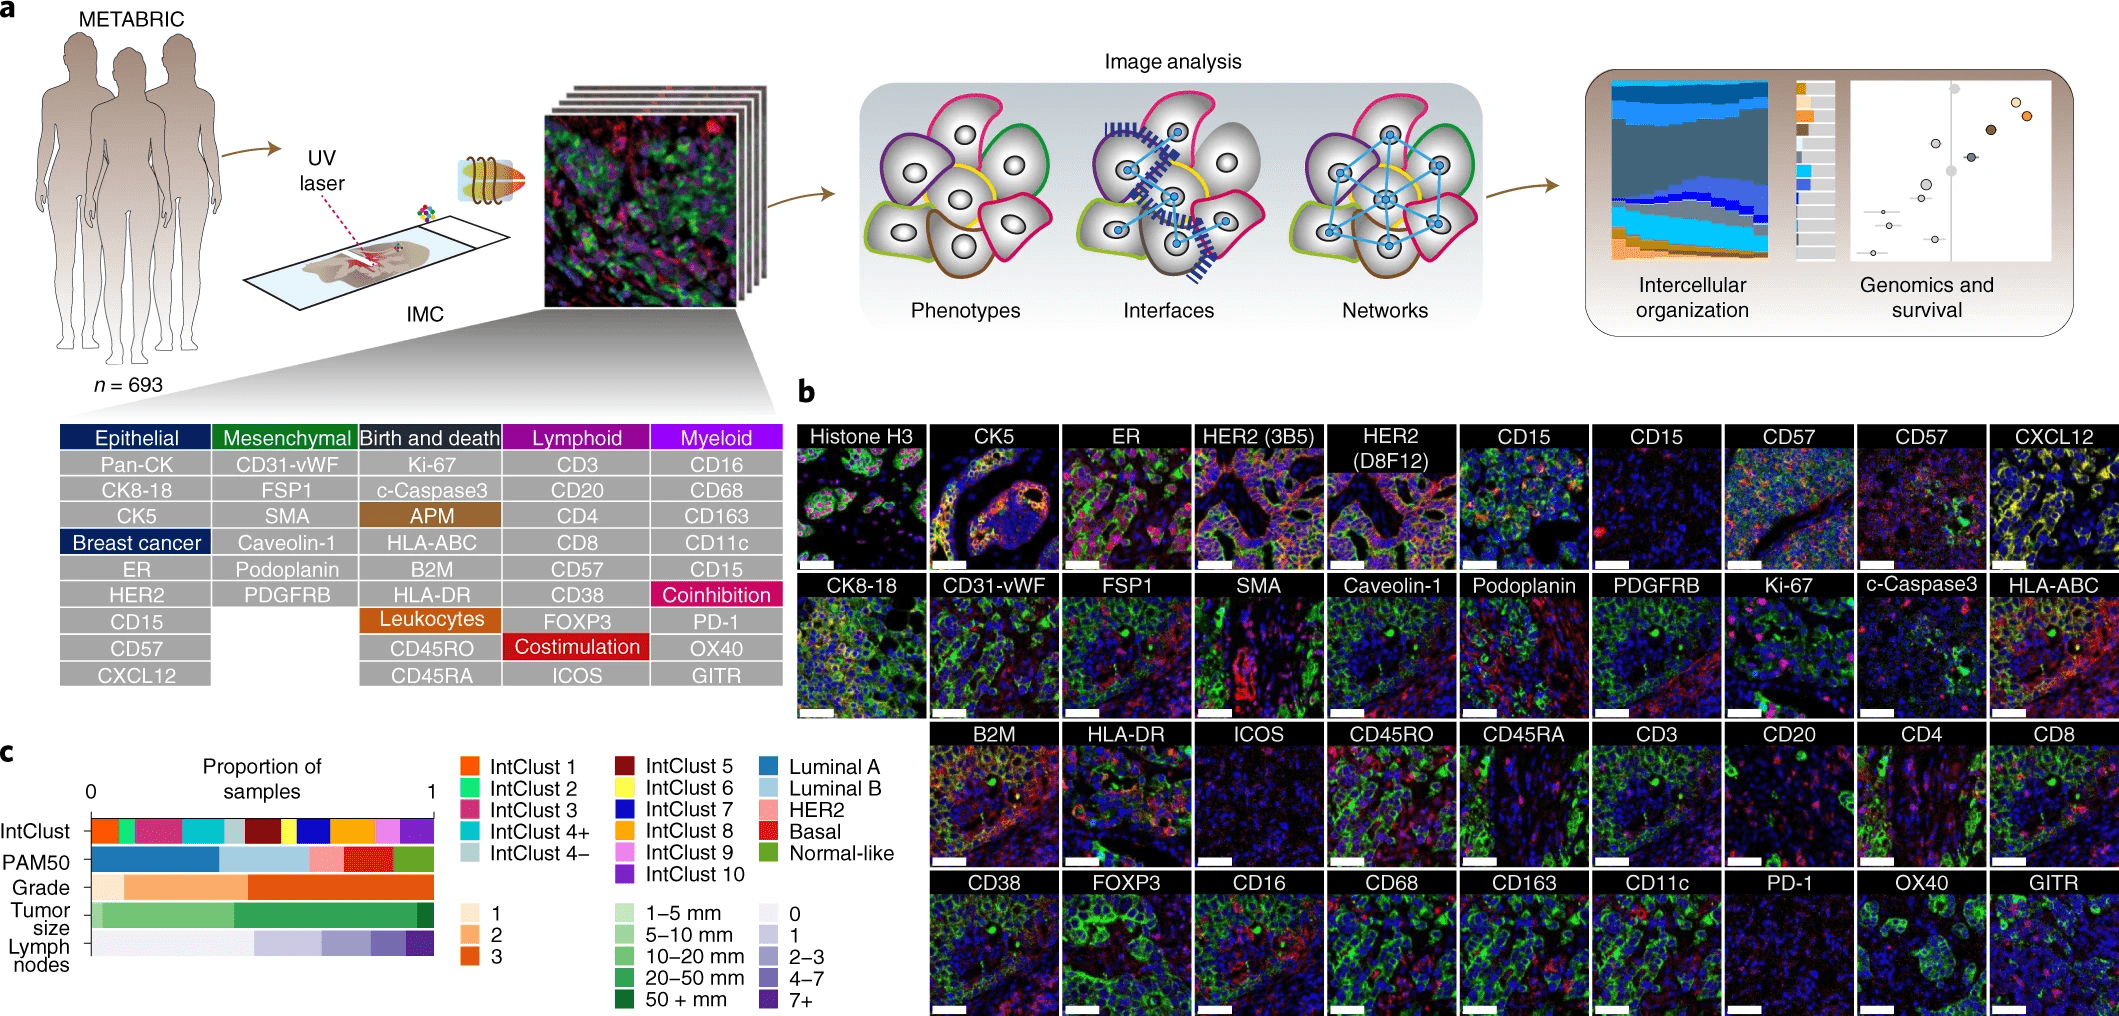
[Danenberg et al, 2022]Breast Cancer: data
- 37 proteins simultaneously (independent channels)
- n = 693
-
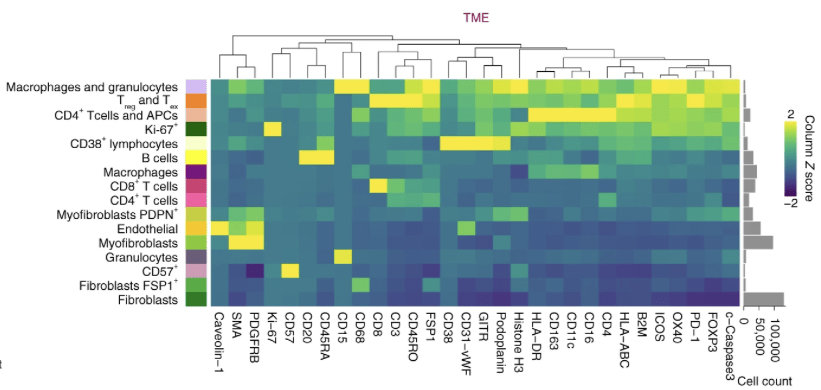
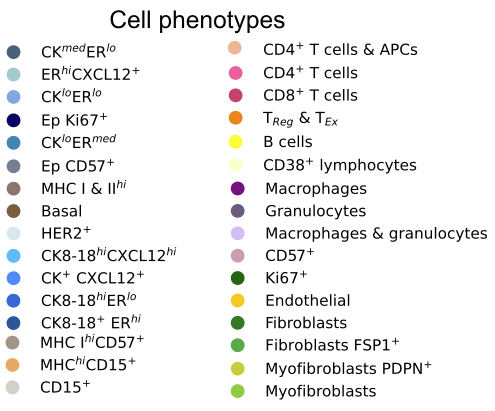
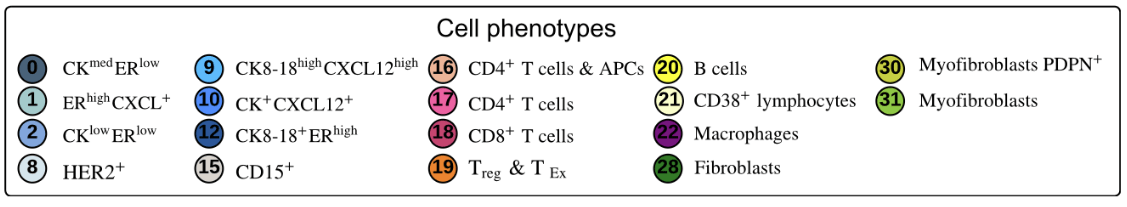
32 cell phenotypes are identified from different protein expressions
- e.g. a cell expressing \(\texttt{CD3}\) and \(\texttt{CD8}\) is (likely) a \(\texttt{cytotoxic T cell}\)
a cell expressing \(\texttt{CD68}\) is likely a \(\texttt{macrophage}\)
[Danenberg et al, 2022]- Imaging Mass Cytometry (IMC): "large" and new datasets of protein expression
- 37 proteins simultaneously (independent channels)
- n = 693
-
32 cell phenotypes are identified from different protein expressions
- e.g. a cell expressing \(\texttt{CD3}\) and \(\texttt{CD8}\) is (likely) a \(\texttt{cytotoxic T cell}\)
a cell expressing \(\texttt{CD68}\) is likely a \(\texttt{macrophage}\)
Breast Cancer: data
- Imaging Mass Cytometry (IMC): "large" and new datasets of protein expression
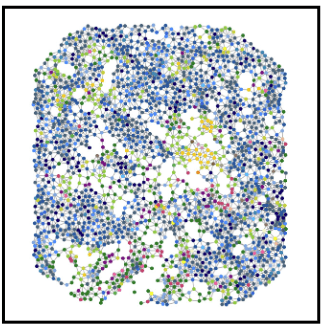
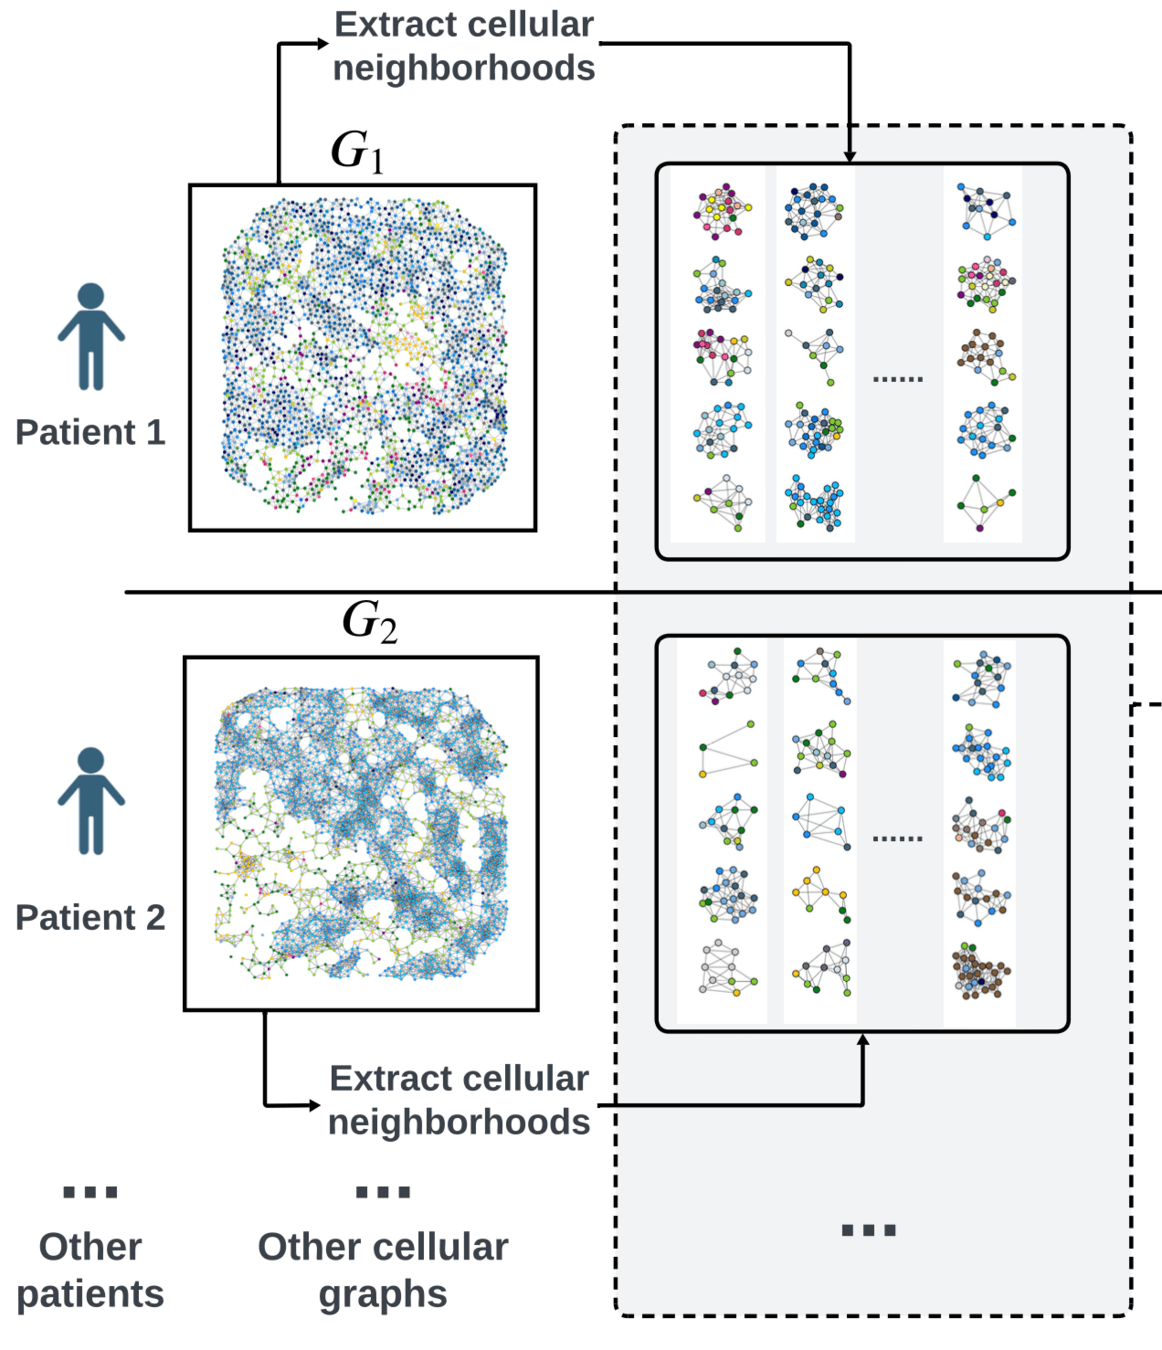
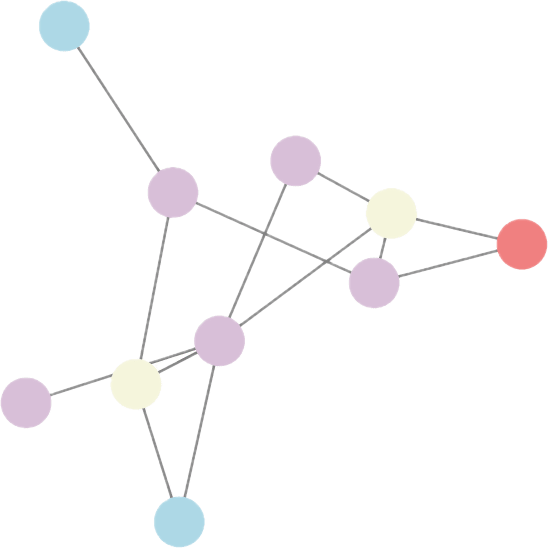
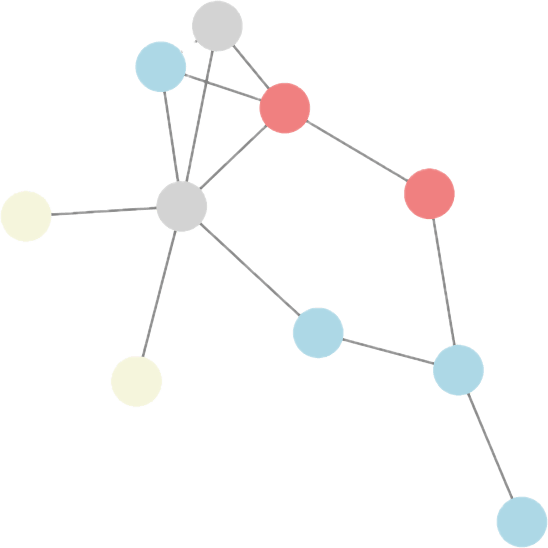
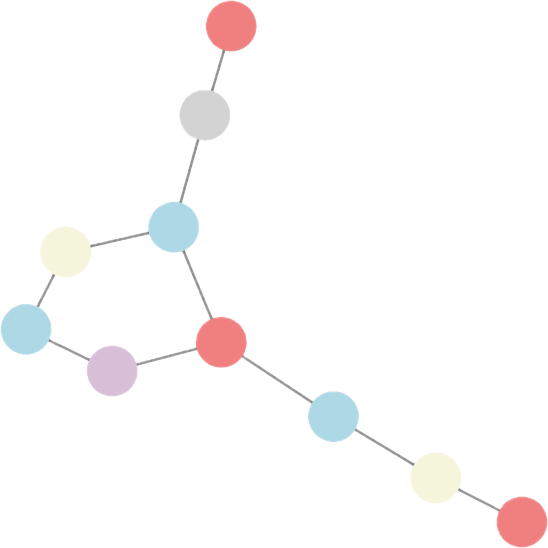
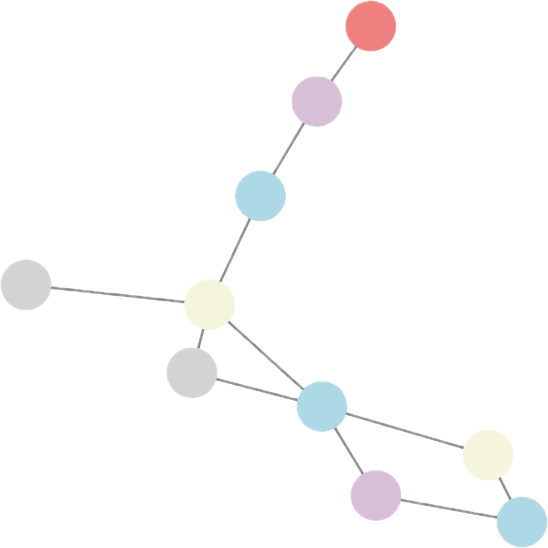
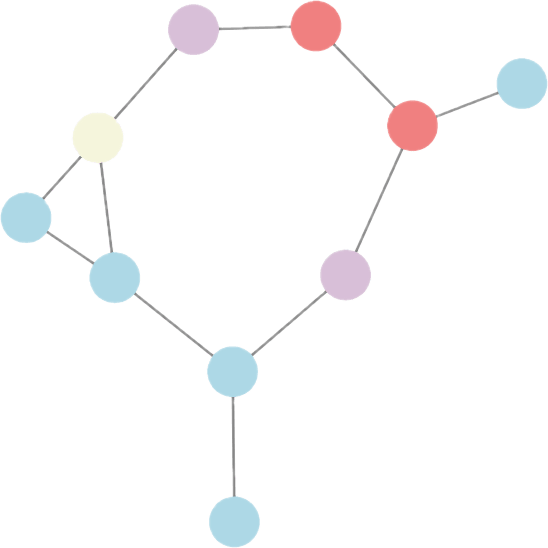
Bi-level graph learning for breast cancer biomarkers
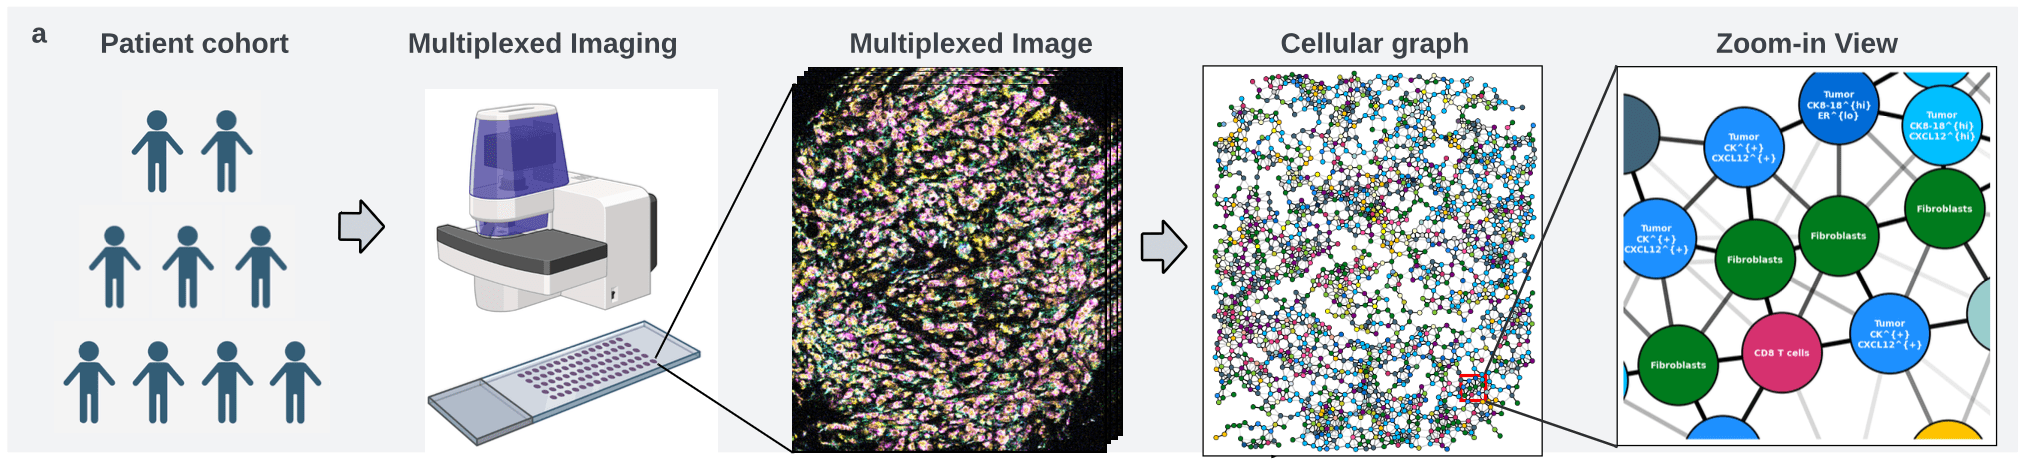
Undirected graph: \(G = (V,W)\)
Set of nodes \(v_i = (v^\text{loc}_i,x^\text{type}_i)\)
Set of edges \(W \subseteq \{(v_i,v_j)| v_i\neq v_j\} \)
cell phenotype \(x_i^\text{type} \in \{1,\dots,K\}\)
\(w_{i,j} = \exp(-\alpha \|v^\text{loc}_i-v^\text{loc}_j\|^2_2) \)
coordinates \(v_i^\text{loc} \in\mathbb R^2\)
Graph Kernels


?
?
?
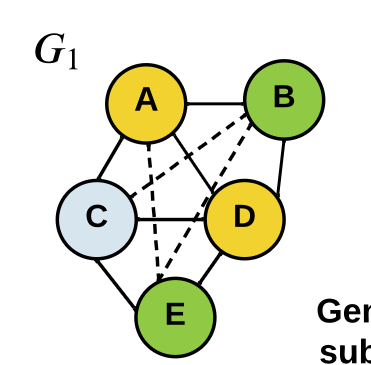
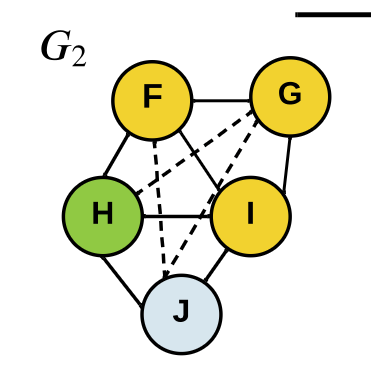
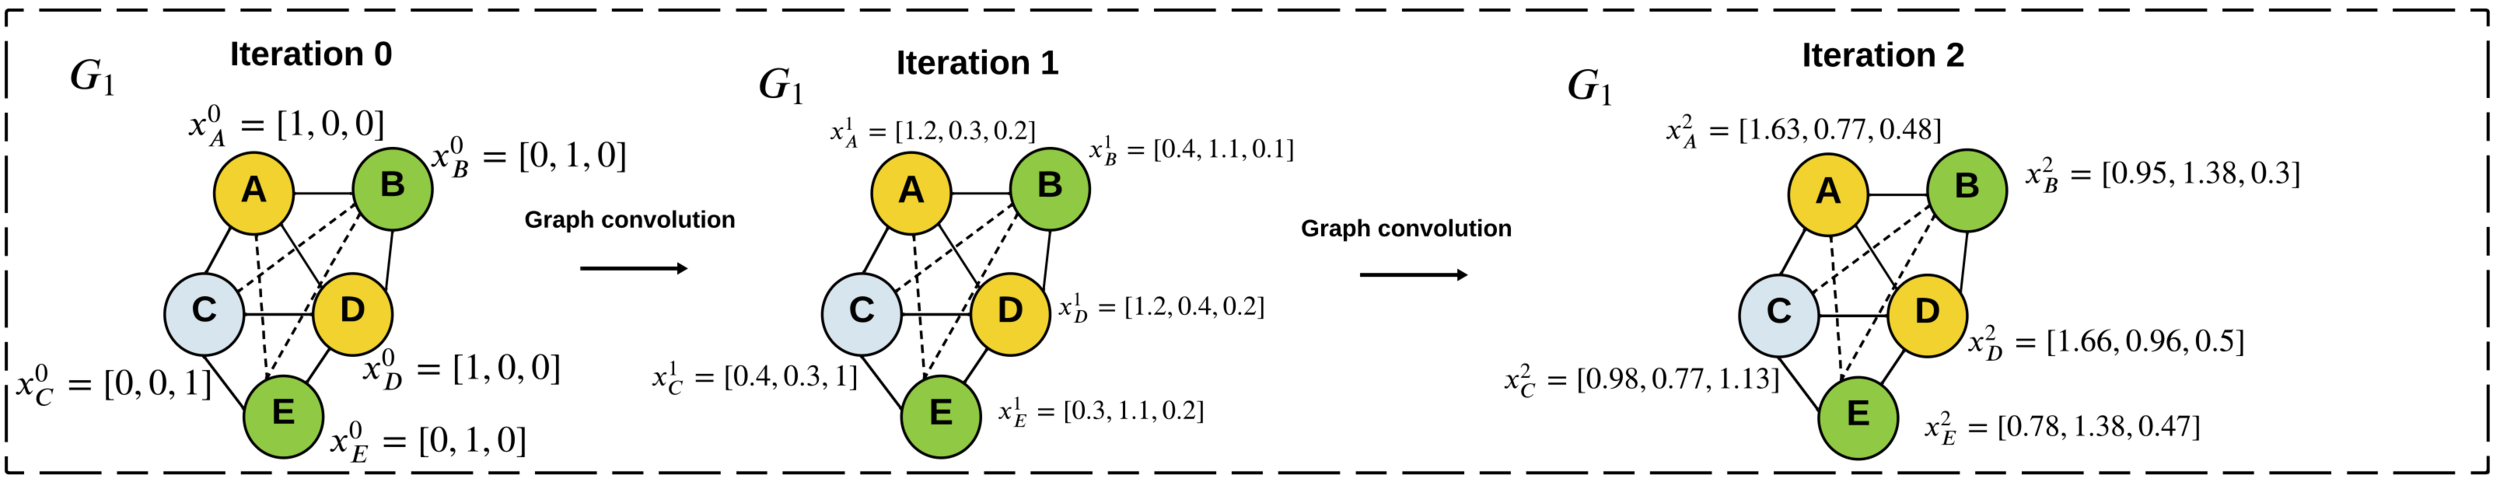
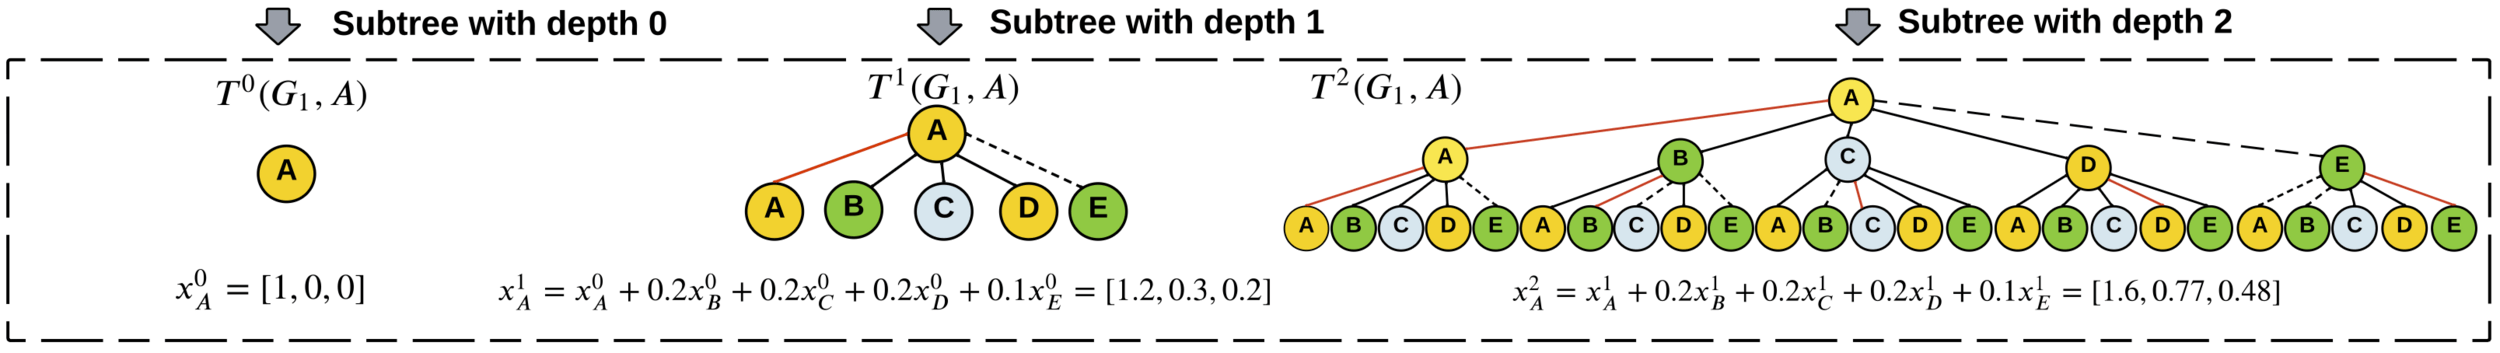
\(\displaystyle x_i^{t} = x_i^{t-1} + \sum_{v_j\in V\setminus v_i} x_j^{t-1}A_{i,j}\)
Graph Kernels
Graph Kernels
Graph Kernels
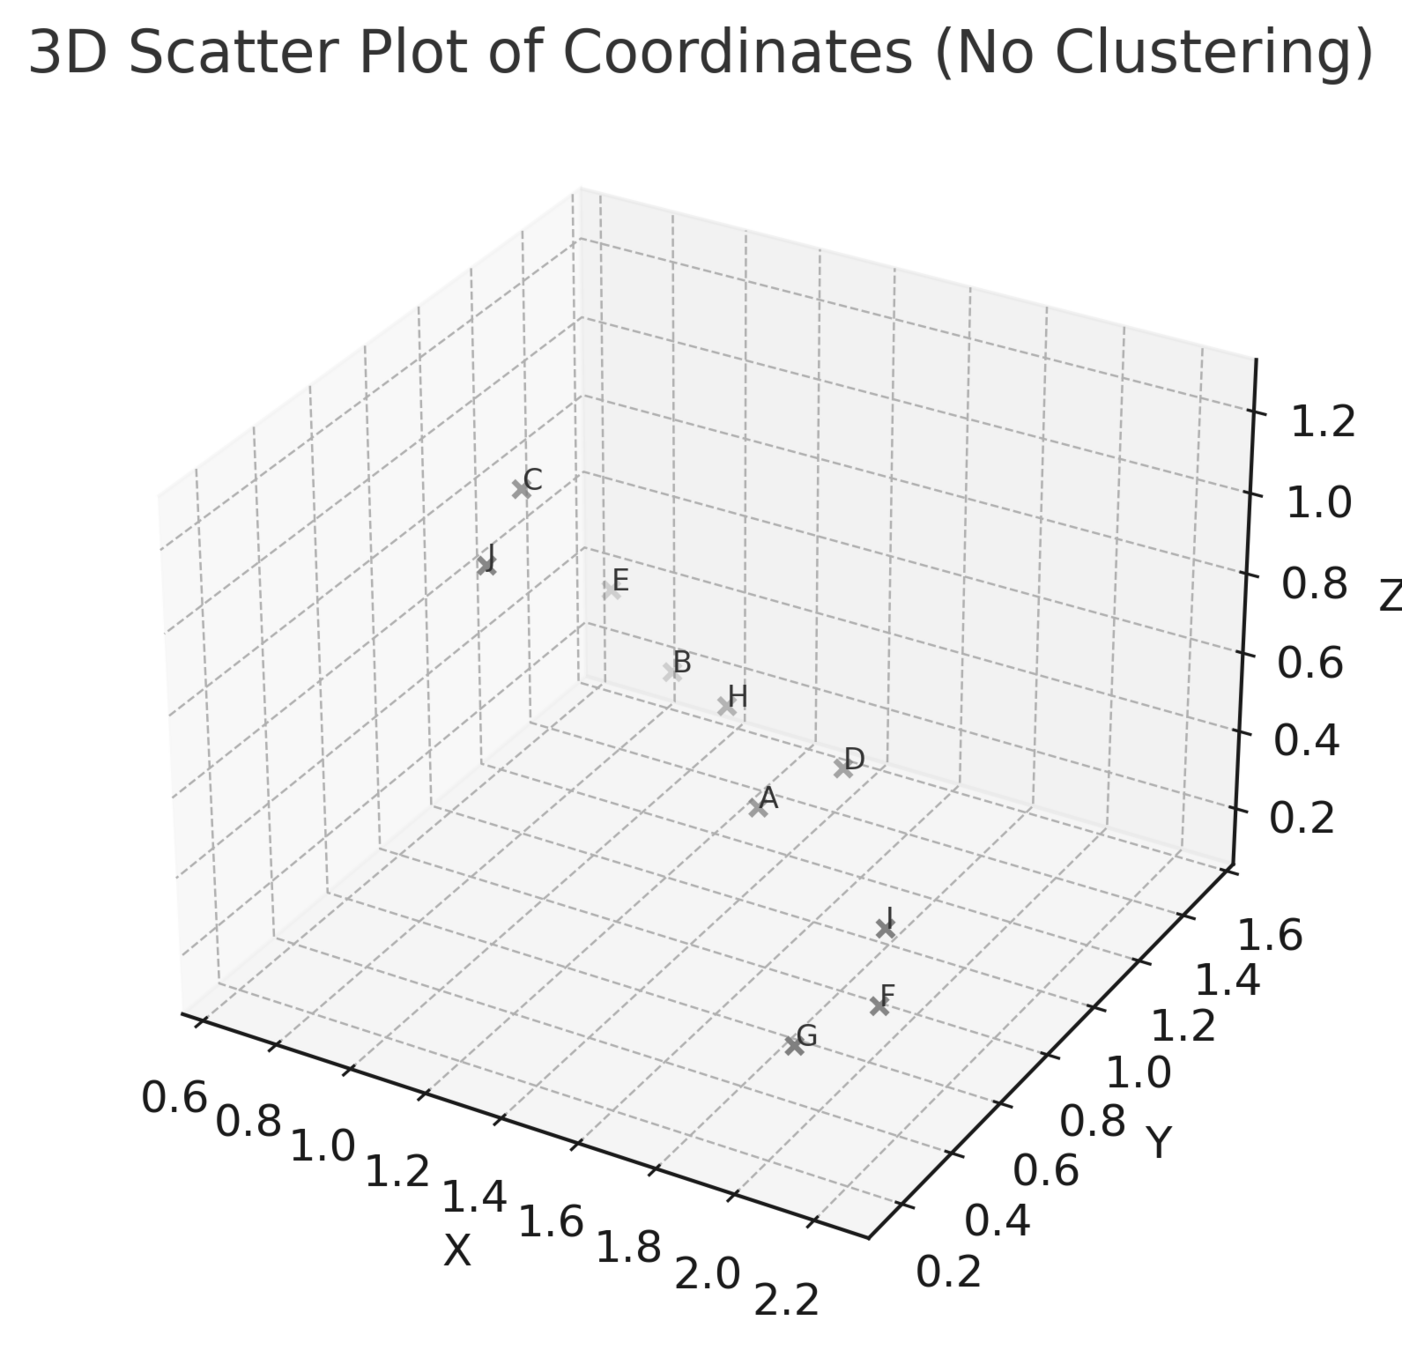
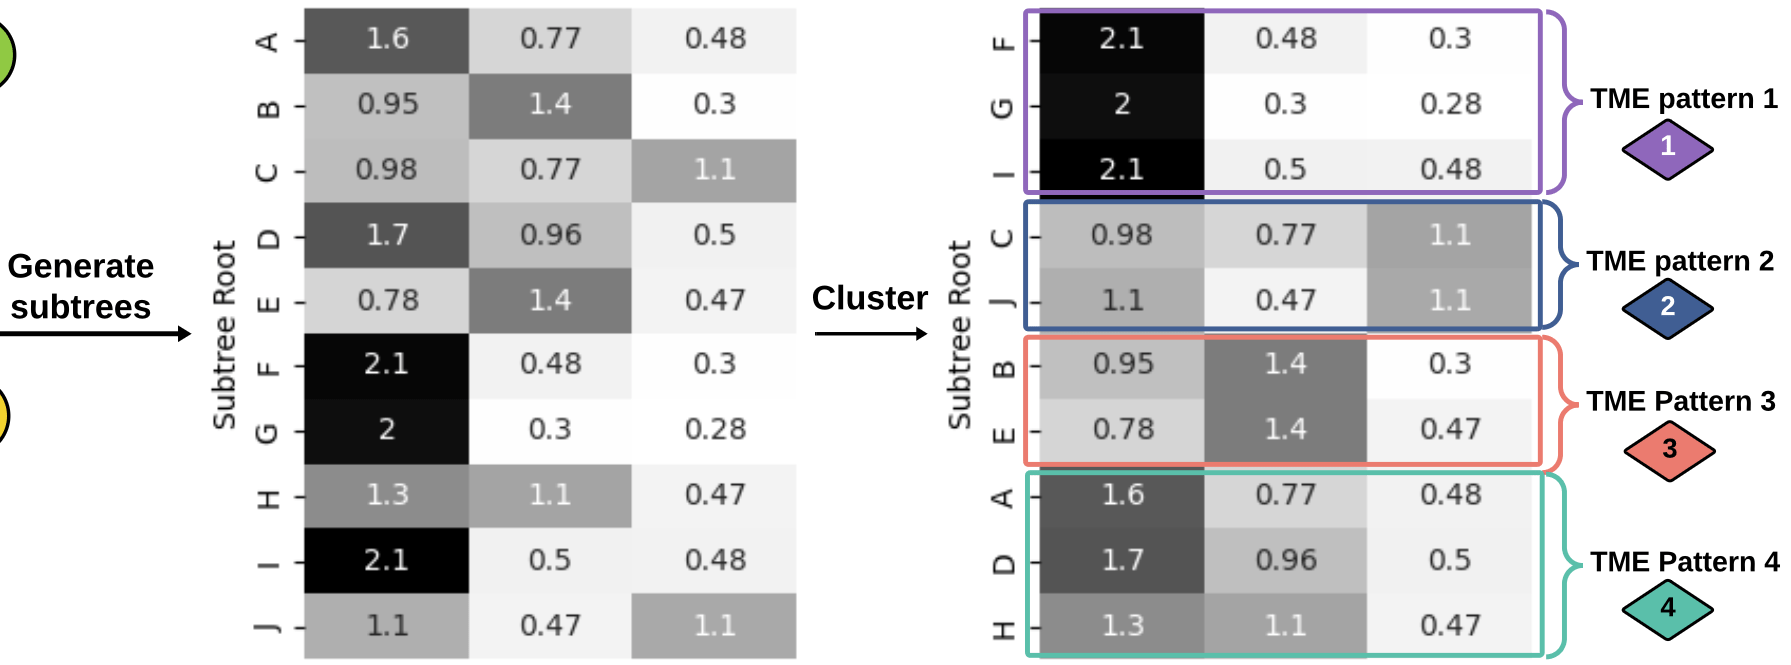
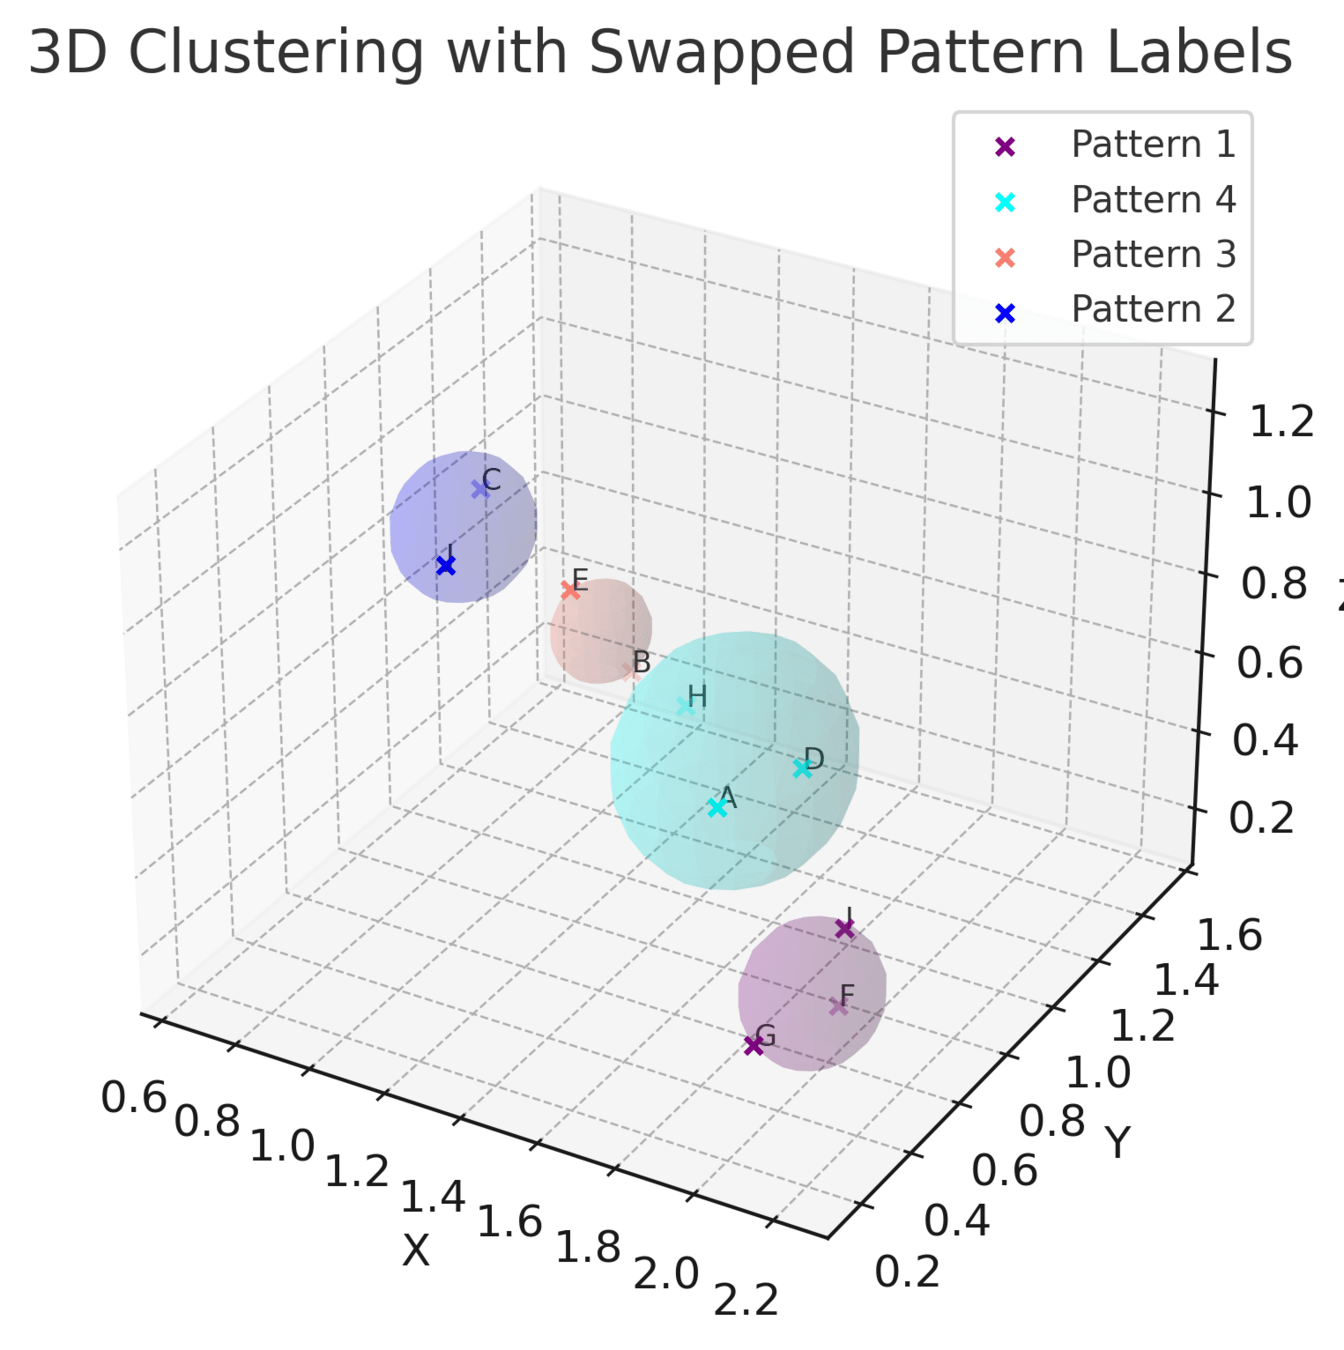
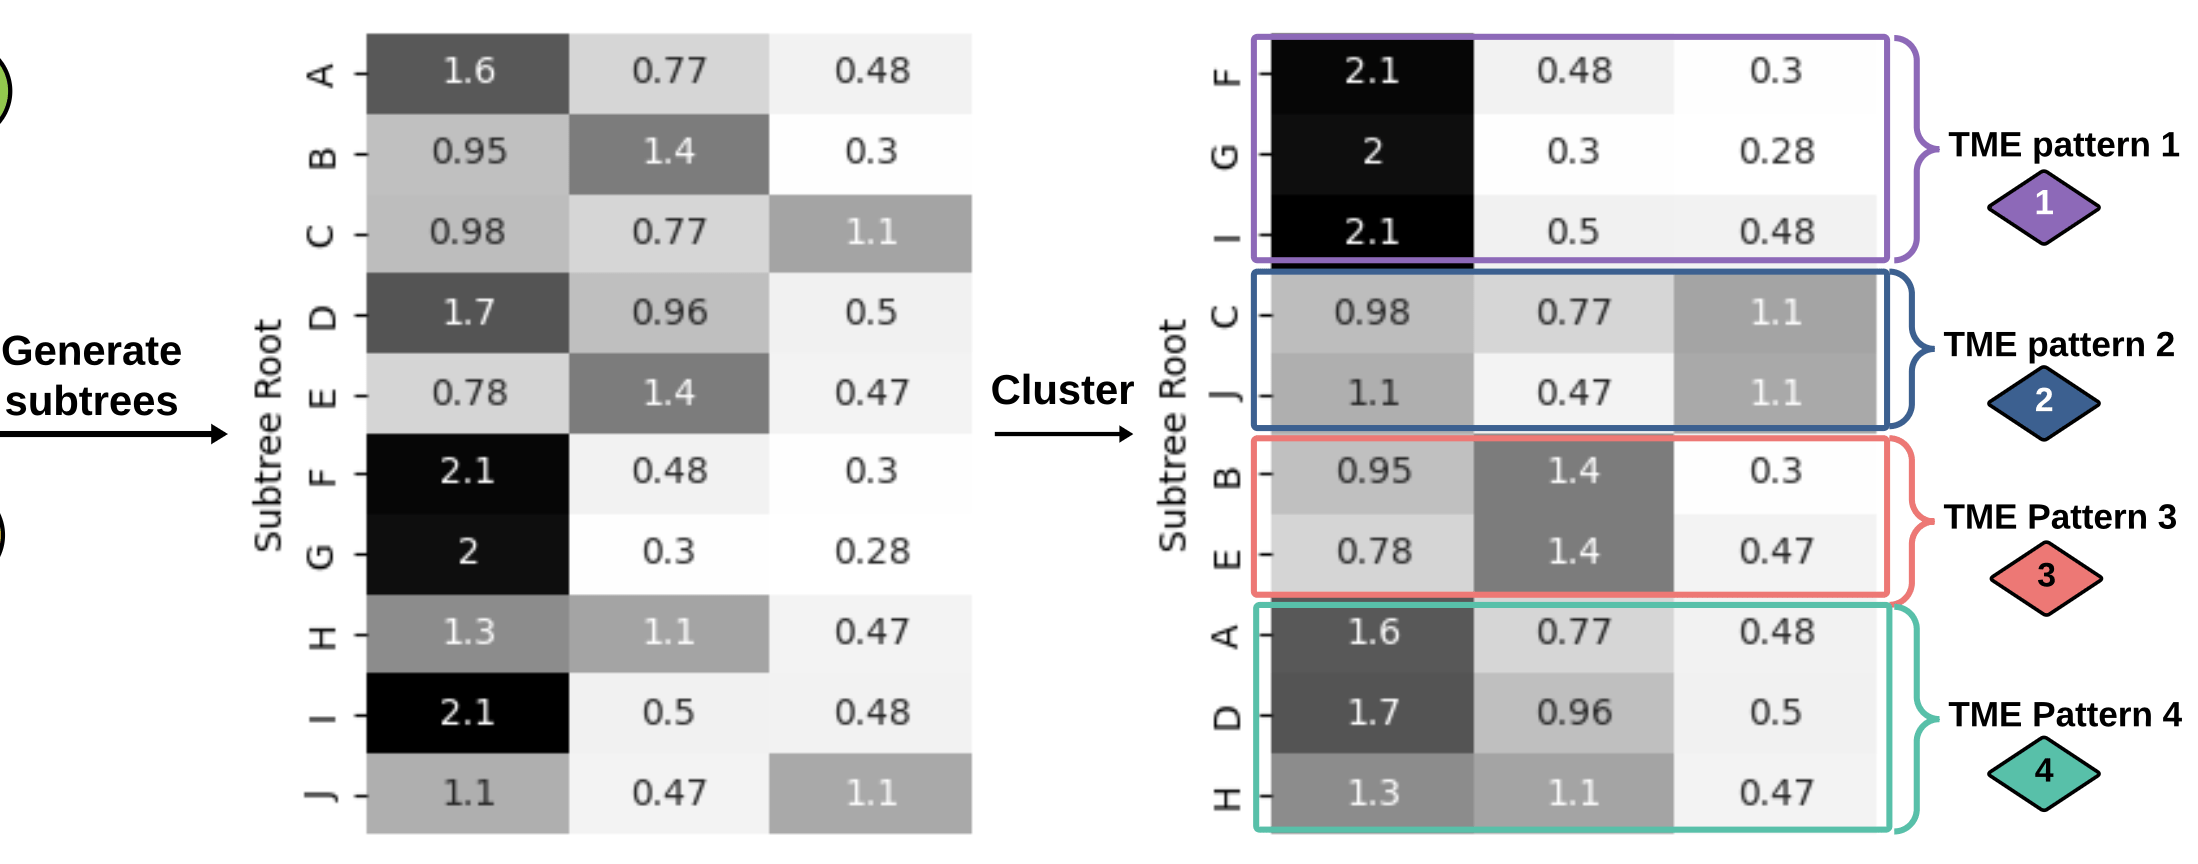
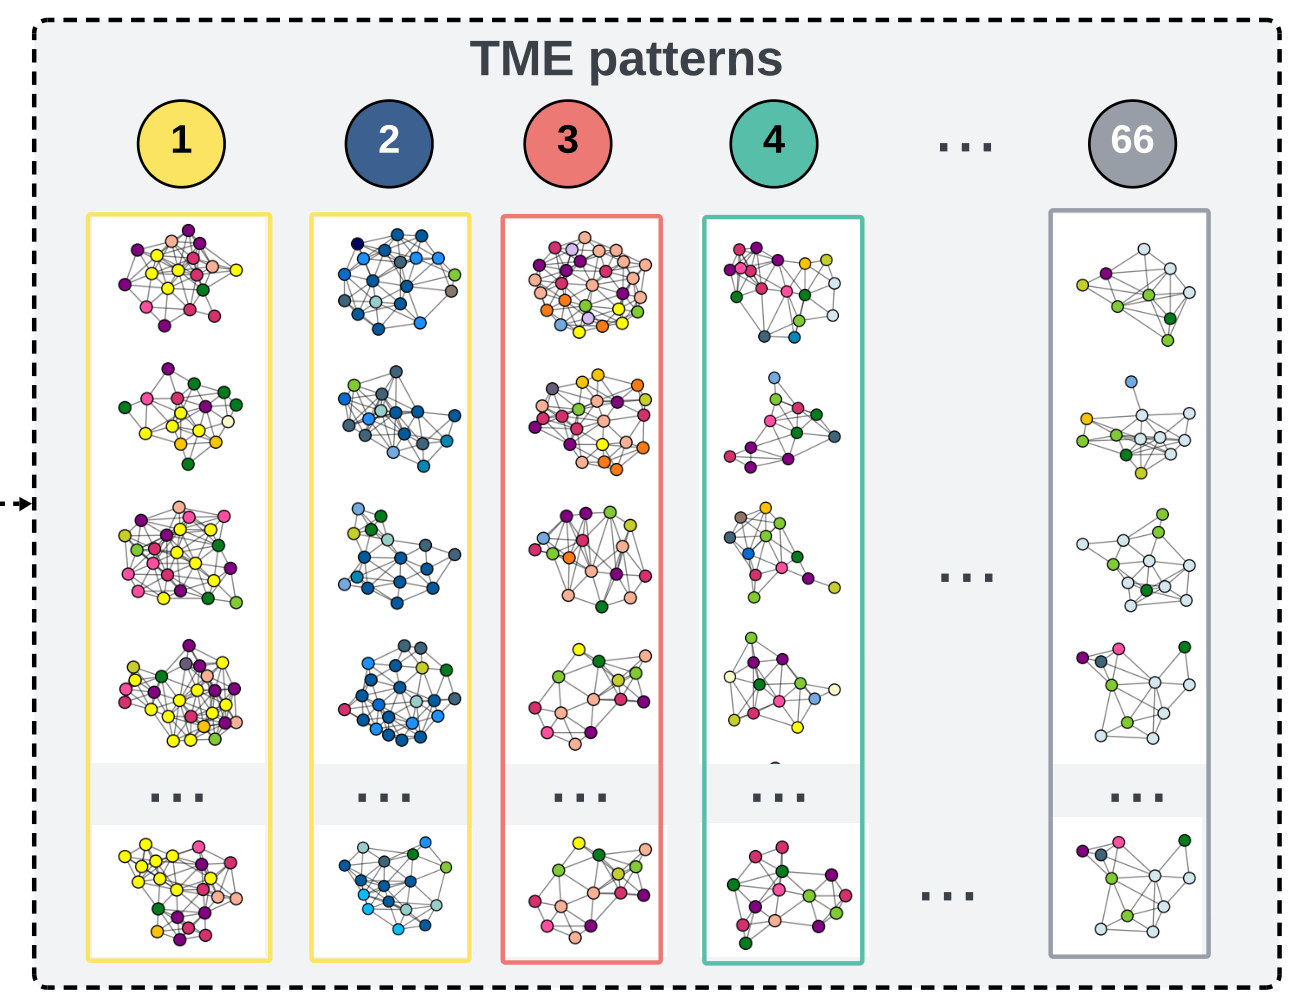
generate
subtrees
Graph Kernels
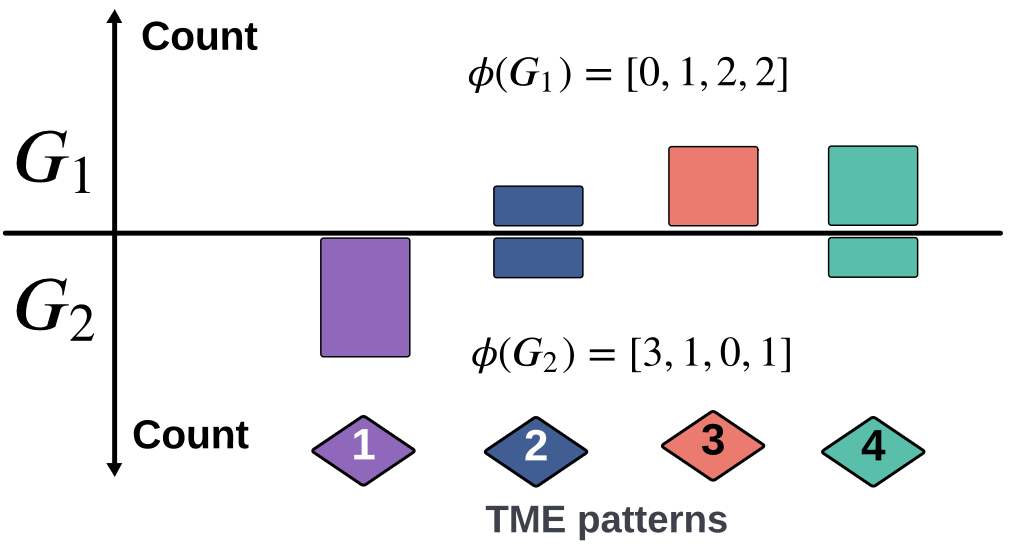
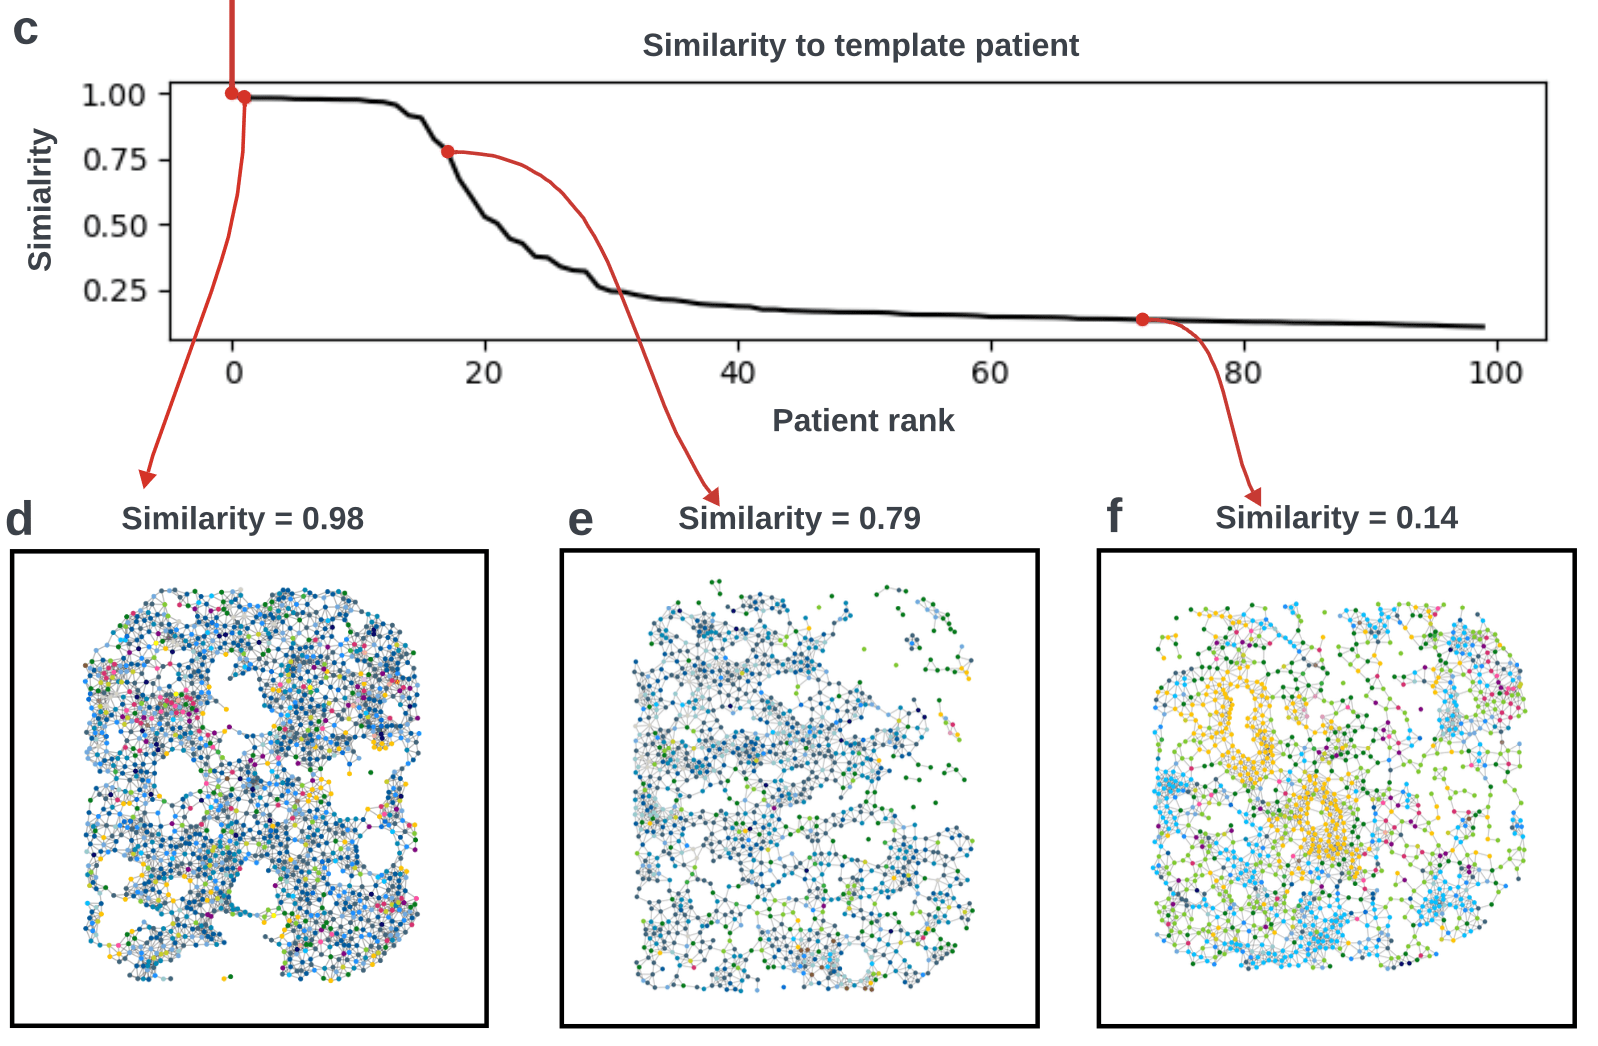
\(\kappa(G_1,G_2) = \frac{\langle \phi(G_1), \phi(G_2) \rangle}{\|\phi(G_1)\|_2\|\phi(G_2\|_2}\)
\(=0.301\)
generate
subtrees
Graph Kernels
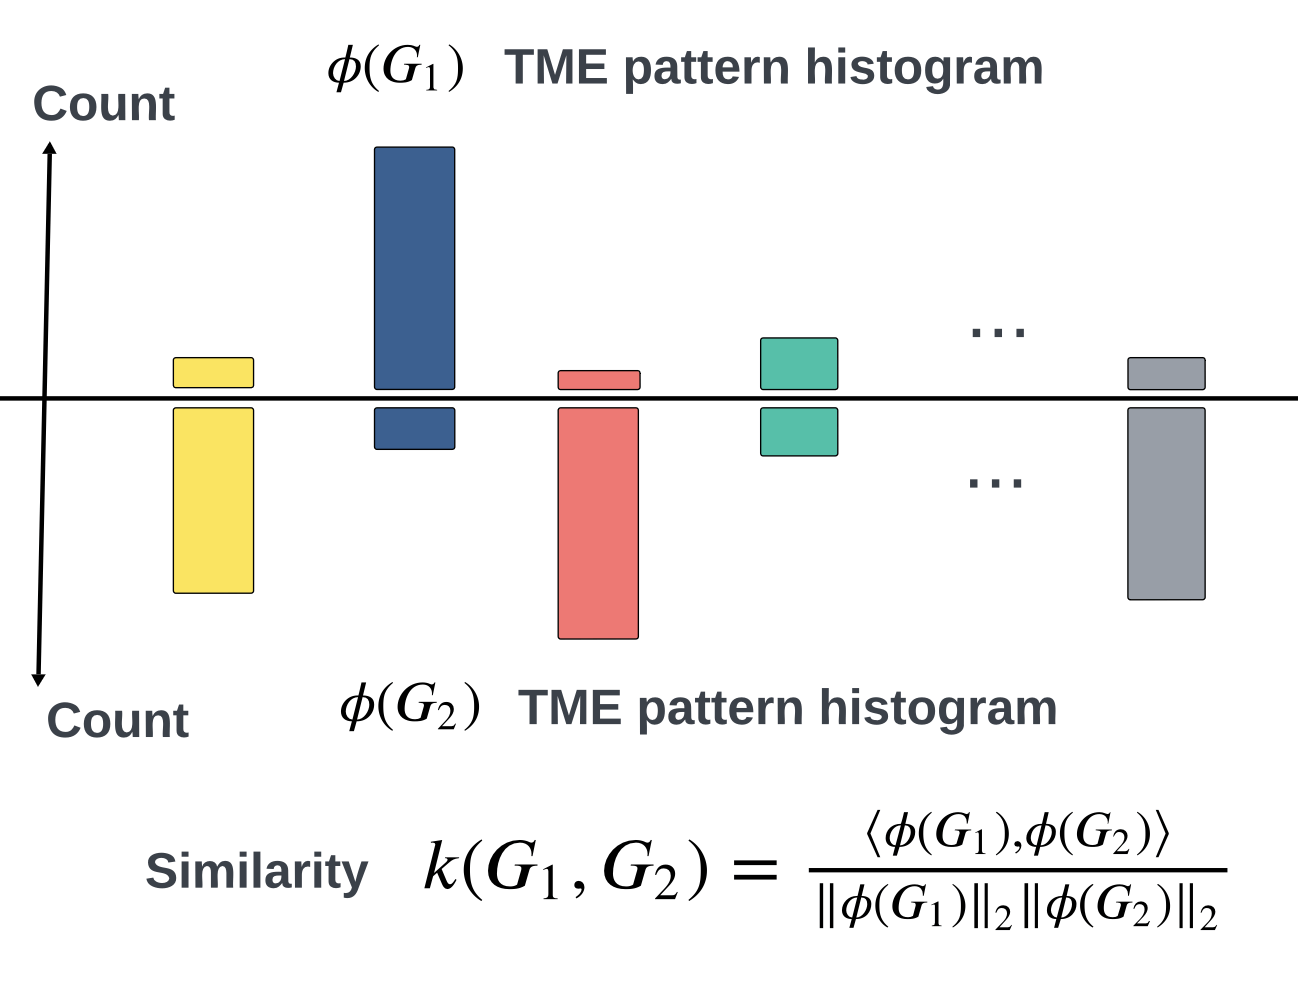
Soft WL-kernel:
[Shervashidze, et al JMLR (2011)][Schulz et al. ML (2022)]Graph Kernels
Graph Kernels

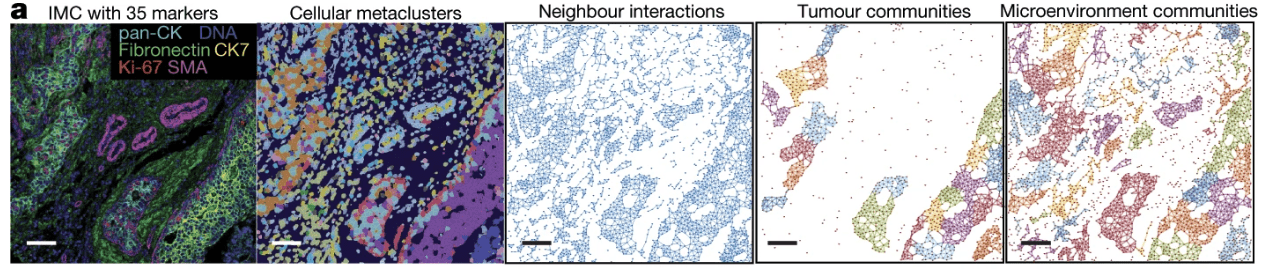
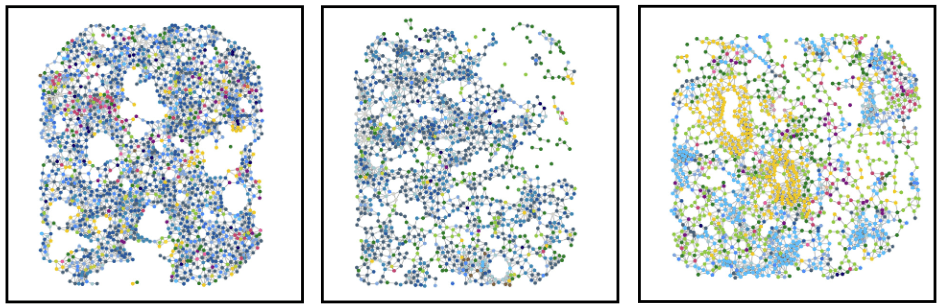
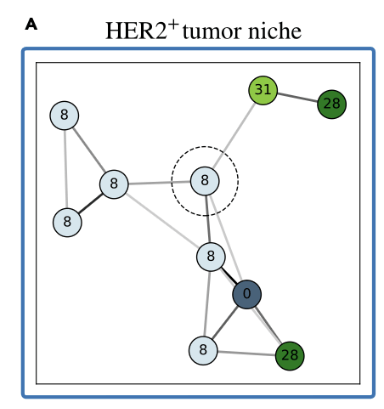
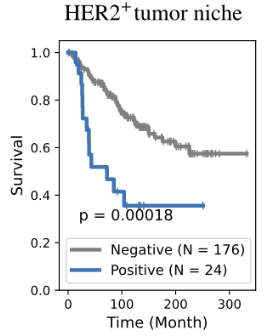
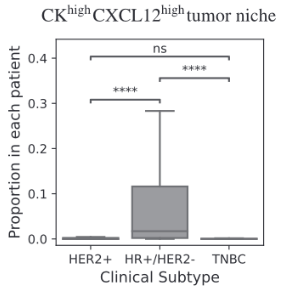
Tumor niche
Immune niche
Stromal niche
Interface niche
Bi-level Graphs: BiGraph
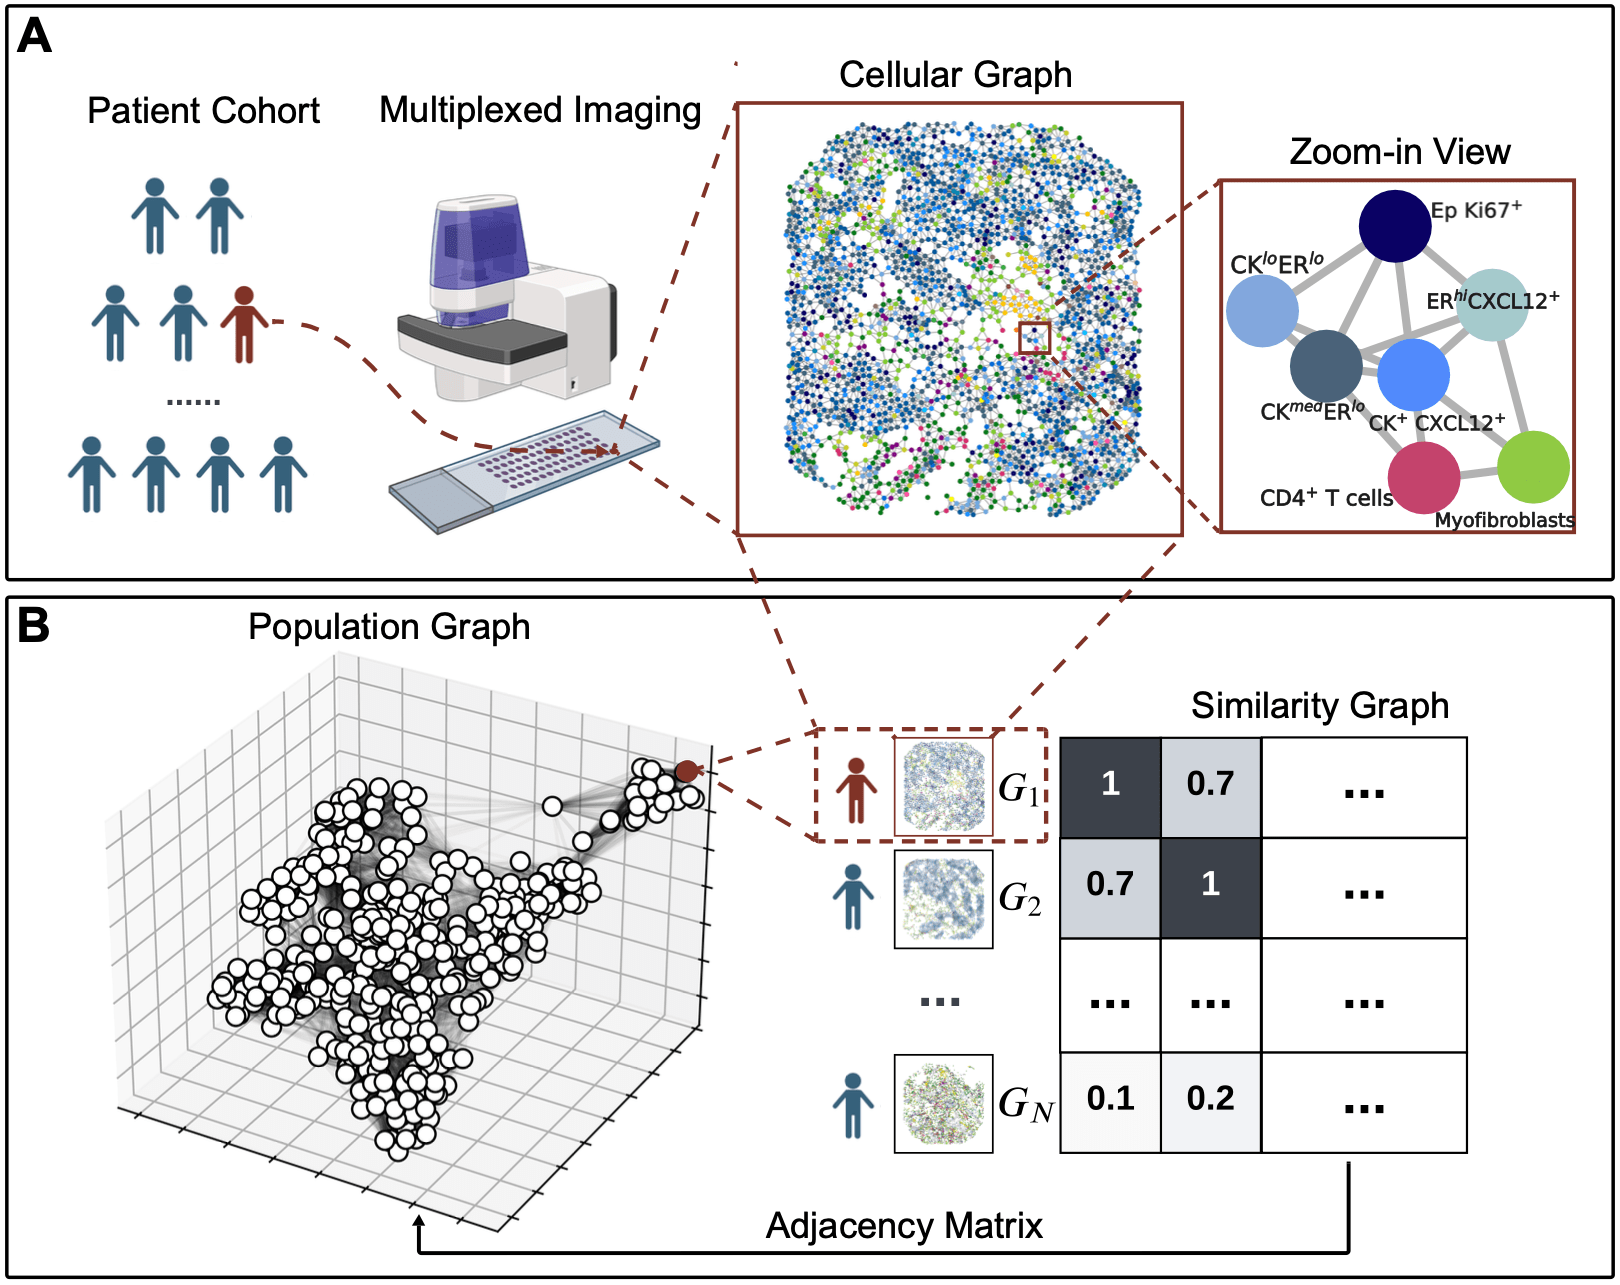
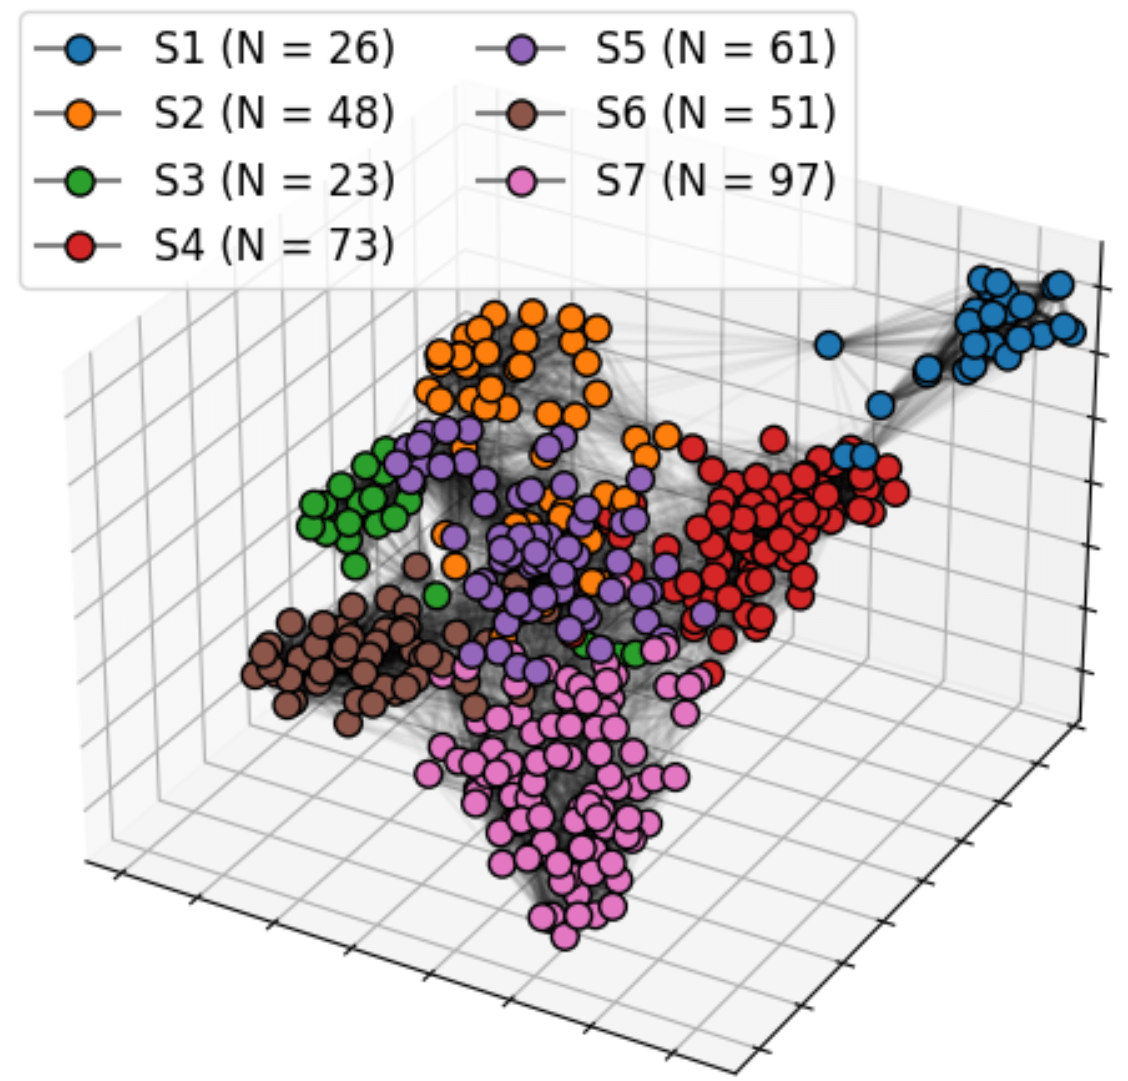
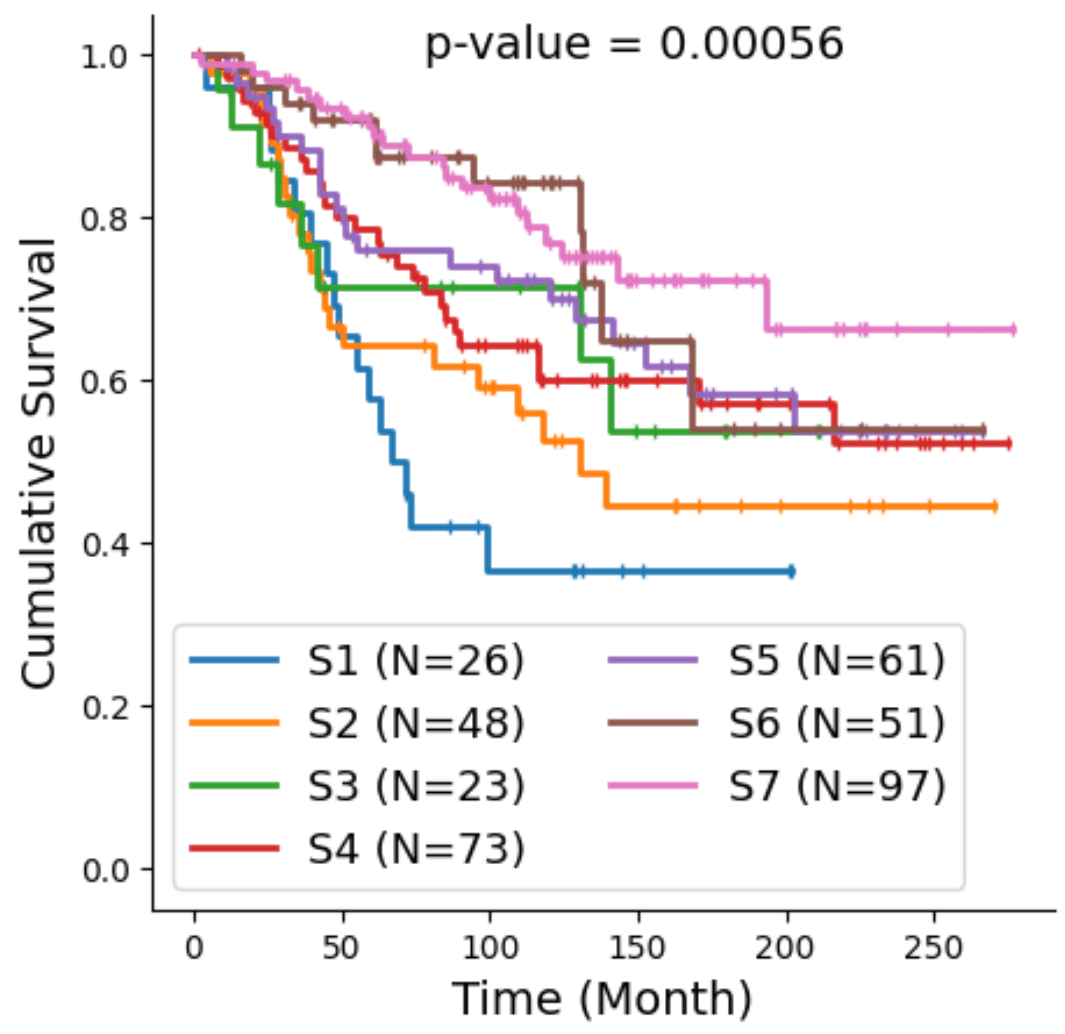
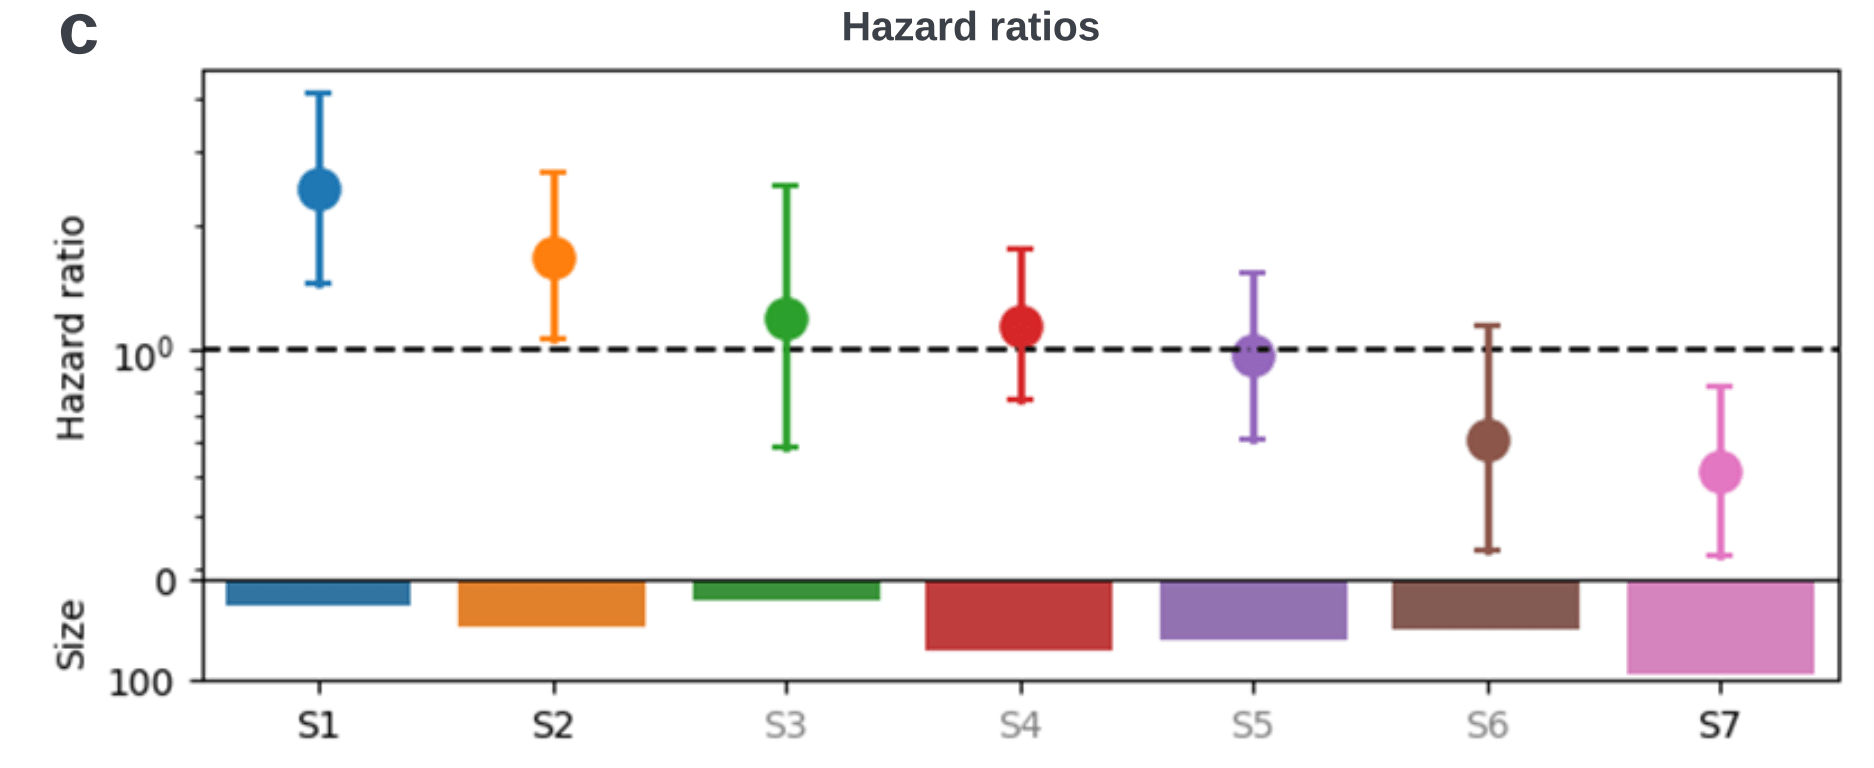
Bi-level Graphs: BiGraph
Community detection via
Louvain algorithm [Biondel et al, 2008]
(validation)
Bi-level Graphs: BiGraph
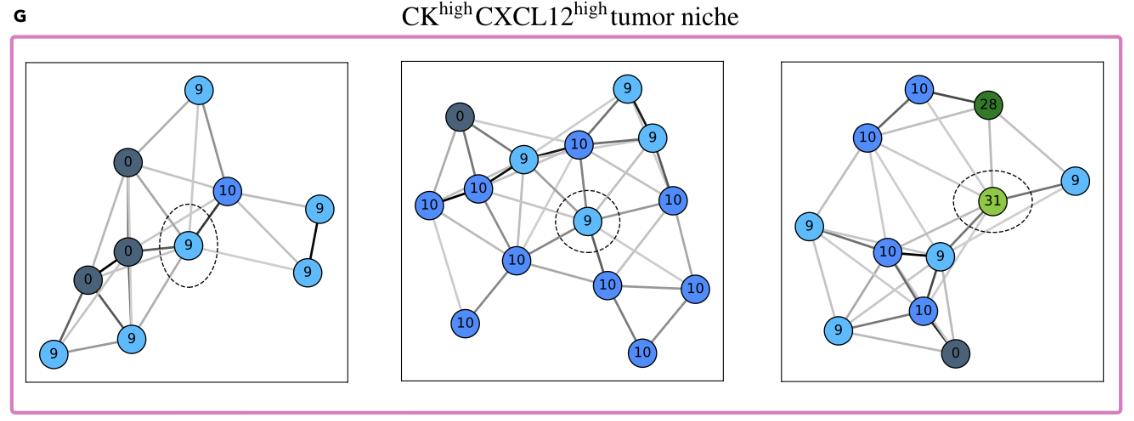
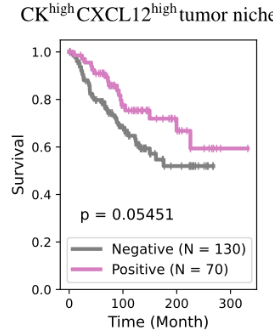
(cytokeratins + chemokine)
(validation)
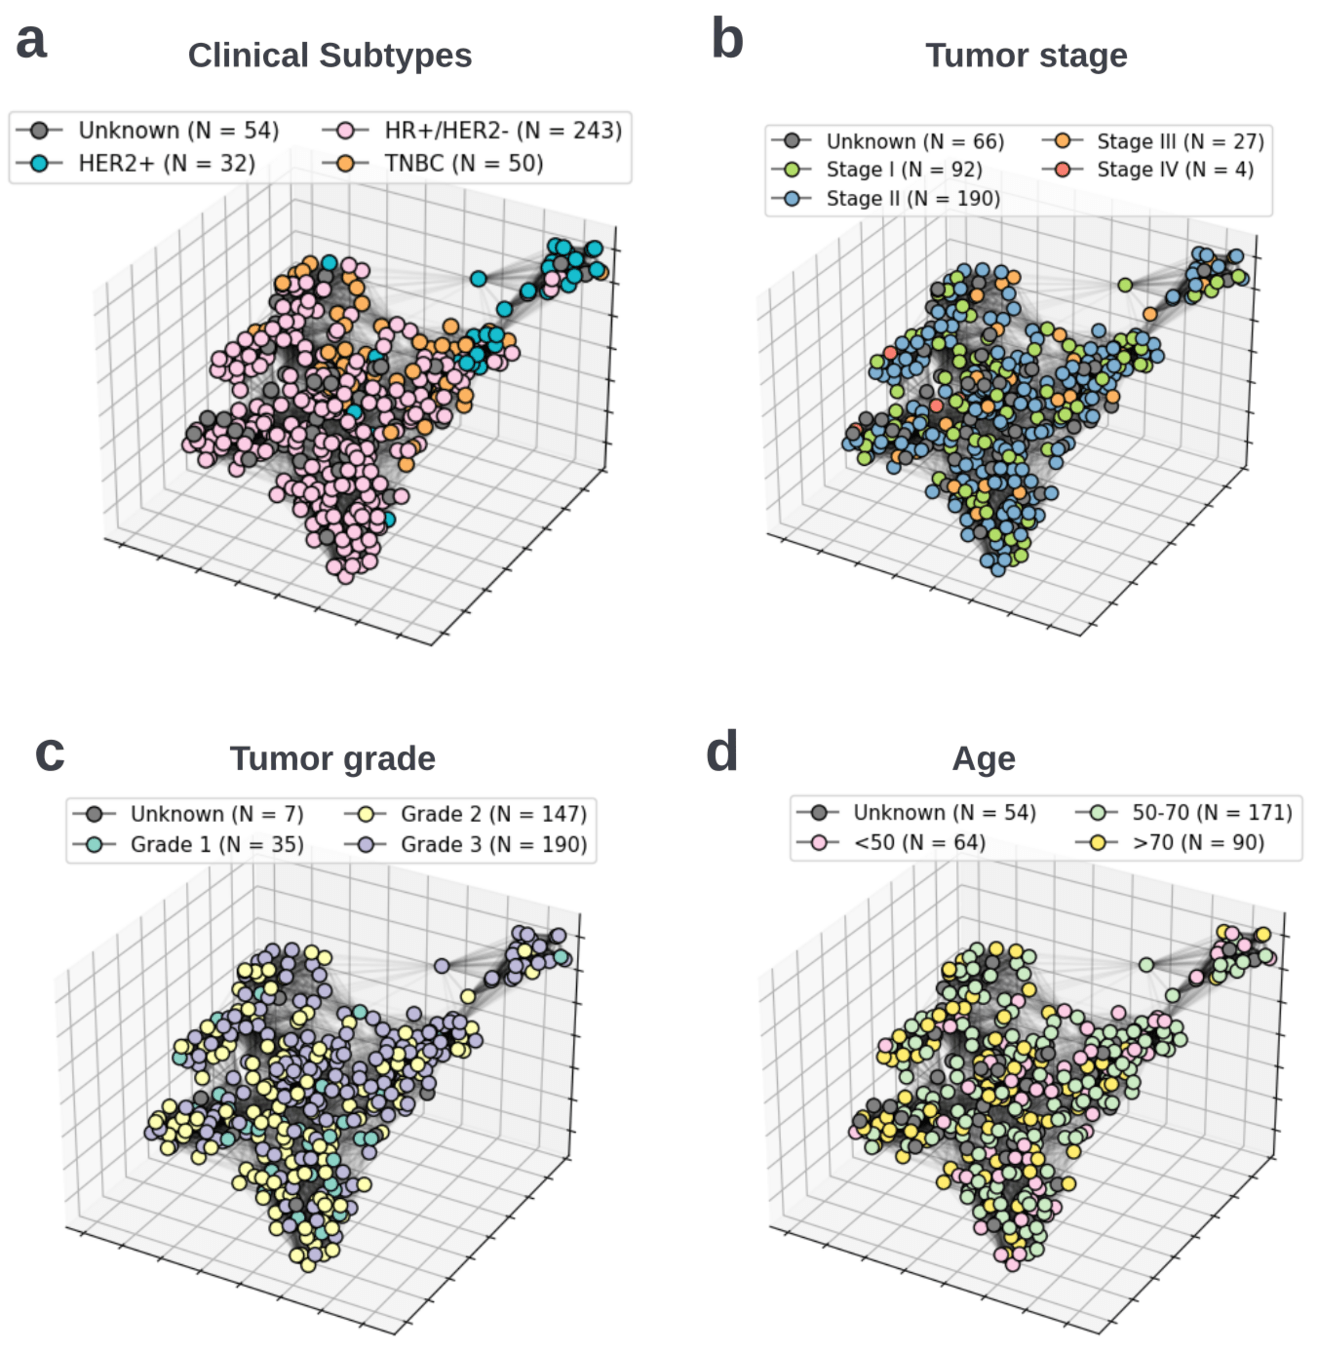
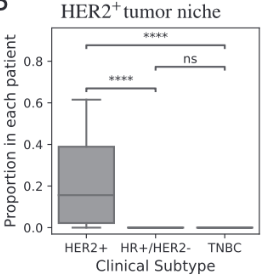
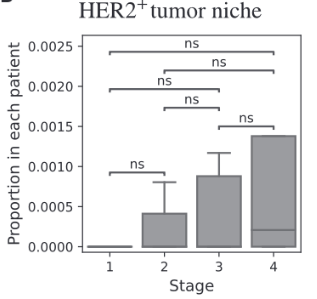
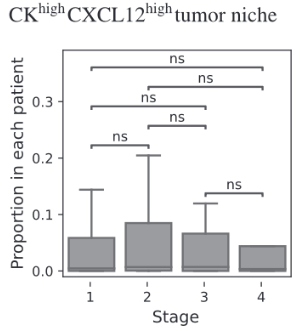
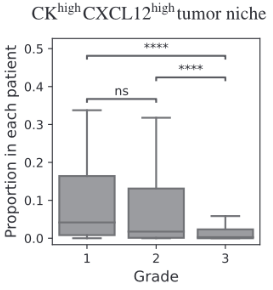
BiGraph provides complementary information to standard clinical characteristics


Tumor Stage
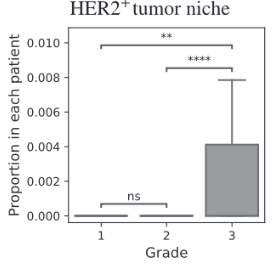
Tumor Grade
Tumor Subtype
BiGraph provides complementary information to standard clinical characteristics
BiGraph provides complementary information to standard clinical characteristics
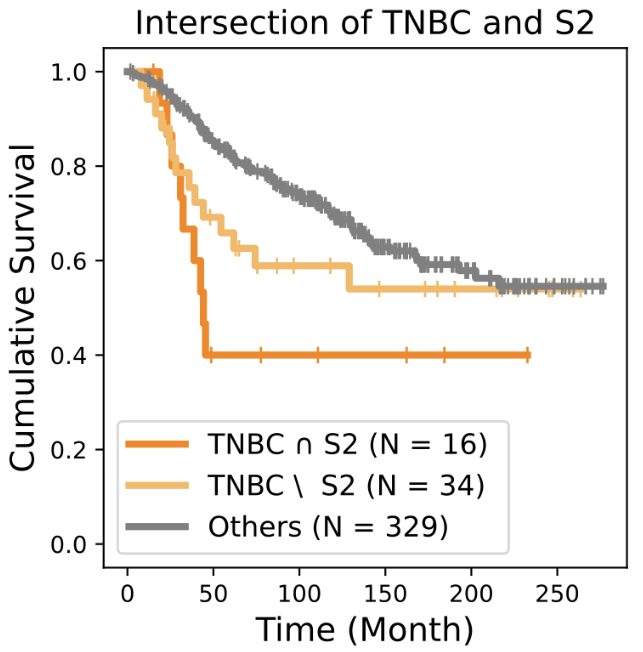
Biomarkers for TNBC
Biomarkers for TNBC

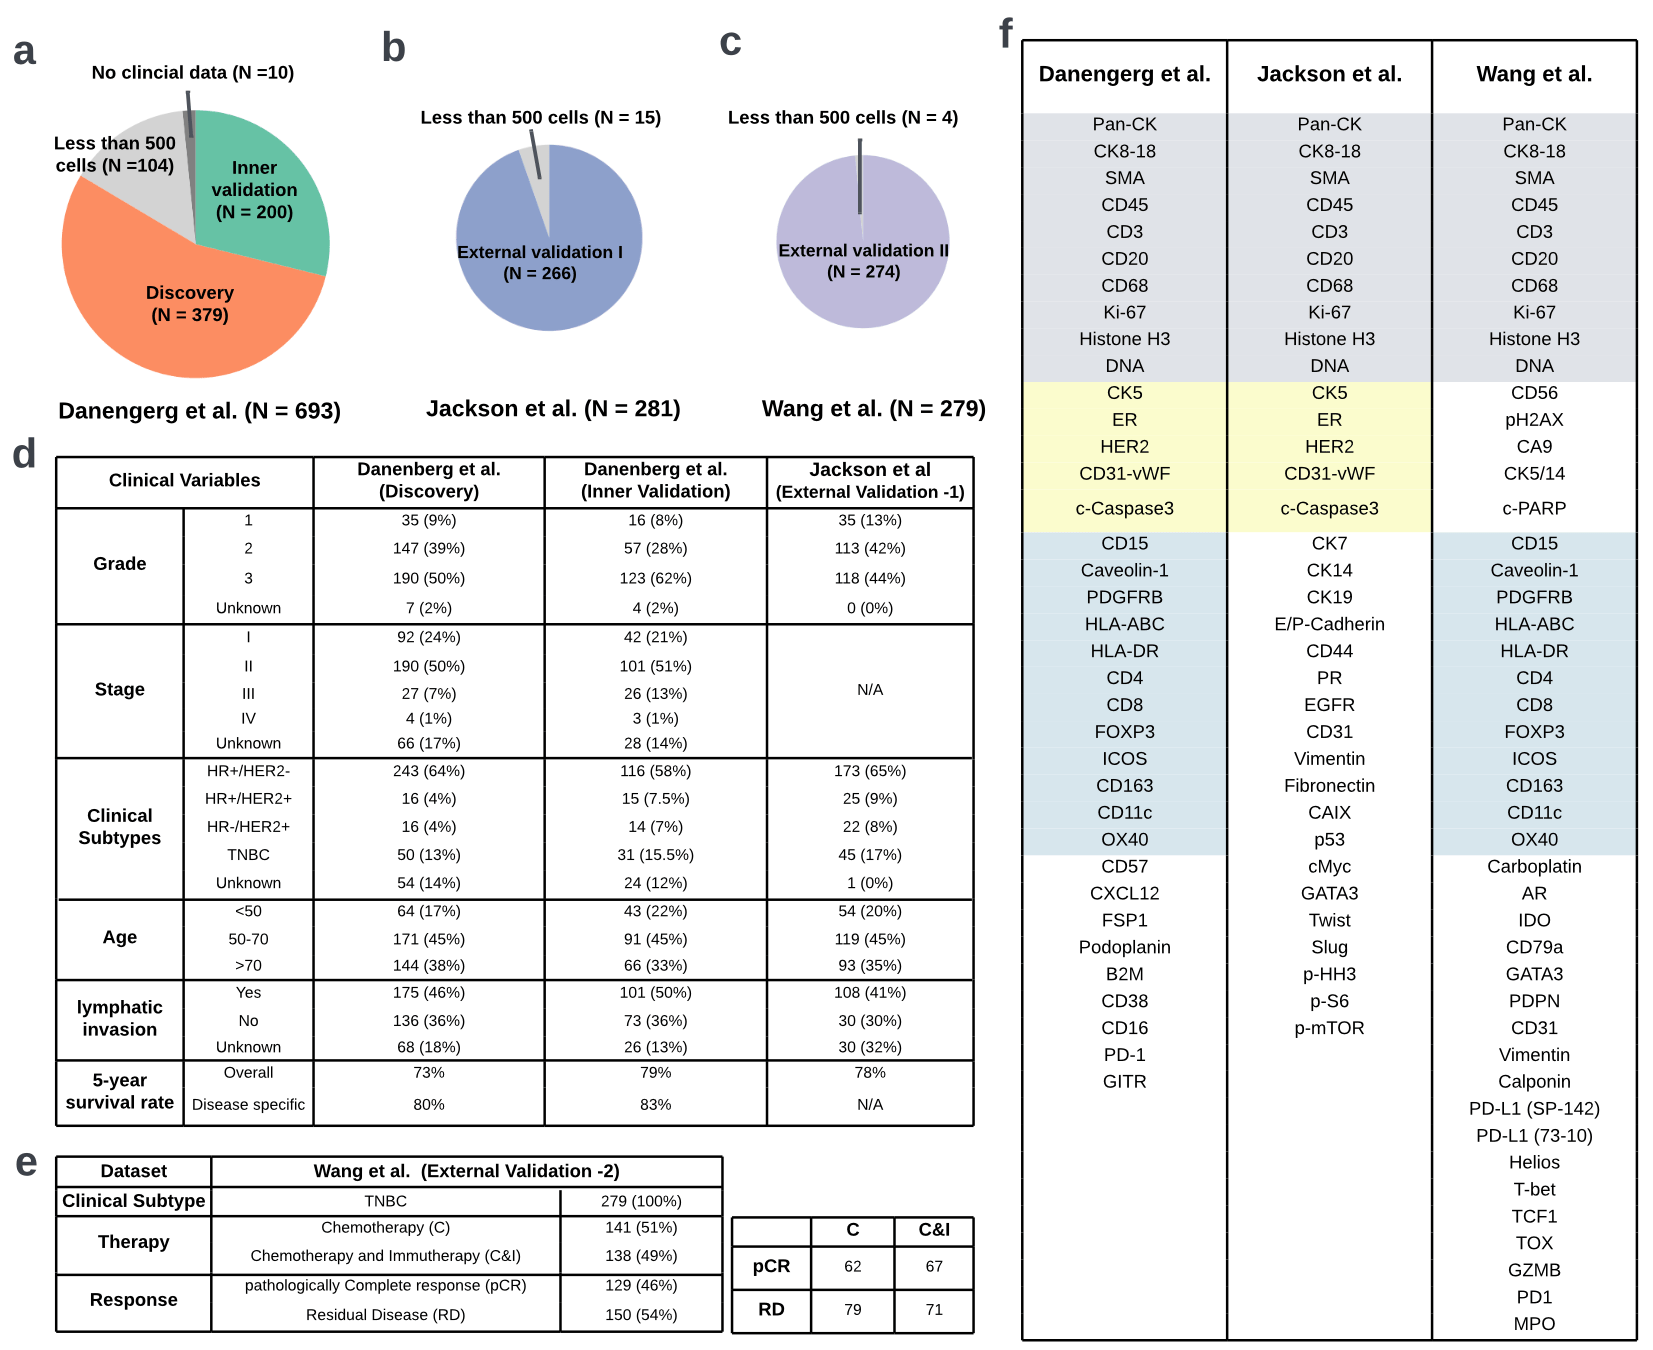
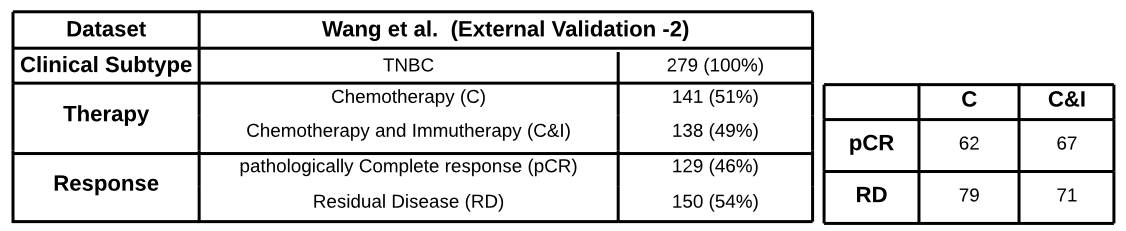
- 279 early triple-negative breast cancer (TNBC) patients in a randomized pre-surgical neoadjuvant immunotherapy clinical trial (ICB)
-
pathology Complete Response (pCR) vs
residual disease (RD)
all subtypes
TNBC
Biomarkers for TNBC
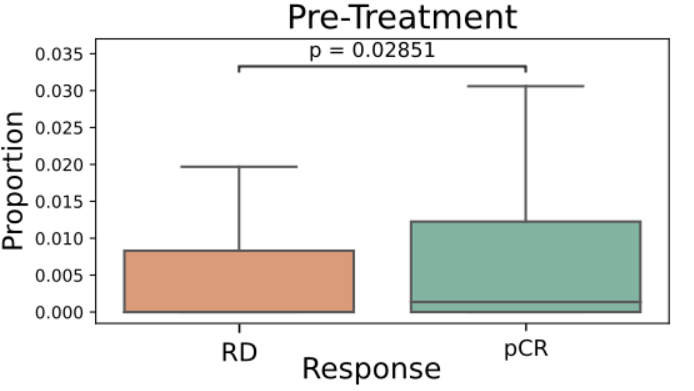
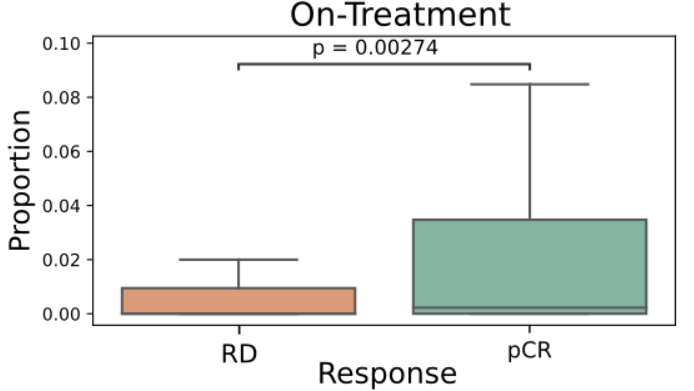
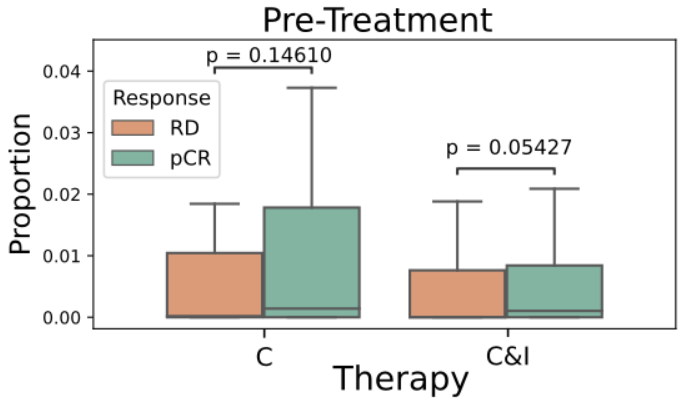
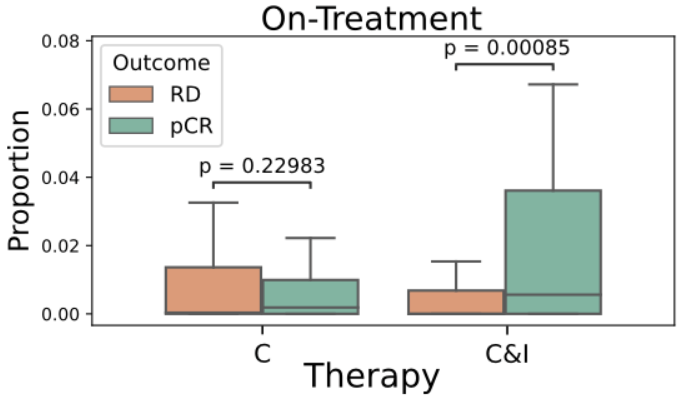
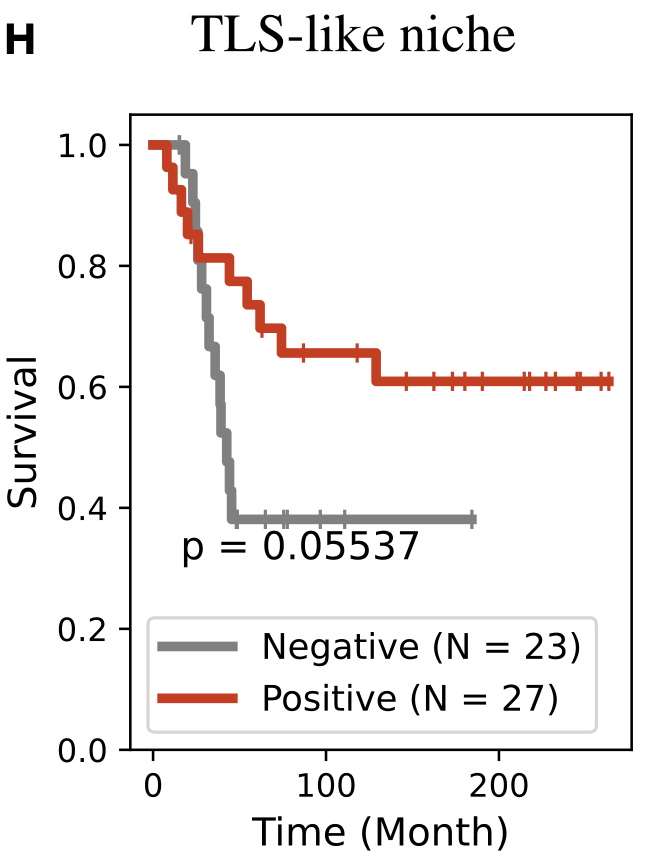
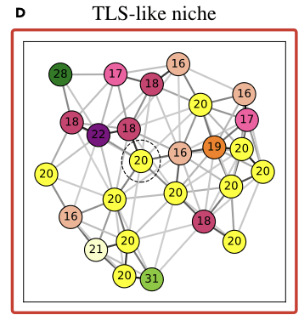
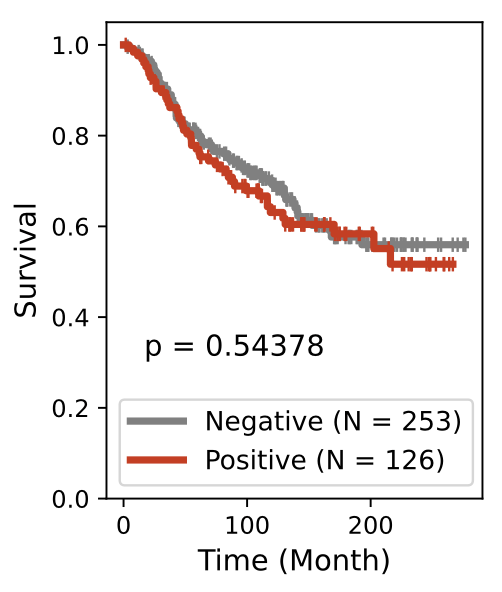
- TLS are known to promote local immune responses and are generally associated with favorable prognosis in immunologically “hot” tumors.
-
Prior studies have shown mixed results in breast cancer overall, but more consistent positive associations in TNBC.
all subtypes
TNBC
proportion of
TLS-like niche
proportion of
TLS-like niche
proportion of
TLS-like niche
proportion of
TLS-like niche
[Z Wang et al, Bi-level Graph Learning Unveils Prognosis-Relevant Tumor Microenvironment Patterns from Breast Multiplexed Digital Pathology, Patterns: Cell Press 2025]Concluding Remarks


Zhenzhen Wang
BME
Carlos A. Santa-Maria
Oncology
Aleksander Popel
BME


Jacopo Teneggi
CS

Paul Yi
St Jude Radiology


- General, opaque interpretability ML can be useful in high SNR settings, especially for speeding up annotation
- True biomarker discovery, in low SNR settings, like requires interpretable-by-construction methods
Thank you for inviting me


How can we learn descriptive local patterns for different phenotypes?
How can we learn descriptive local patterns for different phenotypes?
How can we learn descriptive local patterns for different phenotypes?
Phenotype APhenotype BHow can we learn descriptive local patterns for different phenotypes?
A background story
Dr. Jeremias Sulam
Johns Hopkins

PATTERNS-D-24-00095

Dear Dr. Sulam,
Thank you for submitting your paper to Patterns. I am enclosing the comments that the reviewers have made on your paper. In this case, we receive input from three expert reviewers. As you will see, the feedback are mixed. Reviewer#1 was unfortunately clearly negative about the paper and felt that it would not be well suited to the journal.

Reviewer#1 acknowledged the topic, but raised a series of technical and interpretable issues including the lack of comparison with other SOTA methods and the detailed clinical interpretation of several results. While Reviewers #2 and #3 were more positive,....
[..]
Best wishes,

Wanying Wang
Scientific Editor, Patterns
Reviewer #1: The paper introduces BiGraph, an unsupervised bi-level graph learning method designed to identify prognosis-relevant TME patterns from single-cell imaging data. BiGraph constructs both cellular graphs, representing the TME of individual patients, and population graphs, representing inter-patient similarities based on their TME patterns. By employing a novel relaxation of the Weisfeiler-Lehman subtree kernel, the method generates and analyzes TME patterns, facilitating robust risk stratification and uncovering prognostic biomarkers in breast cancer. However, there are some concerns which are mentioned below:

1. Could you explain how the BiGraph approach integrates cellular and population graphs to capture multi-scale information about the tumor microenvironment (TME)? How does this differ from conventional methods of patient stratification? Can you elaborate on how the Hodges-Lehmann statistic is used to identify characteristic TME patterns within patient subgroups?
2. What specific characteristics of the cellular graph and population graph are utilized in the BiGraph method to identify prognosis-relevant patterns in breast cancer patients?
3. How does the Soft-WL subtree kernel contribute to measuring the similarity between patients based on their TME patterns? Can you explain the process of generating and clustering TME patterns using this kernel?
4. In the analysis of the cellular graphs, what insights were gained from the clustering of subtrees into TME patterns? How did these patterns contribute to understanding the heterogeneity of the TME across patients?
5. Can you elaborate on how the Soft-WL subtree kernel quantifies inter-patient similarity based on the abundance of TME patterns? How is this similarity score calculated and interpreted? The process of combining multiple TMA cores into a single graph could be elaborated further.
6. How does the BiGraph-derived subtyping system compare with the standard clinical subtyping system for breast cancer? What are the main differences in their ability to capture inter-patient heterogeneity and predict survival outcomes?
7. How are the prognostic impacts of characteristic TME patterns correlated with clinical factors such as tumor grade, stage, and metastasis? Can you provide insights into the association between these patterns and tumor grade based on the validation results?
8. Can you explain the validation process used to assess the reproducibility and generalization of the BiGraph approach? How are patient risk stratification and the prognostic quality of TME patterns validated in both inner and external validation sets?
9. Based on the comparison with alternative methods, what insights can be drawn regarding the superiority of the Soft-WL subtree kernel approach in capturing patient subgroups with distinct survival outcomes and identifying prognosis-relevant TME patterns?
10. The methods described, particularly the generation and analysis of weighted cellular graphs and the Soft-WL subtree kernel, are computationally intensive. The paper could benefit from a discussion on computational efficiency and scalability, especially for large datasets.
11. The performance of the proposed methods is likely sensitive to several hyperparameters (e.g., α in the Gaussian kernel, h in the subtree generation, and τ in neighborhood boundary determination). While some parameter choices are justified, a more extensive discussion or empirical analysis of parameter sensitivity would strengthen the paper.
12. While the methodology is well-explained, the paper would benefit from more extensive validation. Comparisons with other state-of-the-art methods using benchmark datasets could highlight the advantages and potential limitations of the proposed approach.
13. A pseudocode will be helpful to understand the overall workflow of the paper.
14. Discuss the potential generalizability of the methods to other data types and possible adaptations required.
Dr. Jeremias Sulam
Johns Hopkins
PATTERNS-D-24-00095
Dear Dr. Sulam,
Thank you for submitting your paper to Patterns. I am enclosing the comments that the reviewers have made on your paper. In this case, we receive input from three expert reviewers. As you will see, the feedback are mixed. Reviewer#1 was unfortunately clearly negative about the paper and felt that it would not be well suited to the journal.
Reviewer#1 acknowledged the topic, but raised a series of technical and interpretable issues including the lack of comparison with other SOTA methods and the detailed clinical interpretation of several results. While Reviewers #2 and #3 were more positive,....
[..]
Best wishes,
Wanying Wang
Scientific Editor, PatternsA background story
Reviewer #1: The paper introduces BiGraph, an unsupervised bi-level graph learning method designed to identify prognosis-relevant TME patterns from single-cell imaging data. BiGraph constructs both cellular graphs, representing the TME of individual patients, and population graphs, representing inter-patient similarities based on their TME patterns. By employing a novel relaxation of the Weisfeiler-Lehman subtree kernel, the method generates and analyzes TME patterns, facilitating robust risk stratification and uncovering prognostic biomarkers in breast cancer. However, there are some concerns which are mentioned below:
1. Could you explain how the BiGraph approach integrates cellular and population graphs to capture multi-scale information about the tumor microenvironment (TME)? How does this differ from conventional methods of patient stratification? Can you elaborate on how the Hodges-Lehmann statistic is used to identify characteristic TME patterns within patient subgroups?
2. What specific characteristics of the cellular graph and population graph are utilized in the BiGraph method to identify prognosis-relevant patterns in breast cancer patients?
3. How does the Soft-WL subtree kernel contribute to measuring the similarity between patients based on their TME patterns? Can you explain the process of generating and clustering TME patterns using this kernel?
4. In the analysis of the cellular graphs, what insights were gained from the clustering of subtrees into TME patterns? How did these patterns contribute to understanding the heterogeneity of the TME across patients?
5. Can you elaborate on how the Soft-WL subtree kernel quantifies inter-patient similarity based on the abundance of TME patterns? How is this similarity score calculated and interpreted? The process of combining multiple TMA cores into a single graph could be elaborated further.
6. How does the BiGraph-derived subtyping system compare with the standard clinical subtyping system for breast cancer? What are the main differences in their ability to capture inter-patient heterogeneity and predict survival outcomes?
7. How are the prognostic impacts of characteristic TME patterns correlated with clinical factors such as tumor grade, stage, and metastasis? Can you provide insights into the association between these patterns and tumor grade based on the validation results?
8. Can you explain the validation process used to assess the reproducibility and generalization of the BiGraph approach? How are patient risk stratification and the prognostic quality of TME patterns validated in both inner and external validation sets?
9. Based on the comparison with alternative methods, what insights can be drawn regarding the superiority of the Soft-WL subtree kernel approach in capturing patient subgroups with distinct survival outcomes and identifying prognosis-relevant TME patterns?
10. The methods described, particularly the generation and analysis of weighted cellular graphs and the Soft-WL subtree kernel, are computationally intensive. The paper could benefit from a discussion on computational efficiency and scalability, especially for large datasets.
11. The performance of the proposed methods is likely sensitive to several hyperparameters (e.g., α in the Gaussian kernel, h in the subtree generation, and τ in neighborhood boundary determination). While some parameter choices are justified, a more extensive discussion or empirical analysis of parameter sensitivity would strengthen the paper.
12. While the methodology is well-explained, the paper would benefit from more extensive validation. Comparisons with other state-of-the-art methods using benchmark datasets could highlight the advantages and potential limitations of the proposed approach.
13. A pseudocode will be helpful to understand the overall workflow of the paper.
14. Discuss the potential generalizability of the methods to other data types and possible adaptations required.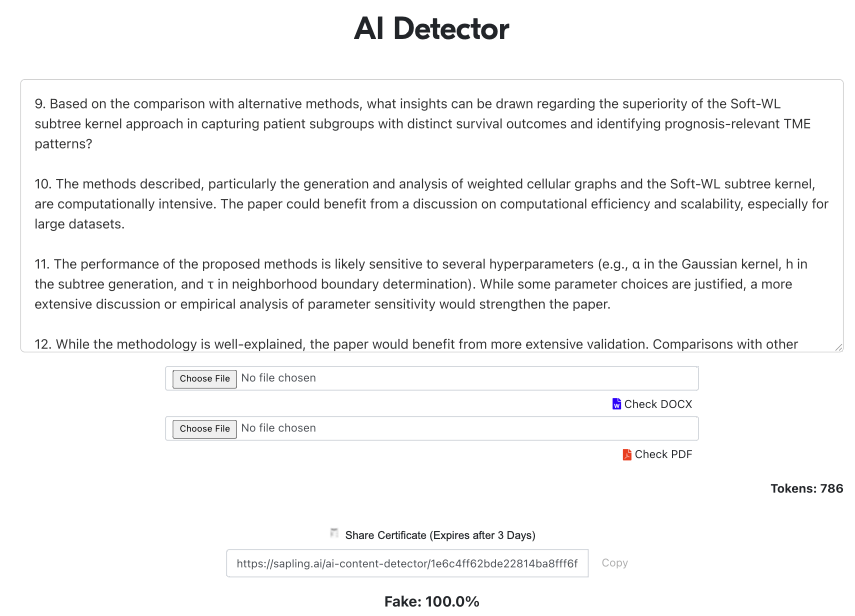
Dr. Jeremias Sulam
Johns Hopkins

PATTERNS-D-24-00095

Dear Dr. Sulam,
Thank you for submitting your paper to Patterns. I am enclosing the comments that the reviewers have made on your paper. In this case, we receive input from three expert reviewers. As you will see, the feedback are mixed. Reviewer#1 was unfortunately clearly negative about the paper and felt that it would not be well suited to the journal.

Reviewer#1 acknowledged the topic, but raised a series of technical and interpretable issues including the lack of comparison with other SOTA methods and the detailed clinical interpretation of several results. While Reviewers #2 and #3 were more positive,....
[..]
Best wishes,

Wanying Wang
Scientific Editor, Patterns
A background story
Reviewer #1: The paper introduces BiGraph, an unsupervised bi-level graph learning method designed to identify prognosis-relevant TME patterns from single-cell imaging data. BiGraph constructs both cellular graphs, representing the TME of individual patients, and population graphs, representing inter-patient similarities based on their TME patterns. By employing a novel relaxation of the Weisfeiler-Lehman subtree kernel, the method generates and analyzes TME patterns, facilitating robust risk stratification and uncovering prognostic biomarkers in breast cancer. However, there are some concerns which are mentioned below:

1. Could you explain how the BiGraph approach integrates cellular and population graphs to capture multi-scale information about the tumor microenvironment (TME)? How does this differ from conventional methods of patient stratification? Can you elaborate on how the Hodges-Lehmann statistic is used to identify characteristic TME patterns within patient subgroups?
2. What specific characteristics of the cellular graph and population graph are utilized in the BiGraph method to identify prognosis-relevant patterns in breast cancer patients?
3. How does the Soft-WL subtree kernel contribute to measuring the similarity between patients based on their TME patterns? Can you explain the process of generating and clustering TME patterns using this kernel?
4. In the analysis of the cellular graphs, what insights were gained from the clustering of subtrees into TME patterns? How did these patterns contribute to understanding the heterogeneity of the TME across patients?
5. Can you elaborate on how the Soft-WL subtree kernel quantifies inter-patient similarity based on the abundance of TME patterns? How is this similarity score calculated and interpreted? The process of combining multiple TMA cores into a single graph could be elaborated further.
6. How does the BiGraph-derived subtyping system compare with the standard clinical subtyping system for breast cancer? What are the main differences in their ability to capture inter-patient heterogeneity and predict survival outcomes?
7. How are the prognostic impacts of characteristic TME patterns correlated with clinical factors such as tumor grade, stage, and metastasis? Can you provide insights into the association between these patterns and tumor grade based on the validation results?
8. Can you explain the validation process used to assess the reproducibility and generalization of the BiGraph approach? How are patient risk stratification and the prognostic quality of TME patterns validated in both inner and external validation sets?
9. Based on the comparison with alternative methods, what insights can be drawn regarding the superiority of the Soft-WL subtree kernel approach in capturing patient subgroups with distinct survival outcomes and identifying prognosis-relevant TME patterns?
10. The methods described, particularly the generation and analysis of weighted cellular graphs and the Soft-WL subtree kernel, are computationally intensive. The paper could benefit from a discussion on computational efficiency and scalability, especially for large datasets.
11. The performance of the proposed methods is likely sensitive to several hyperparameters (e.g., α in the Gaussian kernel, h in the subtree generation, and τ in neighborhood boundary determination). While some parameter choices are justified, a more extensive discussion or empirical analysis of parameter sensitivity would strengthen the paper.
12. While the methodology is well-explained, the paper would benefit from more extensive validation. Comparisons with other state-of-the-art methods using benchmark datasets could highlight the advantages and potential limitations of the proposed approach.
13. A pseudocode will be helpful to understand the overall workflow of the paper.
14. Discuss the potential generalizability of the methods to other data types and possible adaptations required.
Dr. Jeremias Sulam
Johns Hopkins
PATTERNS-D-24-00095
Dear Dr. Sulam,
Thank you for submitting your paper to Patterns. I am enclosing the comments that the reviewers have made on your paper. In this case, we receive input from three expert reviewers. As you will see, the feedback are mixed. Reviewer#1 was unfortunately clearly negative about the paper and felt that it would not be well suited to the journal.
Reviewer#1 acknowledged the topic, but raised a series of technical and interpretable issues including the lack of comparison with other SOTA methods and the detailed clinical interpretation of several results. While Reviewers #2 and #3 were more positive,....
[..]
Best wishes,
Wanying Wang
Scientific Editor, PatternsDear Dr Sulam,
Thanks for your continued interest in Patterns and your point-by-point response to reviewers’ comments.
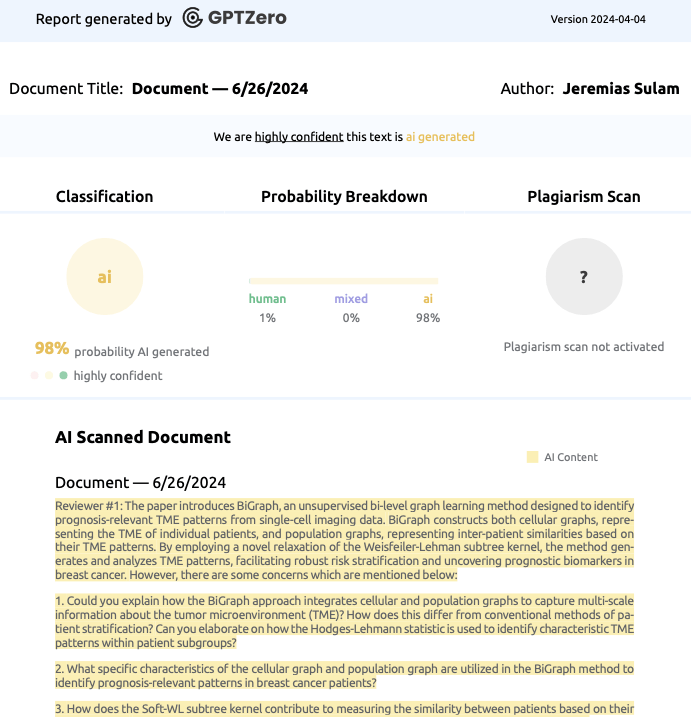
We also acknowledge your concerns regarding the report provided by Reviewer #1. Please understand that we do take accusations of this kind seriously. At the same time, please understand that we have substantial reason to believe that public AI-generated content detectors show significant false-positive rates, especially for content outside of the original training domain or for text written by non-native English speakers. For this reason, validating claims of this kind is inherently difficult.
We have contacted our internal ethics team and we are advised to investigate this matter further. We just received feedback from the reviewers for your manuscript. Reviewer#1 admitted that they used ChatGPT [...]
To avoid delay, we have decided to move forward with considering your point-by-point response on its merits.
Best wishes,
Wanying
Associate Scientific Editor, Patterns Cell Press, 125 London Wall, London, EC2Y 5AS, UK
A background story
Reviewer #1: The paper introduces BiGraph, an unsupervised bi-level graph learning method designed to identify prognosis-relevant TME patterns from single-cell imaging data. BiGraph constructs both cellular graphs, representing the TME of individual patients, and population graphs, representing inter-patient similarities based on their TME patterns. By employing a novel relaxation of the Weisfeiler-Lehman subtree kernel, the method generates and analyzes TME patterns, facilitating robust risk stratification and uncovering prognostic biomarkers in breast cancer. However, there are some concerns which are mentioned below:

1. Could you explain how the BiGraph approach integrates cellular and population graphs to capture multi-scale information about the tumor microenvironment (TME)? How does this differ from conventional methods of patient stratification? Can you elaborate on how the Hodges-Lehmann statistic is used to identify characteristic TME patterns within patient subgroups?
2. What specific characteristics of the cellular graph and population graph are utilized in the BiGraph method to identify prognosis-relevant patterns in breast cancer patients?
3. How does the Soft-WL subtree kernel contribute to measuring the similarity between patients based on their TME patterns? Can you explain the process of generating and clustering TME patterns using this kernel?
4. In the analysis of the cellular graphs, what insights were gained from the clustering of subtrees into TME patterns? How did these patterns contribute to understanding the heterogeneity of the TME across patients?
5. Can you elaborate on how the Soft-WL subtree kernel quantifies inter-patient similarity based on the abundance of TME patterns? How is this similarity score calculated and interpreted? The process of combining multiple TMA cores into a single graph could be elaborated further.
6. How does the BiGraph-derived subtyping system compare with the standard clinical subtyping system for breast cancer? What are the main differences in their ability to capture inter-patient heterogeneity and predict survival outcomes?
7. How are the prognostic impacts of characteristic TME patterns correlated with clinical factors such as tumor grade, stage, and metastasis? Can you provide insights into the association between these patterns and tumor grade based on the validation results?
8. Can you explain the validation process used to assess the reproducibility and generalization of the BiGraph approach? How are patient risk stratification and the prognostic quality of TME patterns validated in both inner and external validation sets?
9. Based on the comparison with alternative methods, what insights can be drawn regarding the superiority of the Soft-WL subtree kernel approach in capturing patient subgroups with distinct survival outcomes and identifying prognosis-relevant TME patterns?
10. The methods described, particularly the generation and analysis of weighted cellular graphs and the Soft-WL subtree kernel, are computationally intensive. The paper could benefit from a discussion on computational efficiency and scalability, especially for large datasets.
11. The performance of the proposed methods is likely sensitive to several hyperparameters (e.g., α in the Gaussian kernel, h in the subtree generation, and τ in neighborhood boundary determination). While some parameter choices are justified, a more extensive discussion or empirical analysis of parameter sensitivity would strengthen the paper.
12. While the methodology is well-explained, the paper would benefit from more extensive validation. Comparisons with other state-of-the-art methods using benchmark datasets could highlight the advantages and potential limitations of the proposed approach.
13. A pseudocode will be helpful to understand the overall workflow of the paper.
14. Discuss the potential generalizability of the methods to other data types and possible adaptations required.
Dr. Jeremias Sulam
Johns Hopkins
PATTERNS-D-24-00095
Dear Dr. Sulam,
Thank you for submitting your paper to Patterns. I am enclosing the comments that the reviewers have made on your paper. In this case, we receive input from three expert reviewers. As you will see, the feedback are mixed. Reviewer#1 was unfortunately clearly negative about the paper and felt that it would not be well suited to the journal.
Reviewer#1 acknowledged the topic, but raised a series of technical and interpretable issues including the lack of comparison with other SOTA methods and the detailed clinical interpretation of several results. While Reviewers #2 and #3 were more positive,....
[..]
Best wishes,
Wanying Wang
Scientific Editor, PatternsA background story
Dear Dr Sulam,
Thanks for your continued interest in Patterns and your point-by-point response to reviewers’ comments.
We also acknowledge your concerns regarding the report provided by Reviewer #1. Please understand that we do take accusations of this kind seriously. At the same time, please understand that we have substantial reason to believe that public AI-generated content detectors show significant false-positive rates, especially for content outside of the original training domain or for text written by non-native English speakers. For this reason, validating claims of this kind is inherently difficult.
We have contacted our internal ethics team and we are advised to investigate this matter further. We just received feedback from the reviewers for your manuscript. Reviewer#1 admitted that they used ChatGPT [...]
To avoid delay, we have decided to move forward with considering your point-by-point response on its merits.
Best wishes,
Wanying

Associate Scientific Editor, Patterns Cell Press, 125 London Wall, London, EC2Y 5AS, UK