Towards a Dynamic View of UK Depriation: Harmonising the IMD Indices using Claimant Count Data


- Small-area deprivation measures have been a key feature of UK policymaking since at least the 1960s
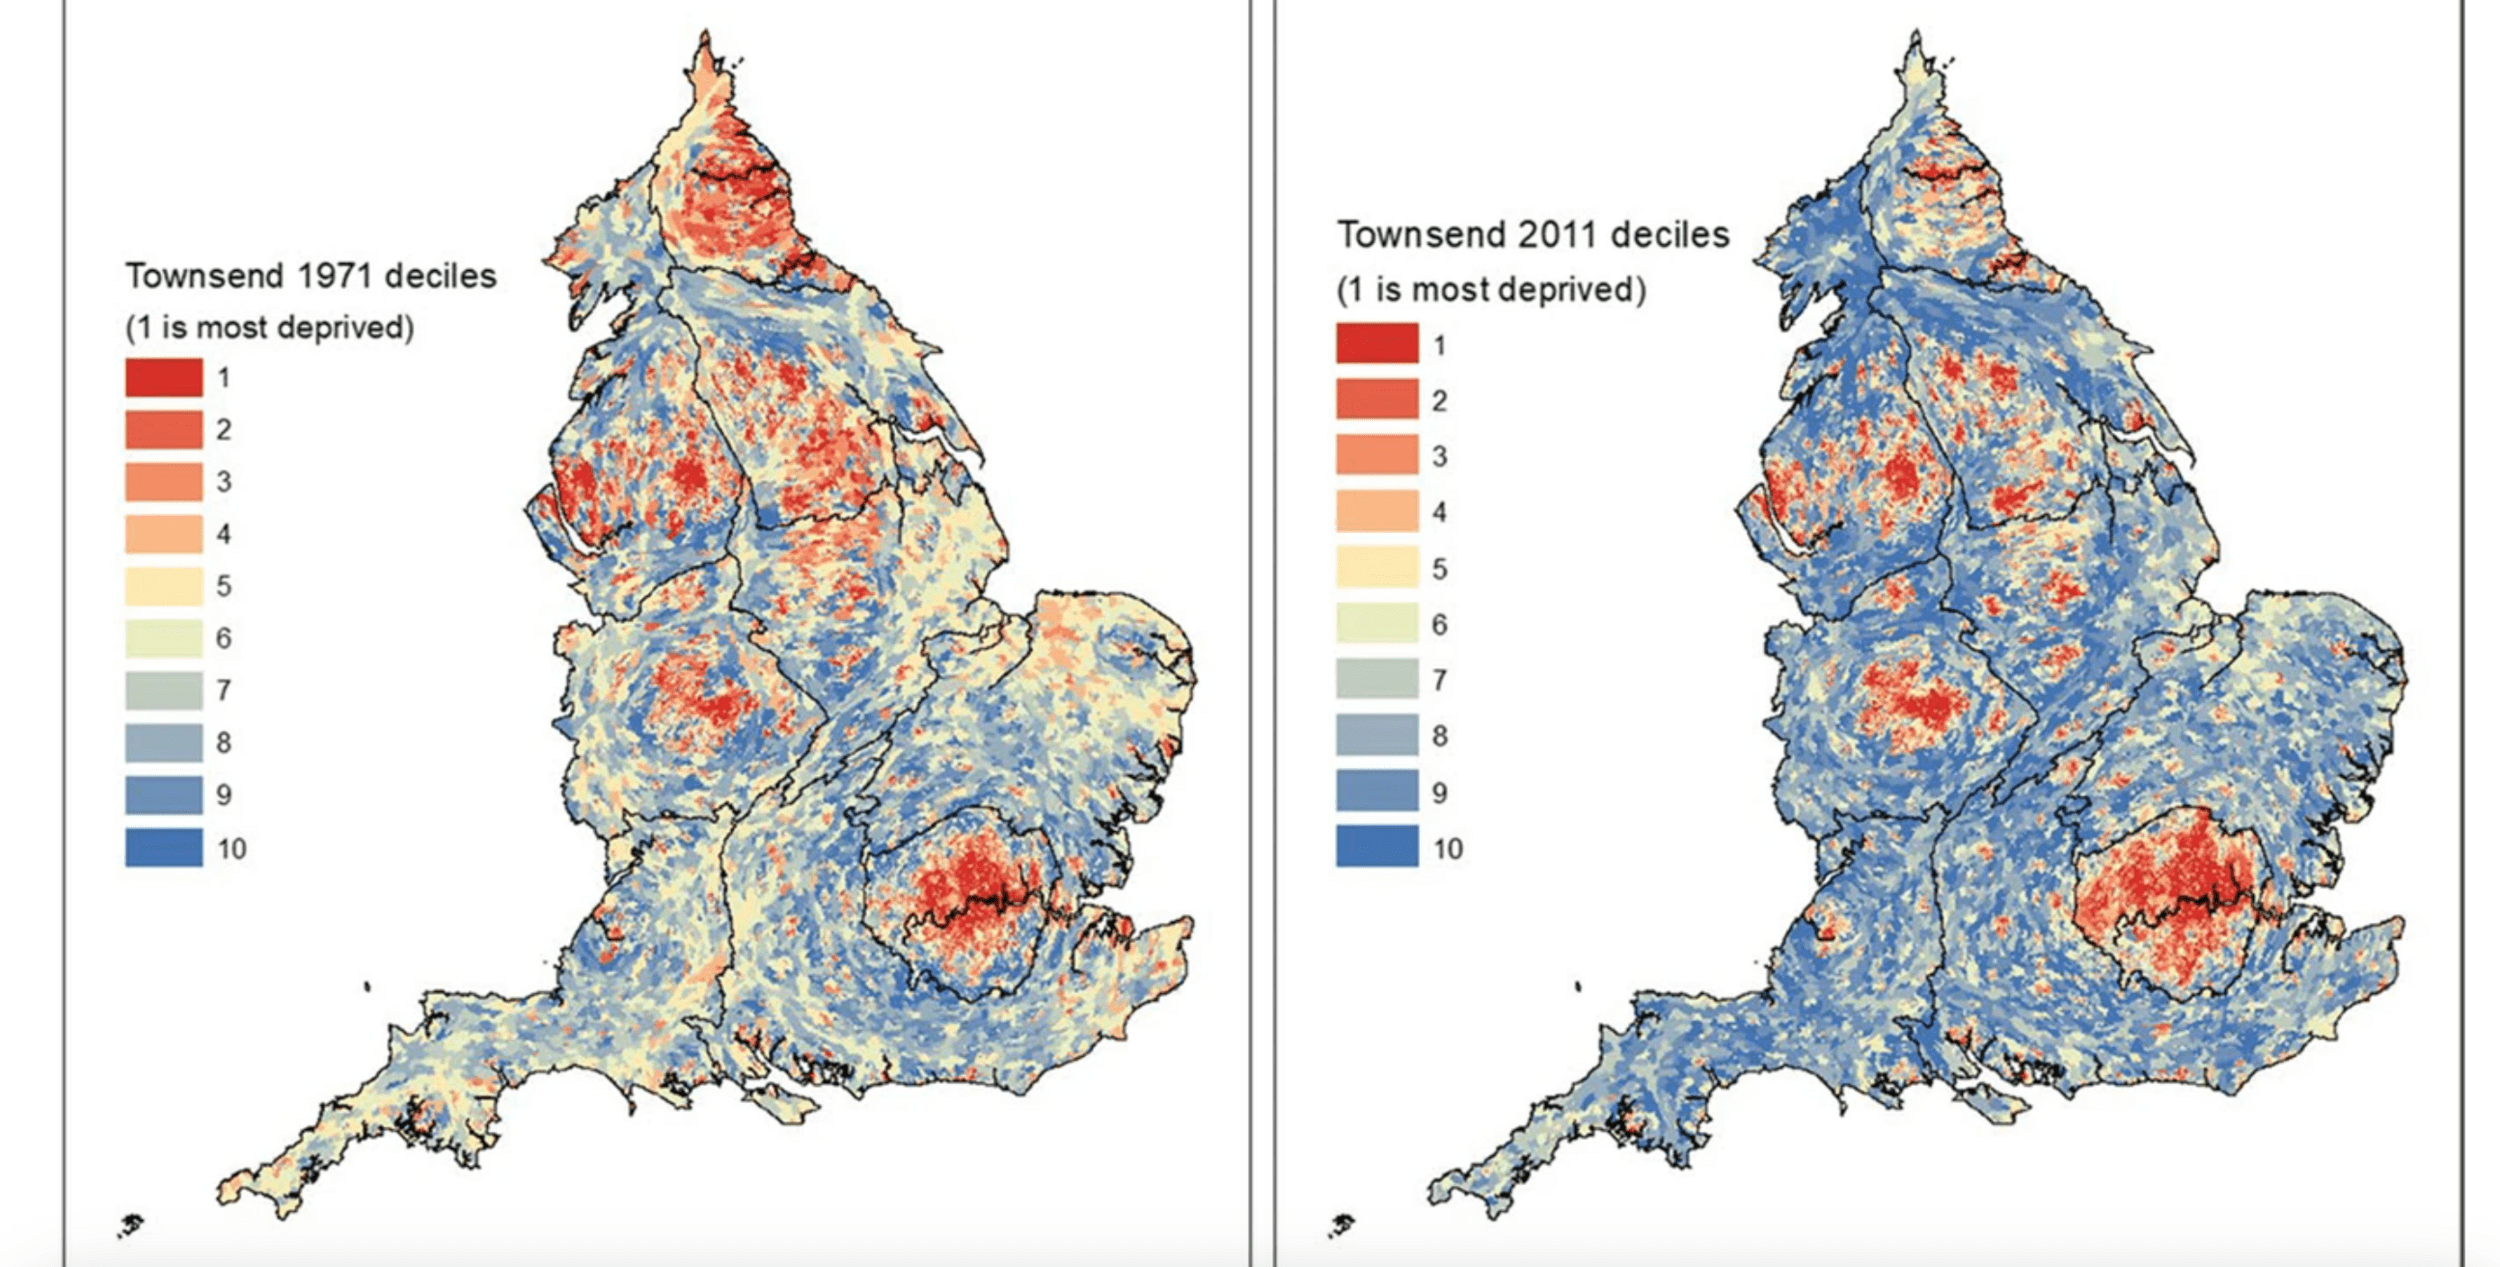
- Historically, national indexes of 'multiple deprivation' were based on annual census data
- Early examples include the Carstairs and Morris index (Scotland) and the Townsend index (England)
- Since 2001, the Index of Multiple Deprivation has been the UK government's official statistic of deprivation
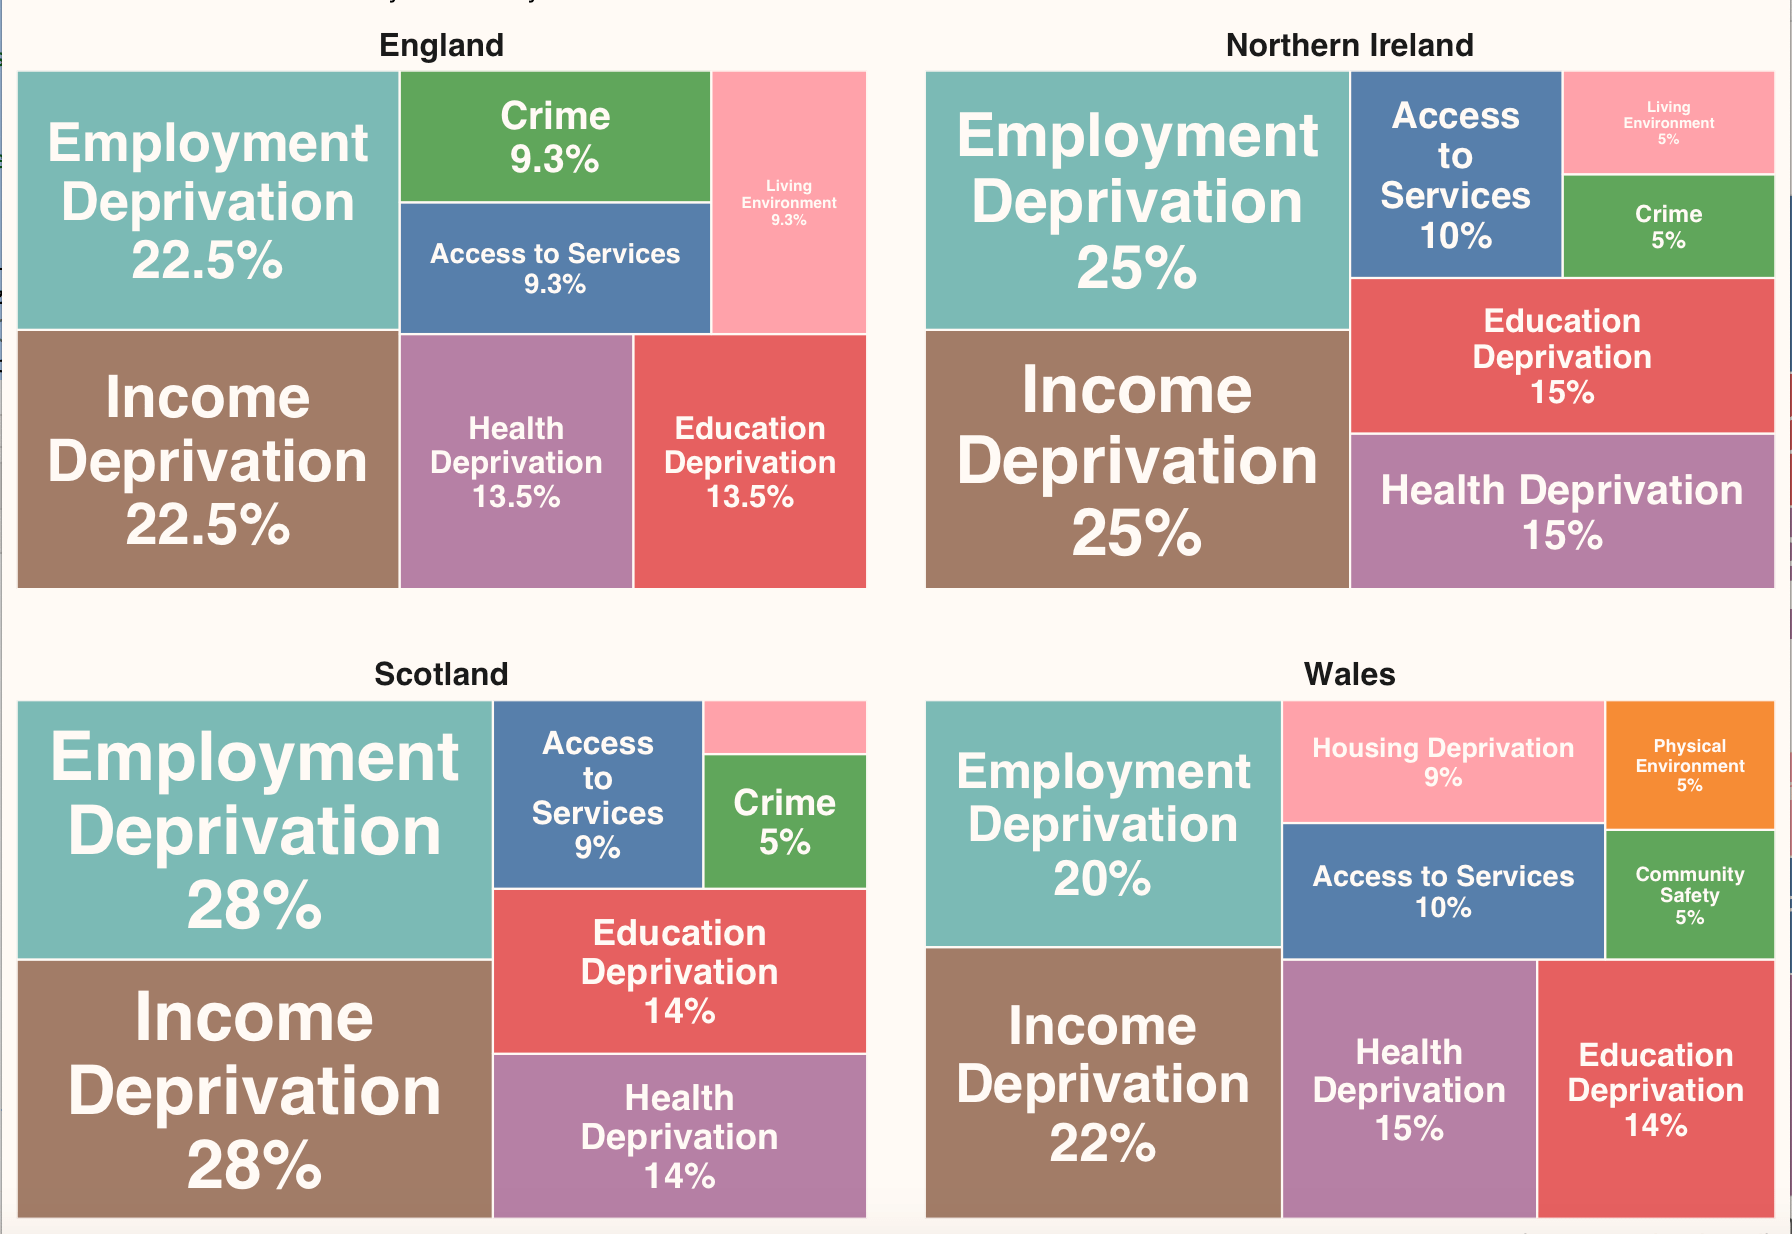
- IMD considers deprivation across multiple dimensions or ‘domains’ such as employment, health, and education
- Domain scores are combined to calculate overall index scores, ranked, and divided into deciles
Introduction
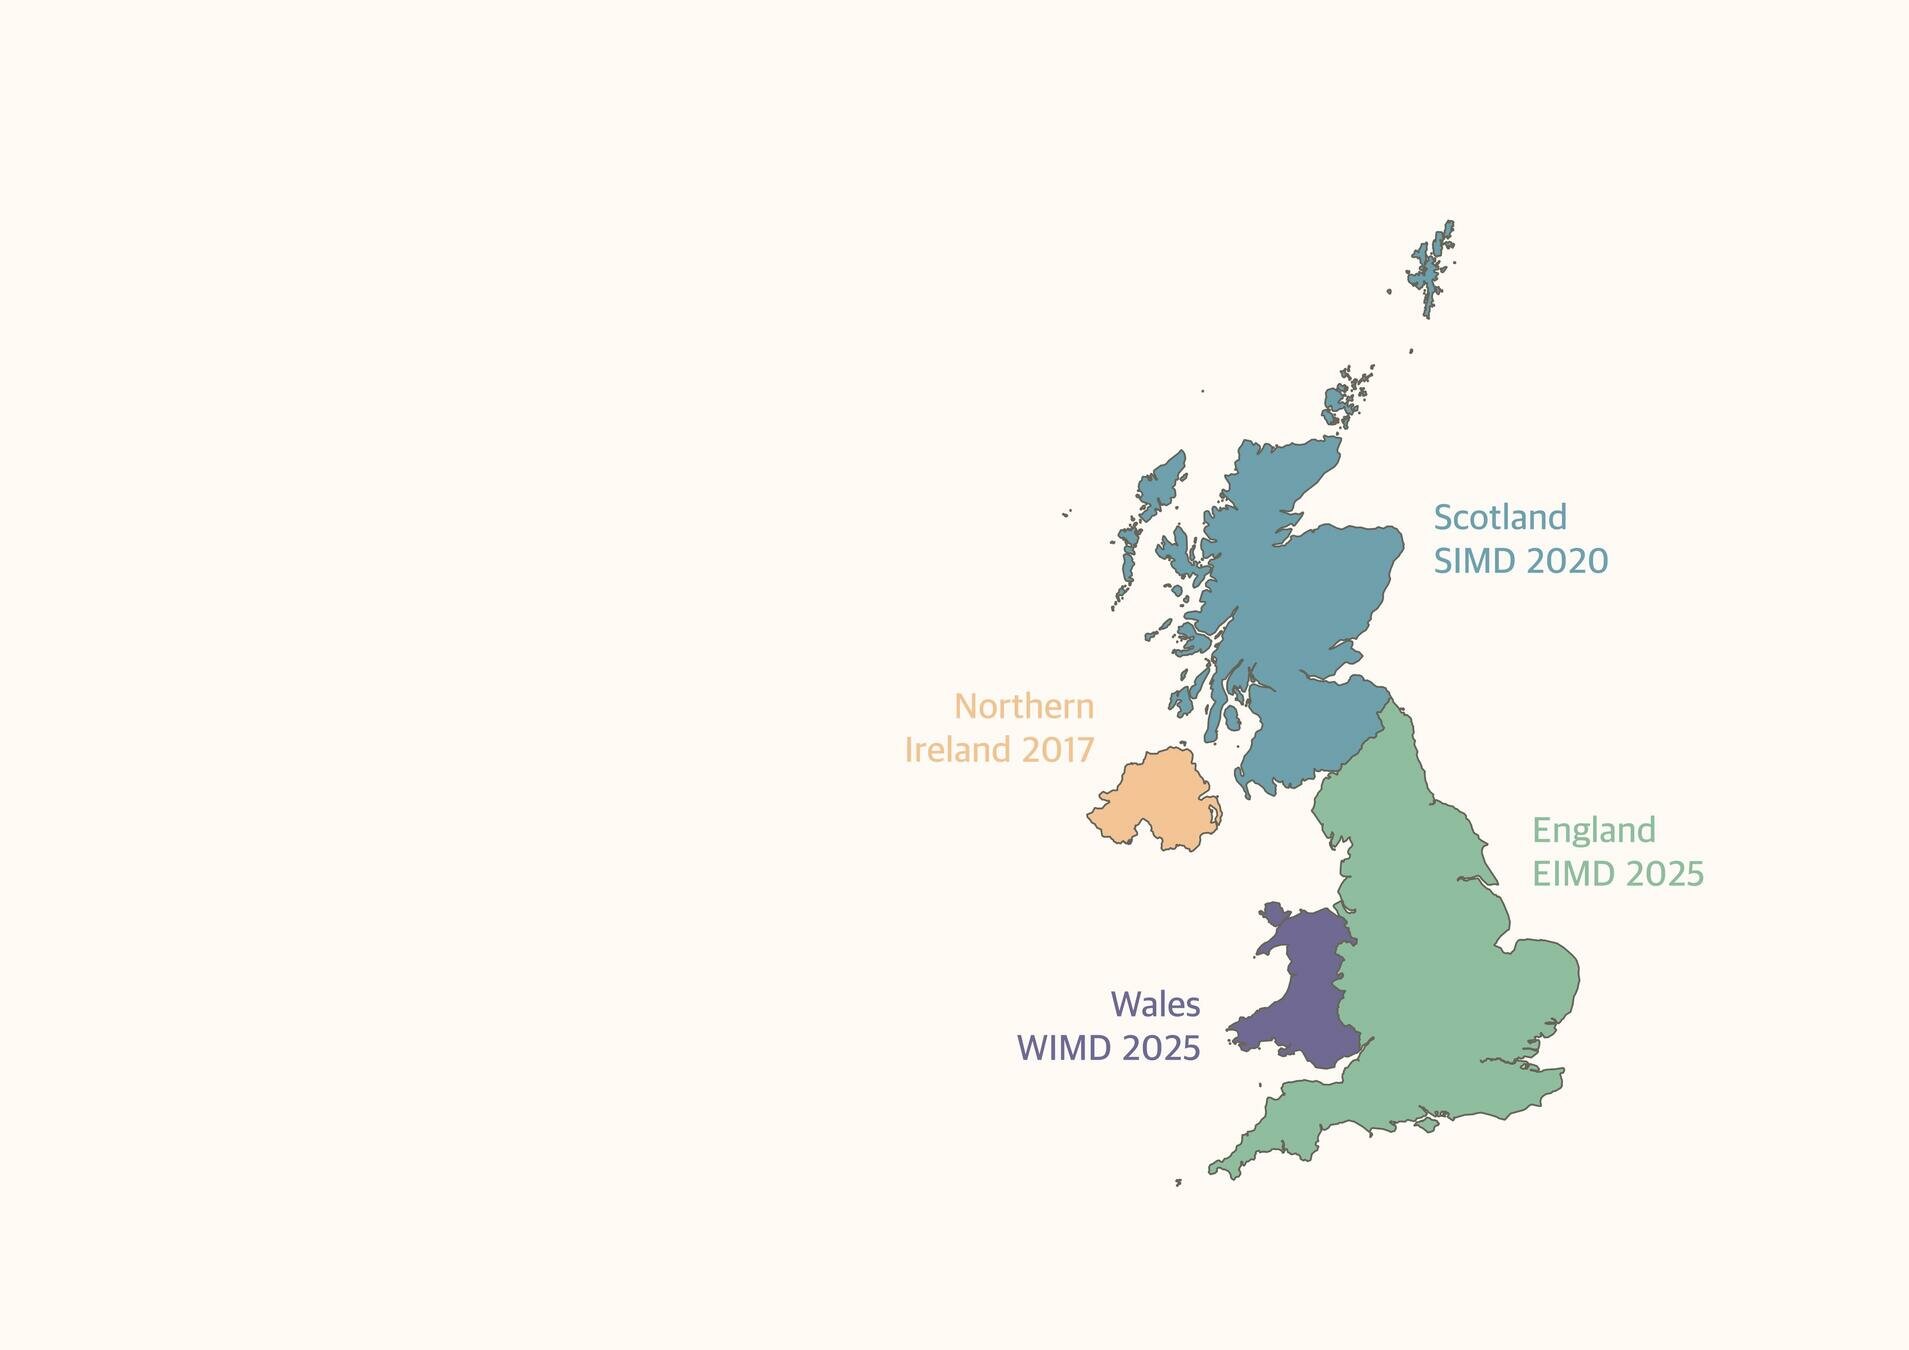
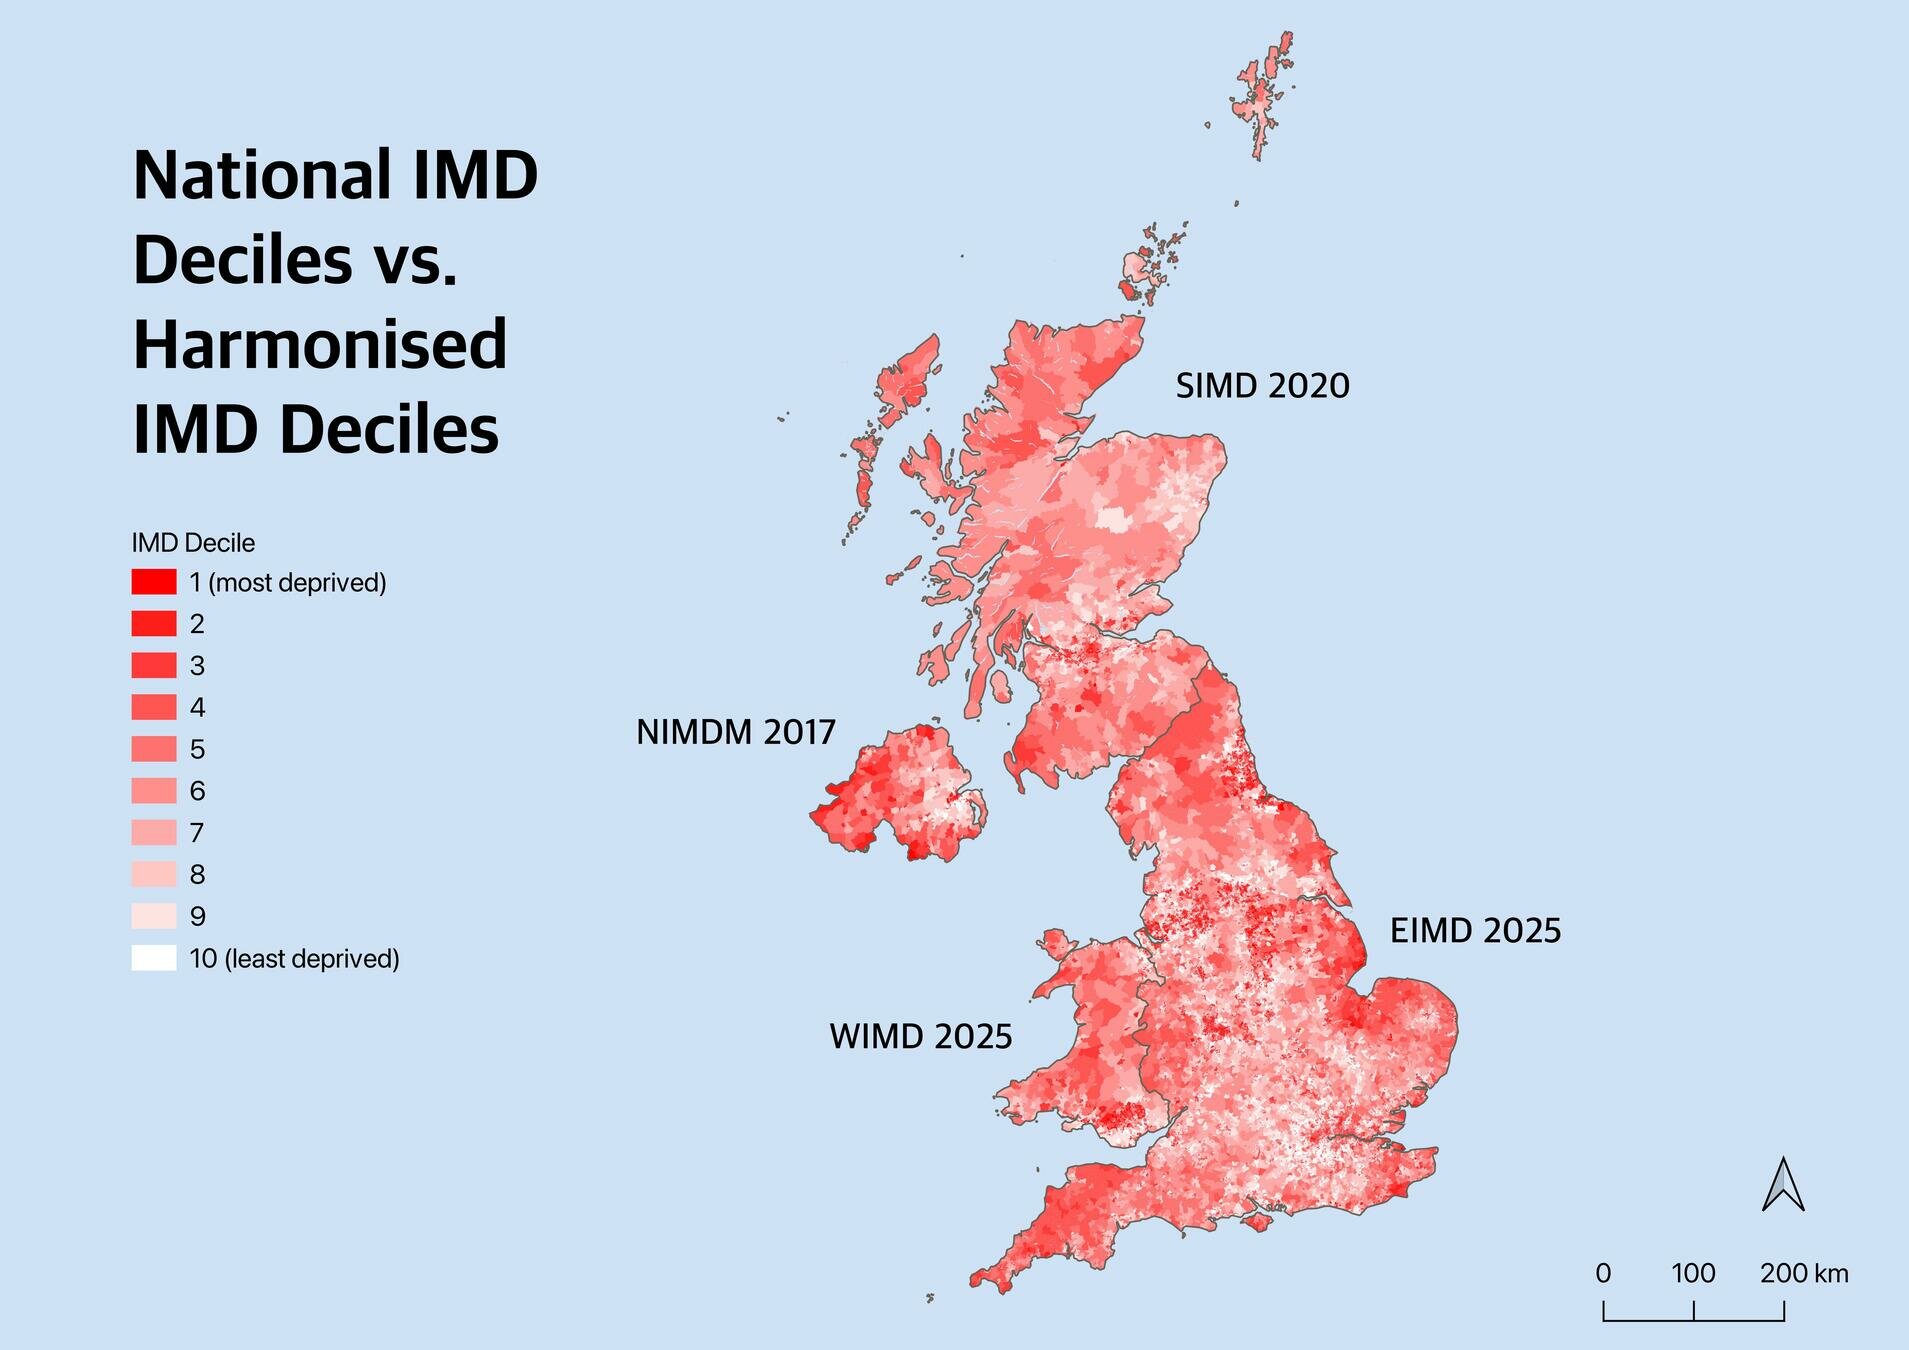
- Every nation in the UK uses a different IMD measure ( SIMD, NIMDM, WIMD, EIMD)
- National IMD scores are not directly comparable
- Underlying IMD data is often years out of date
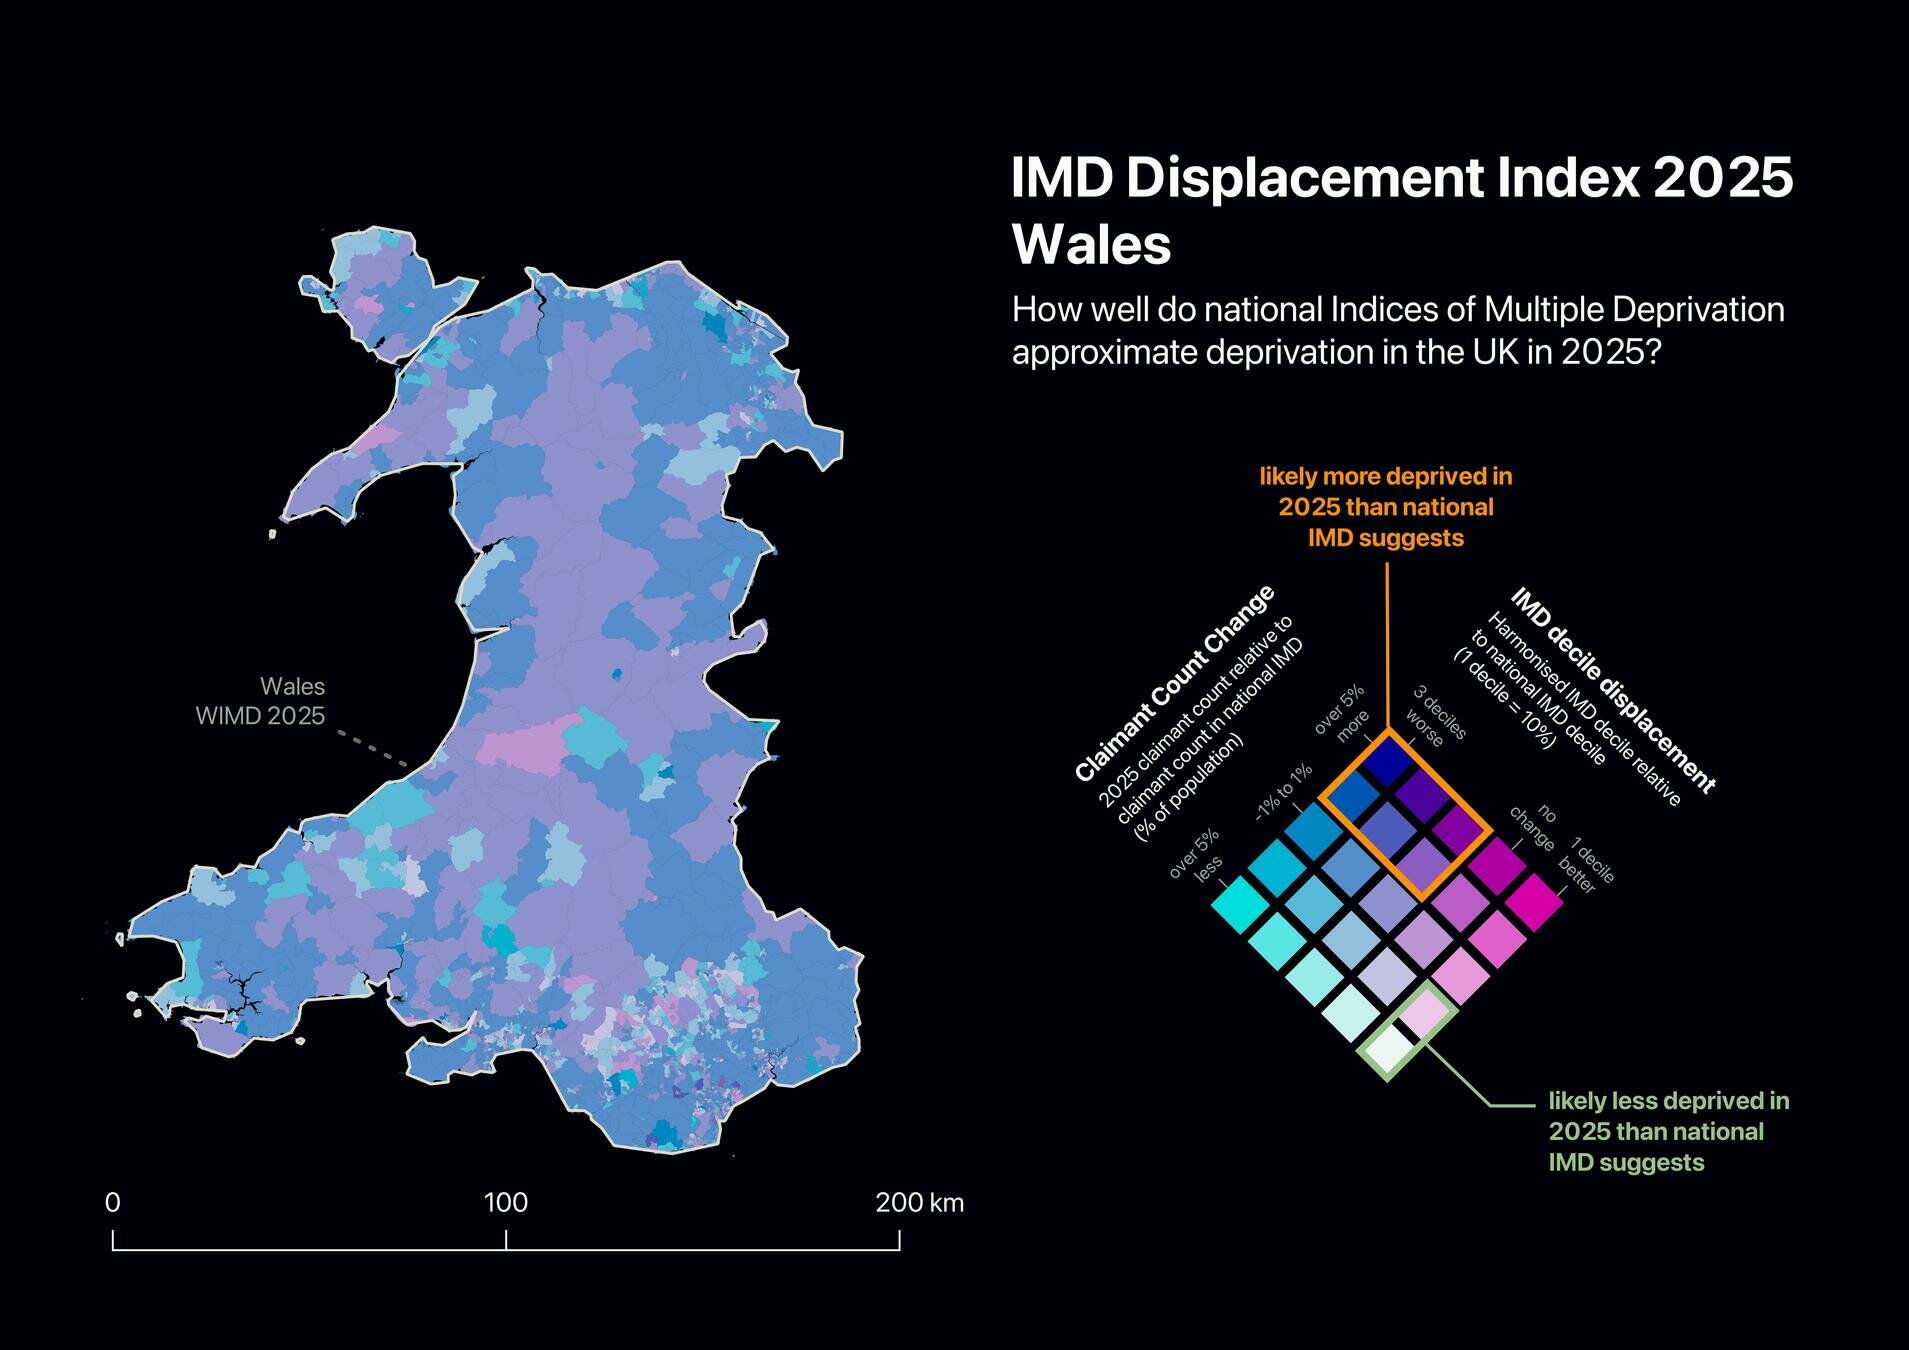
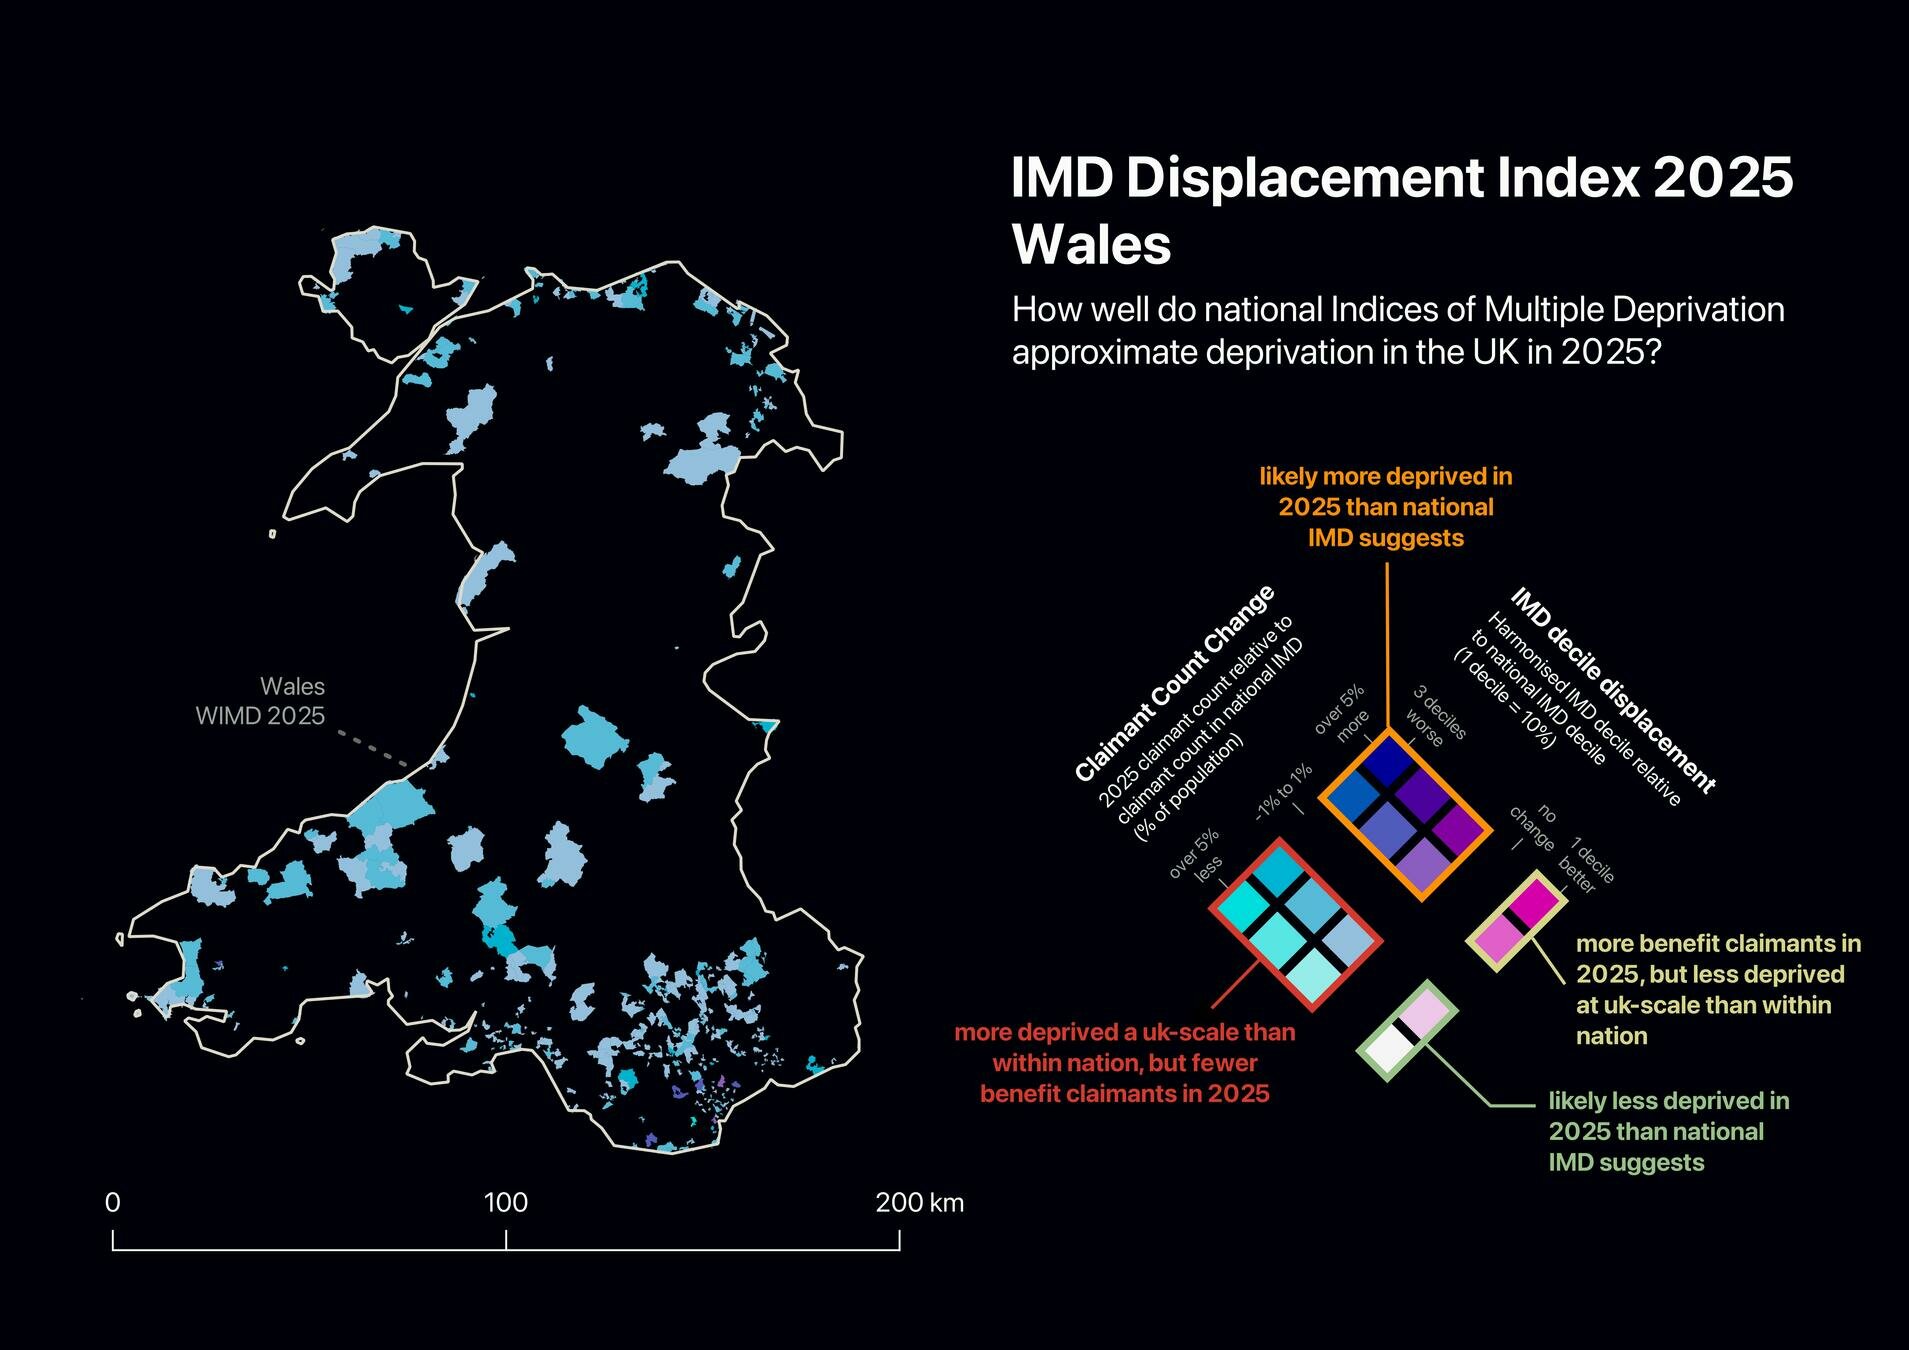
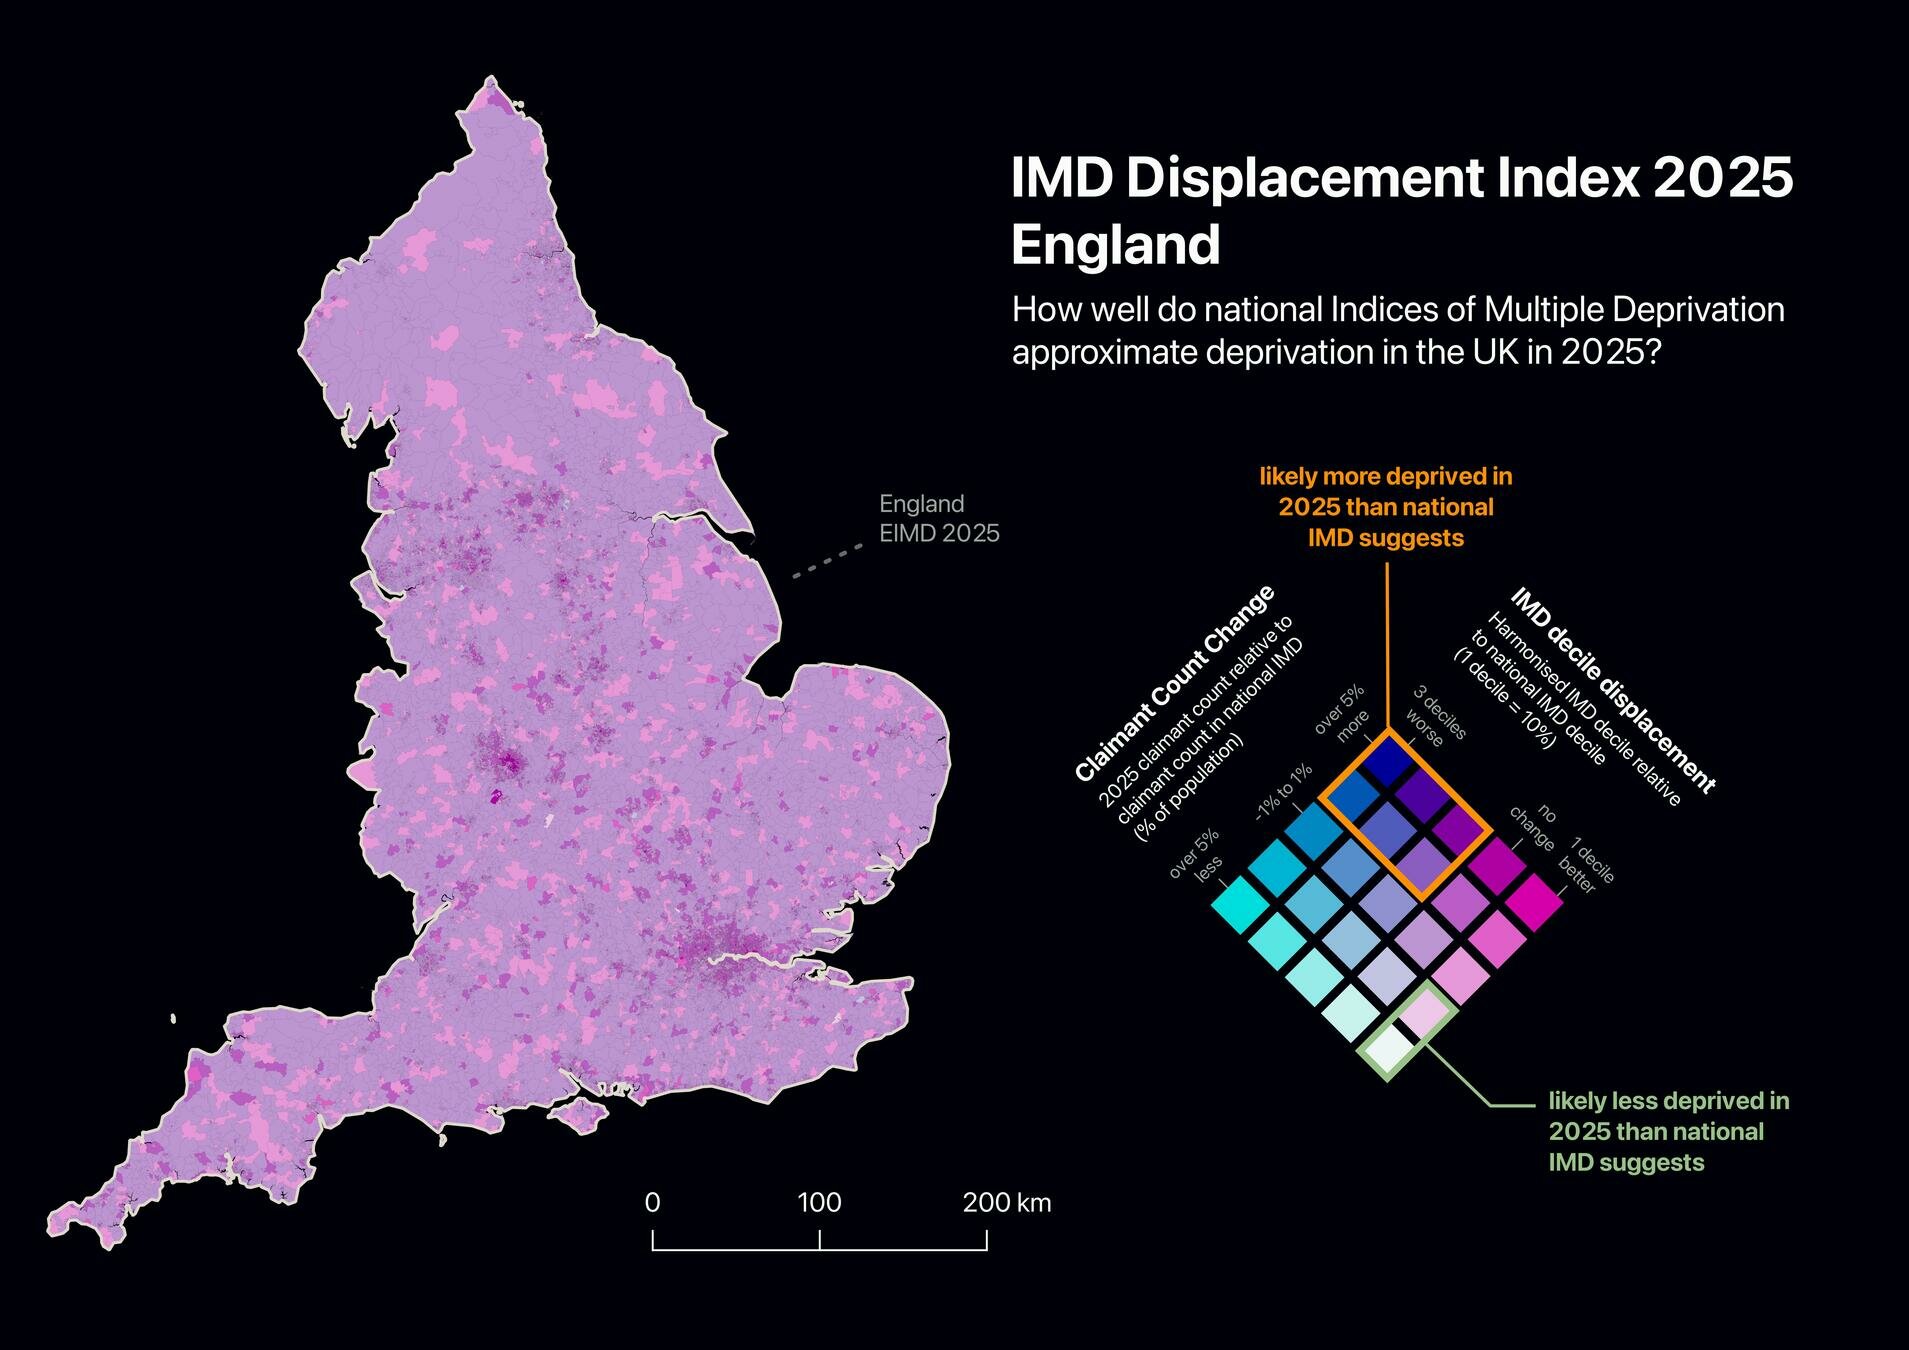
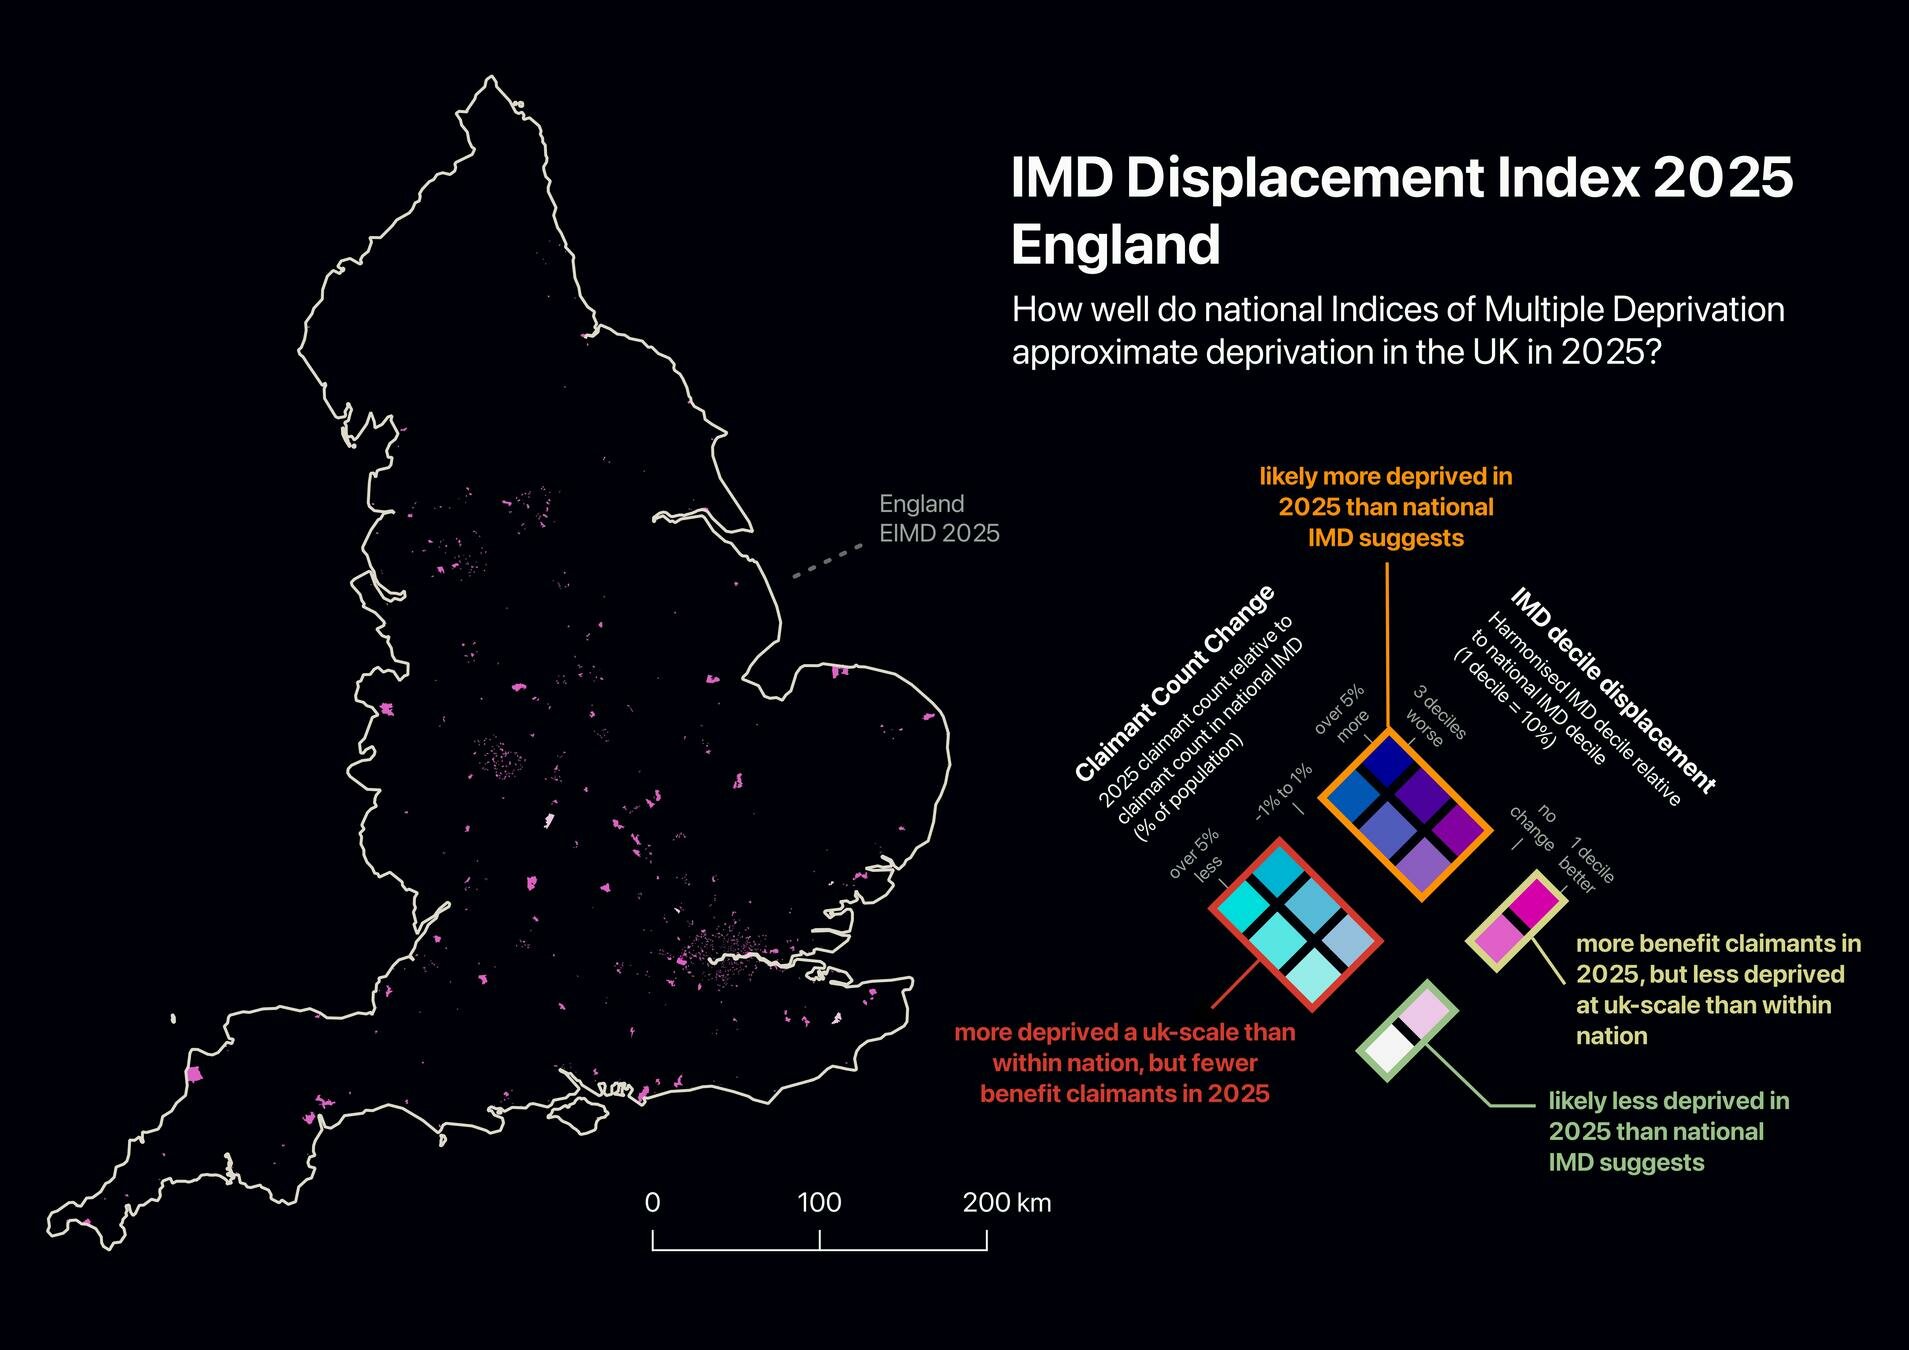
- What spatial patterns of deprivation are hidden through the use of national and out-of-date IMD measures in the UK?
The Issue:
Previous Work
- Focussed on Temporal Differences: Annual Index of Deprivation (Autonomy)
- Focussed on UK Comparison: Composite 2020 UK Index of Multiple Deprivation (MySociety), UK Deprivation Index (Nuffield Foundation)
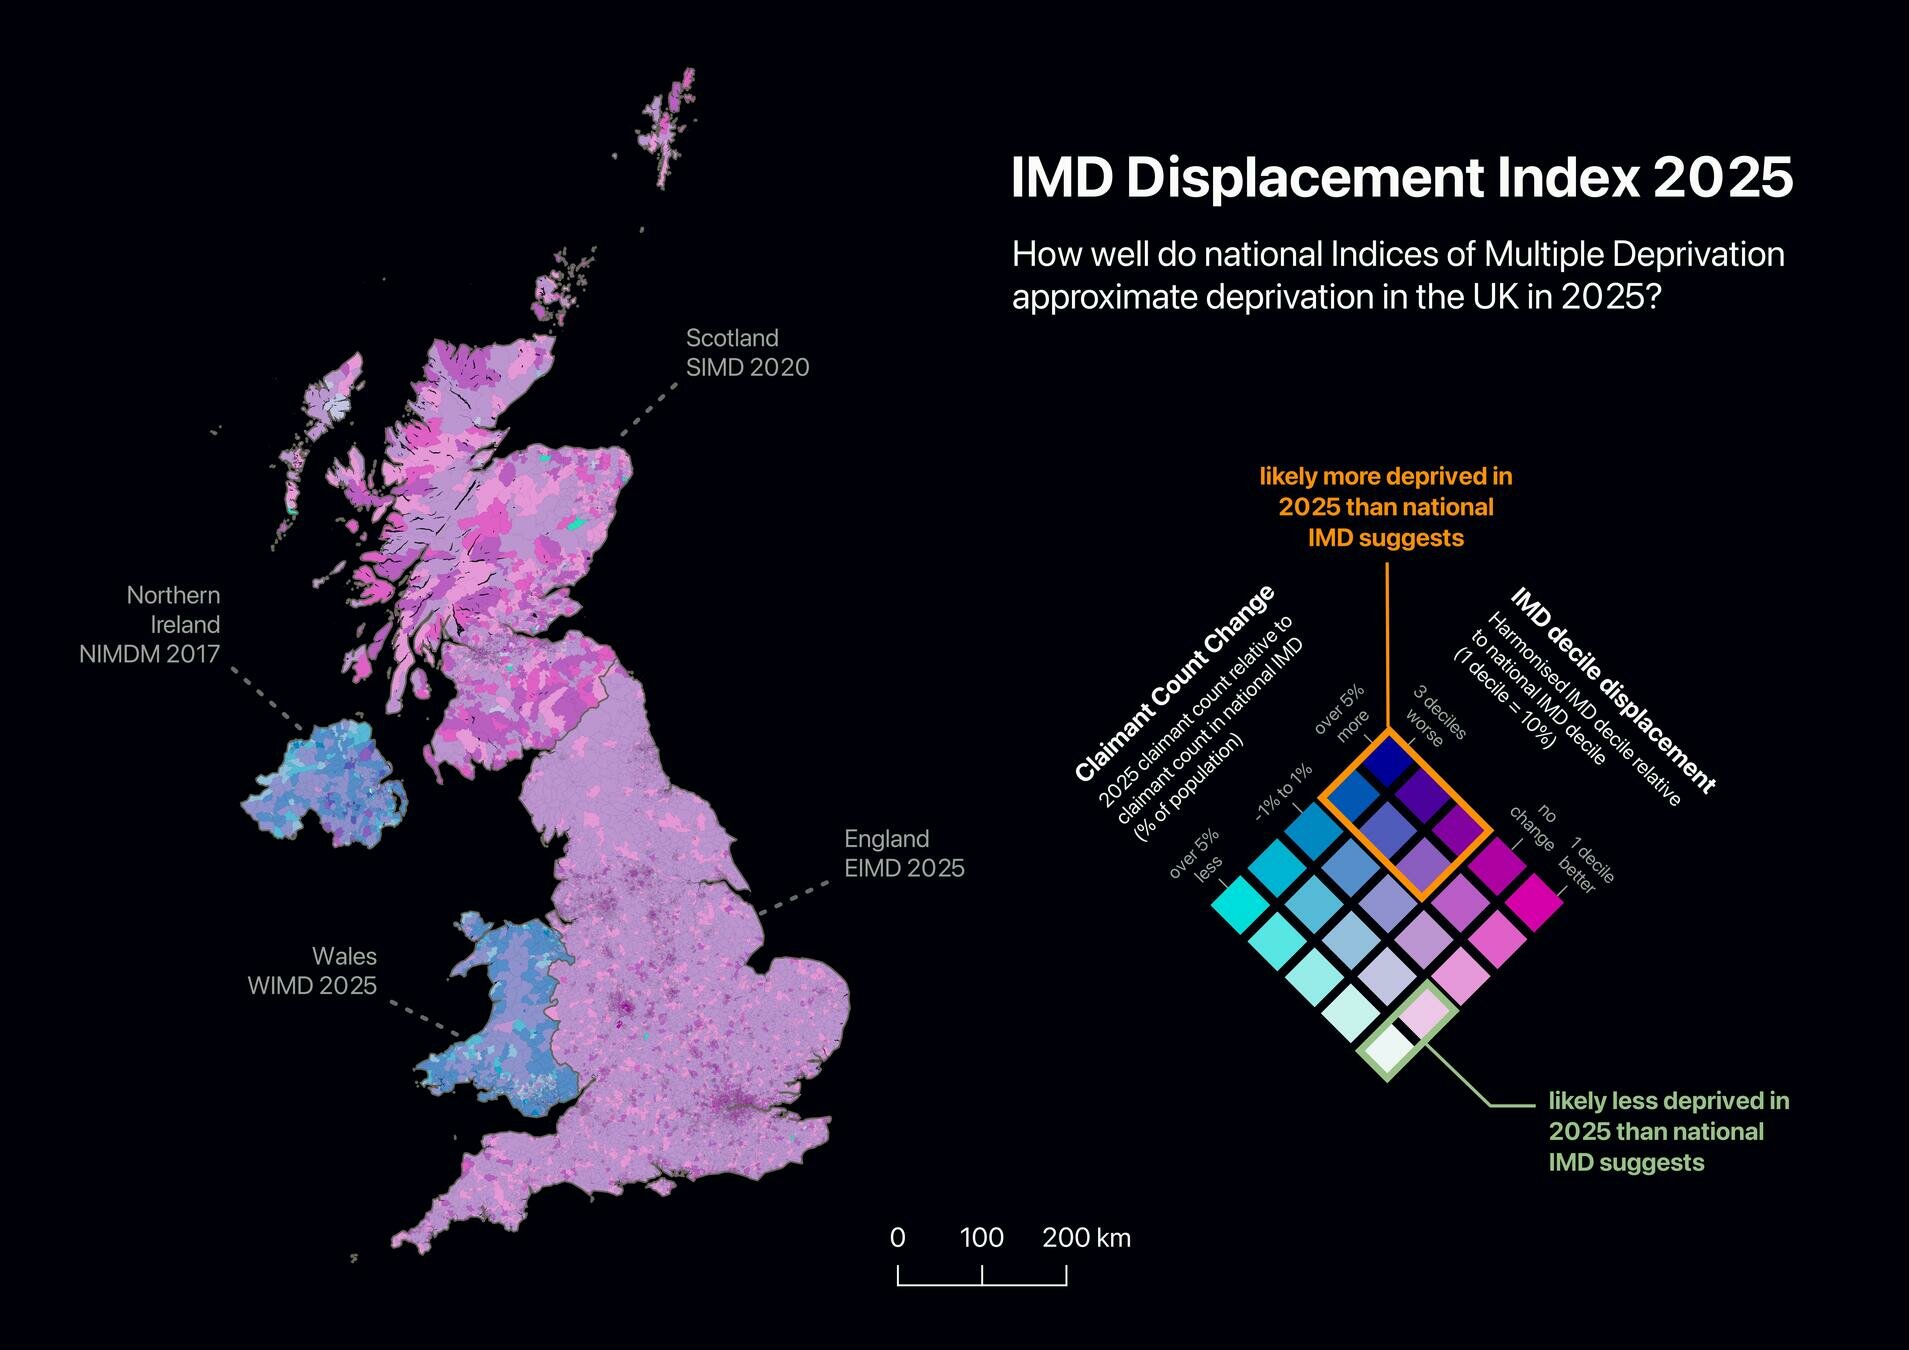
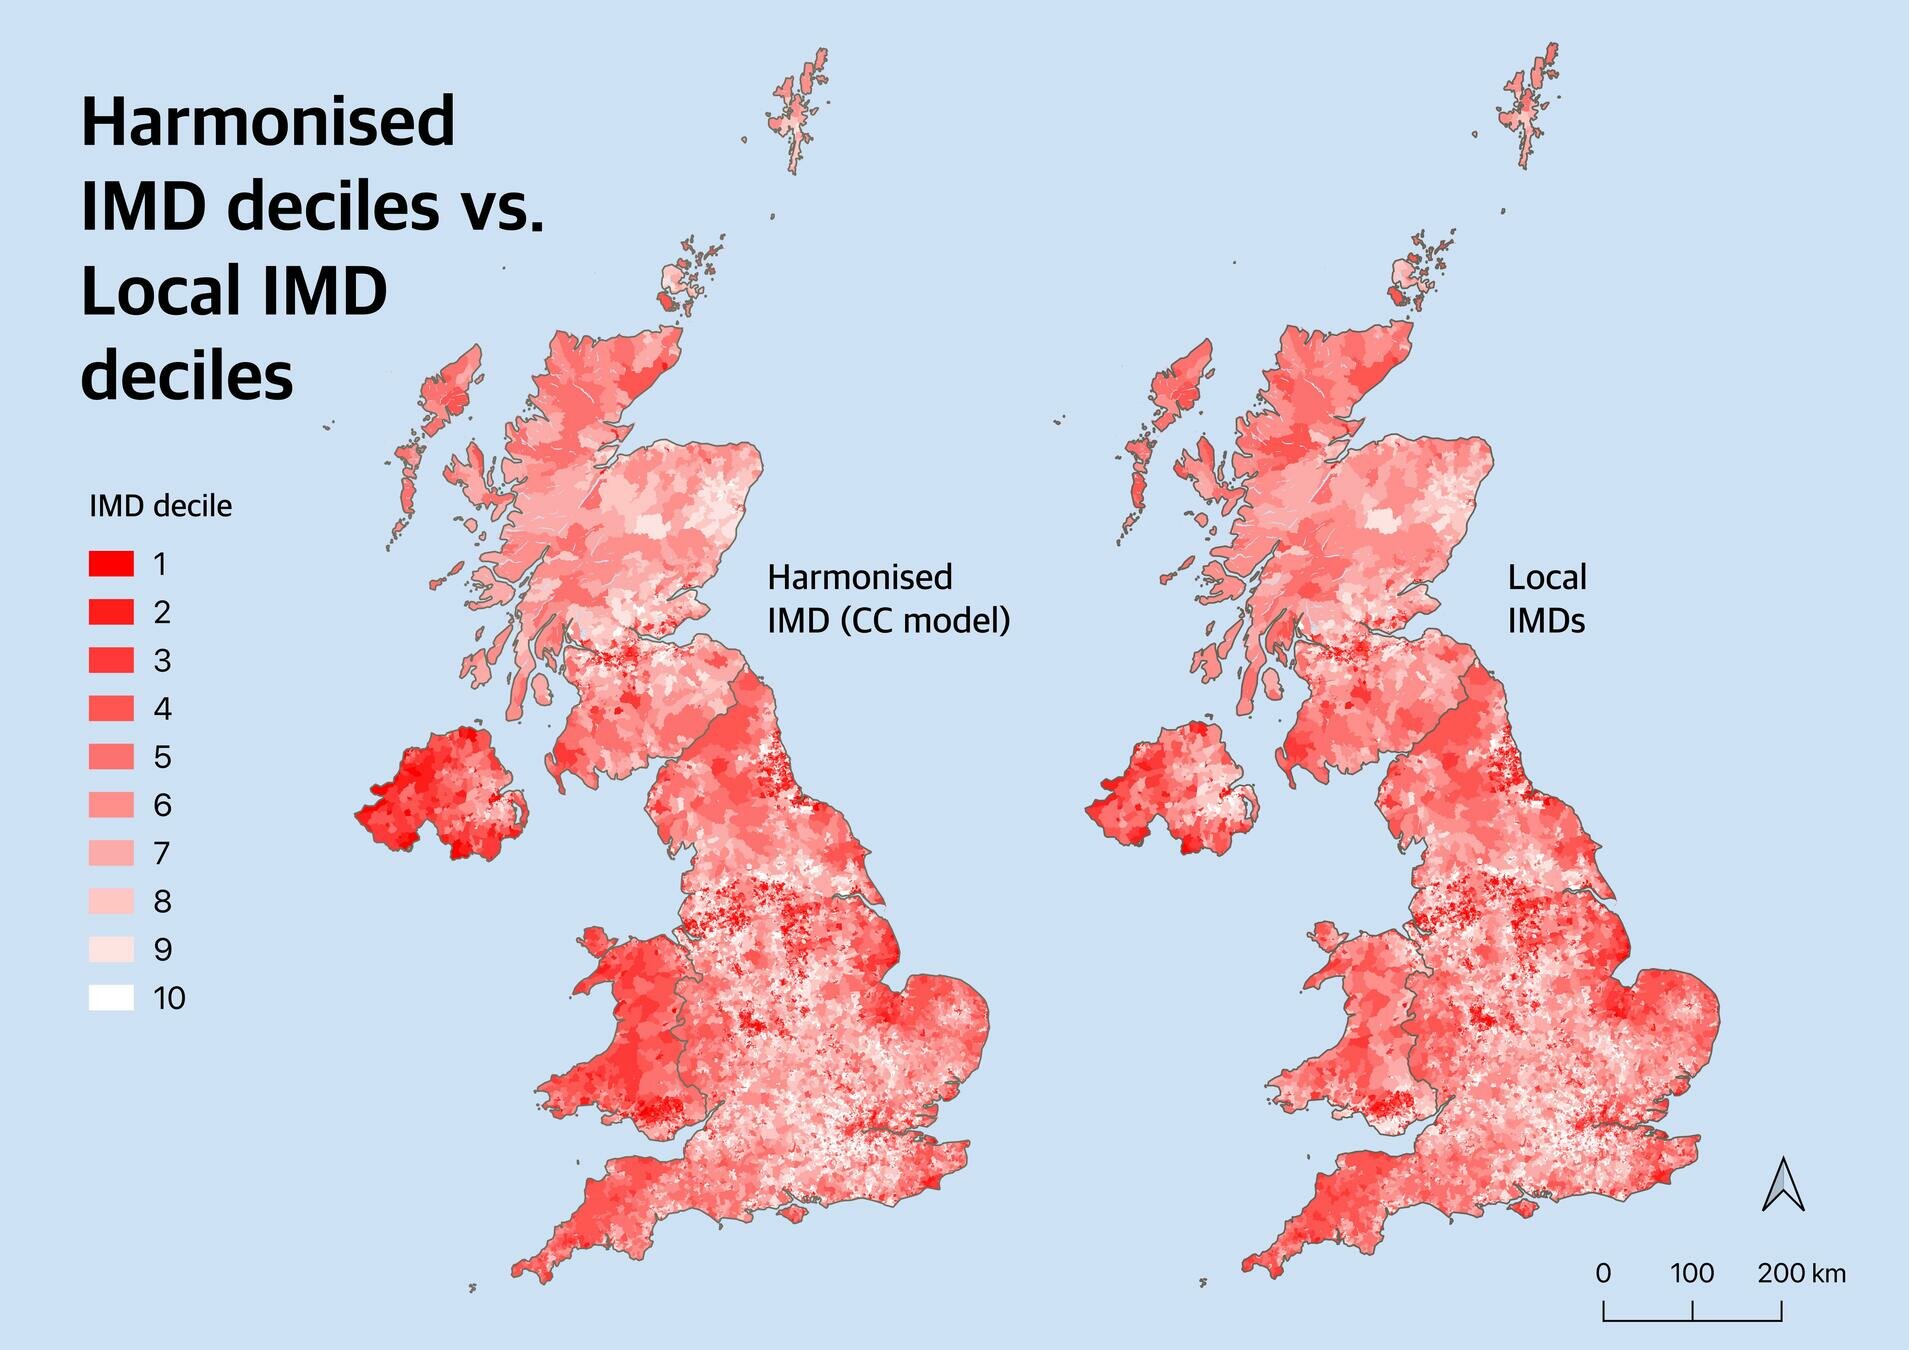
- My approach examines both issues to calculate IMD displacement in 2025 and across the UK
- Comparing national IMDs - Key Differences and Similarities
- Methodology - Harmonisation Approach and Claimant Count Comparison
- Findings - National vs Harmonised IMD, National IMD vs 2025 Claimant Count
- IMD Displacement Index - Putting it all together
- Conclusion
Overview:
Comparing National IMDs
Key differences between national IMD measures:
- Temporal scope
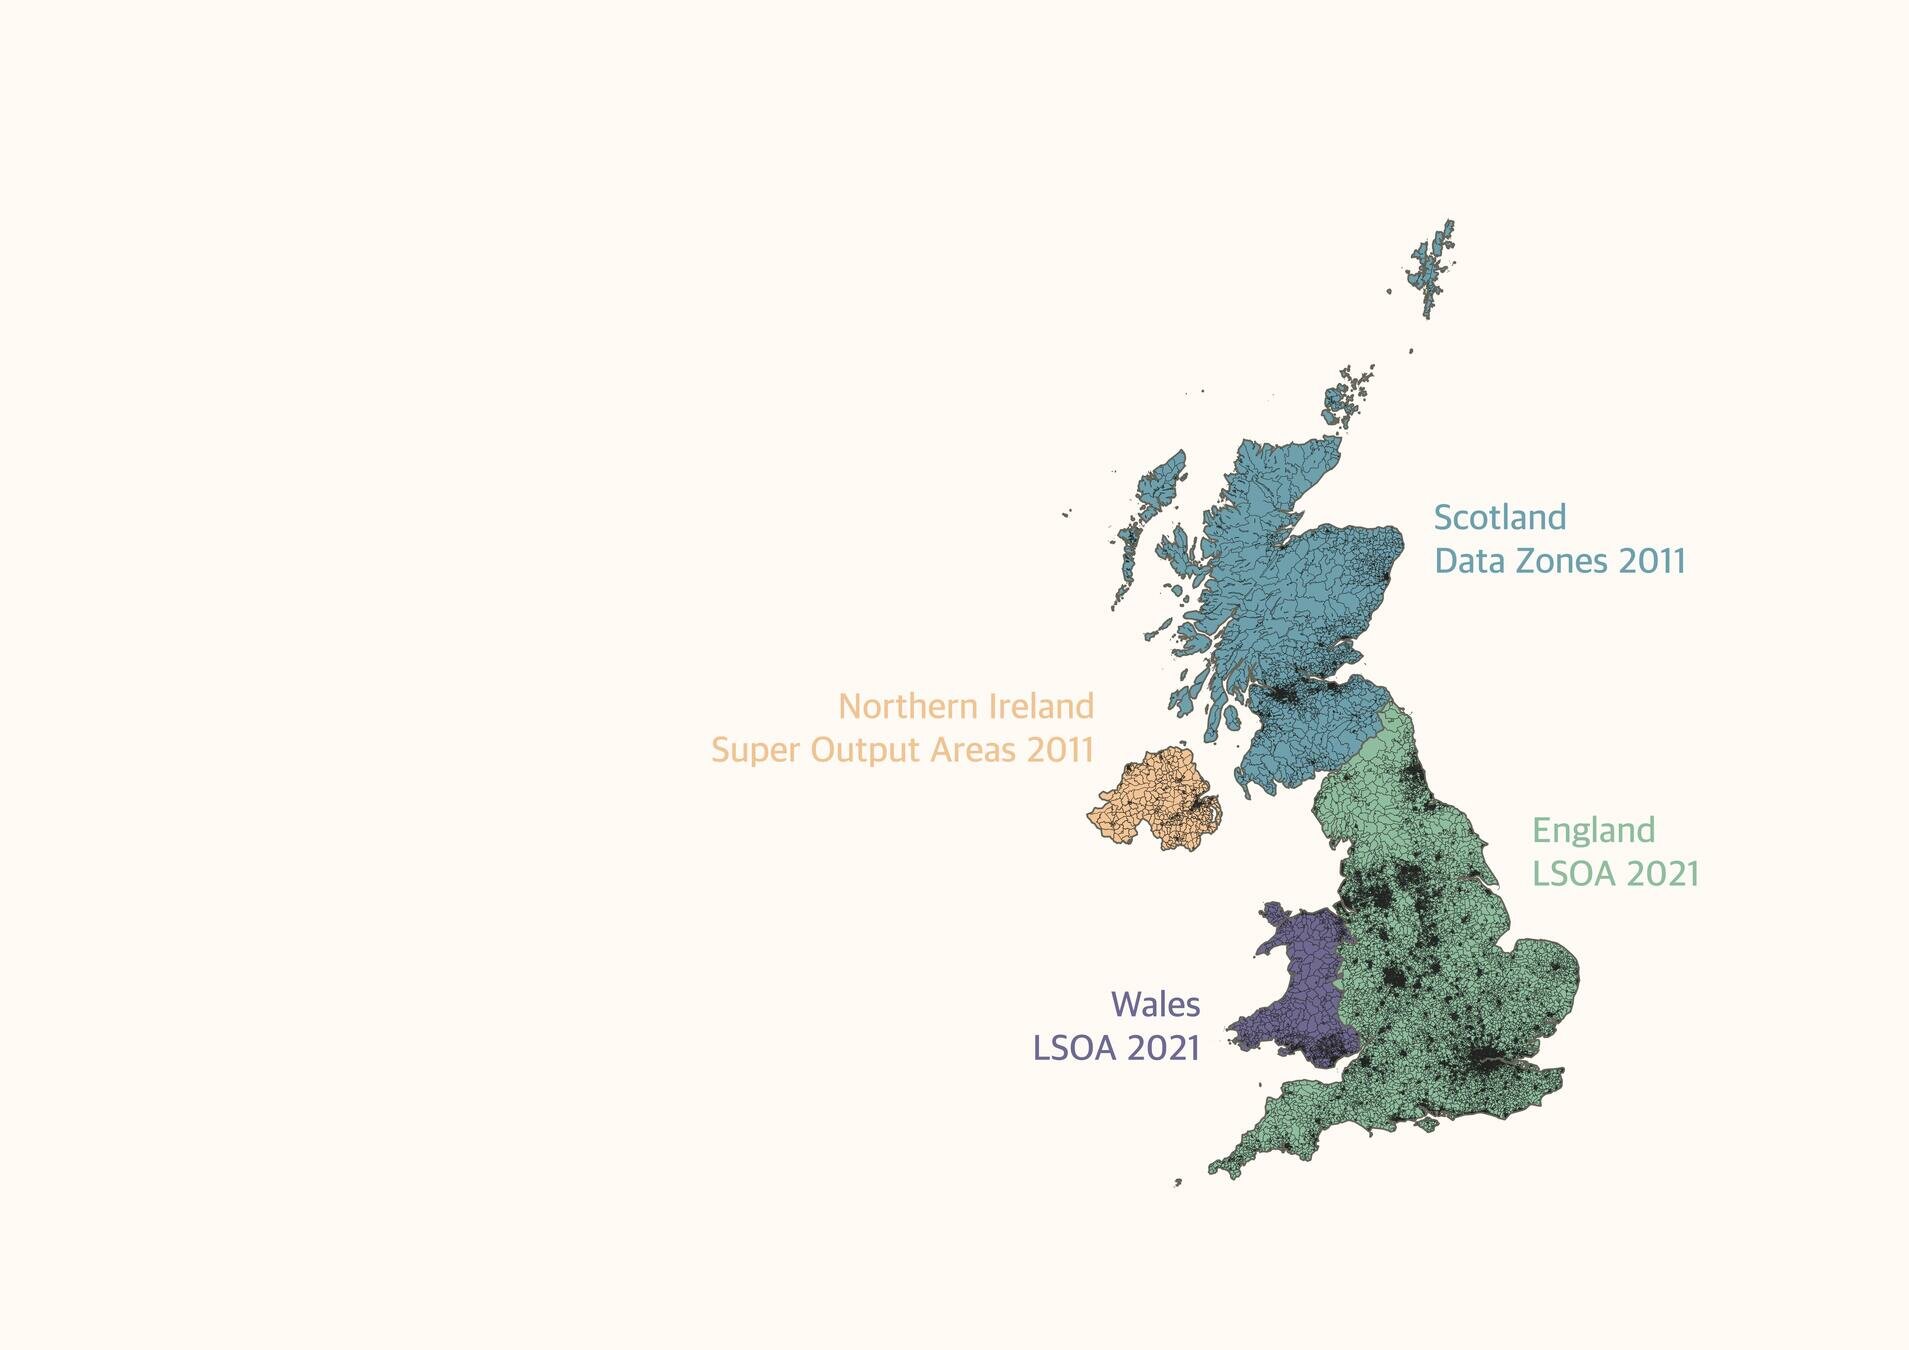
- Small area geographies
- Domain weighting schemes
- Underlying Indicators
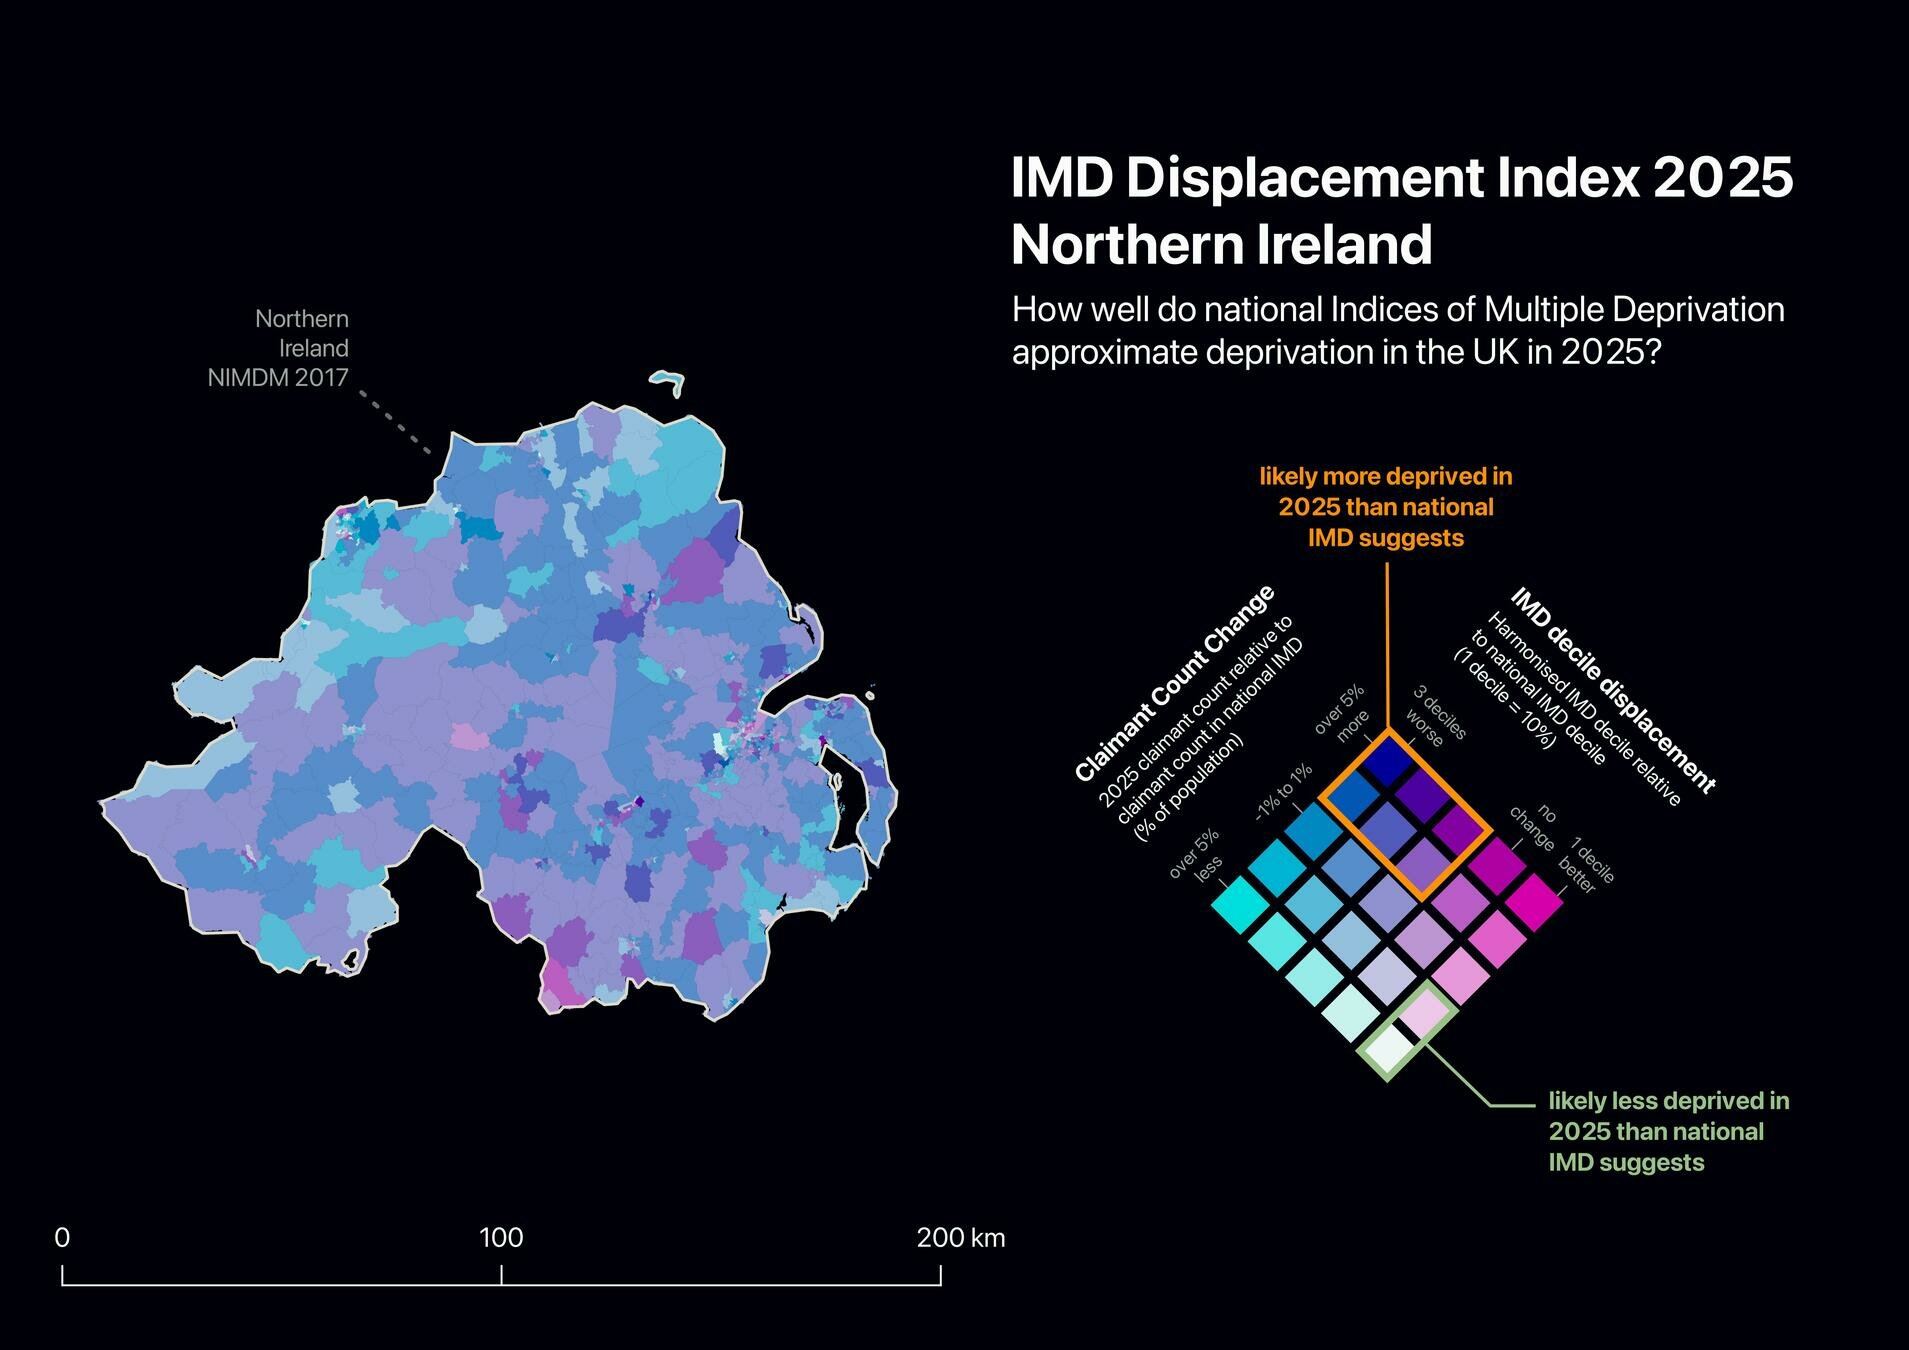
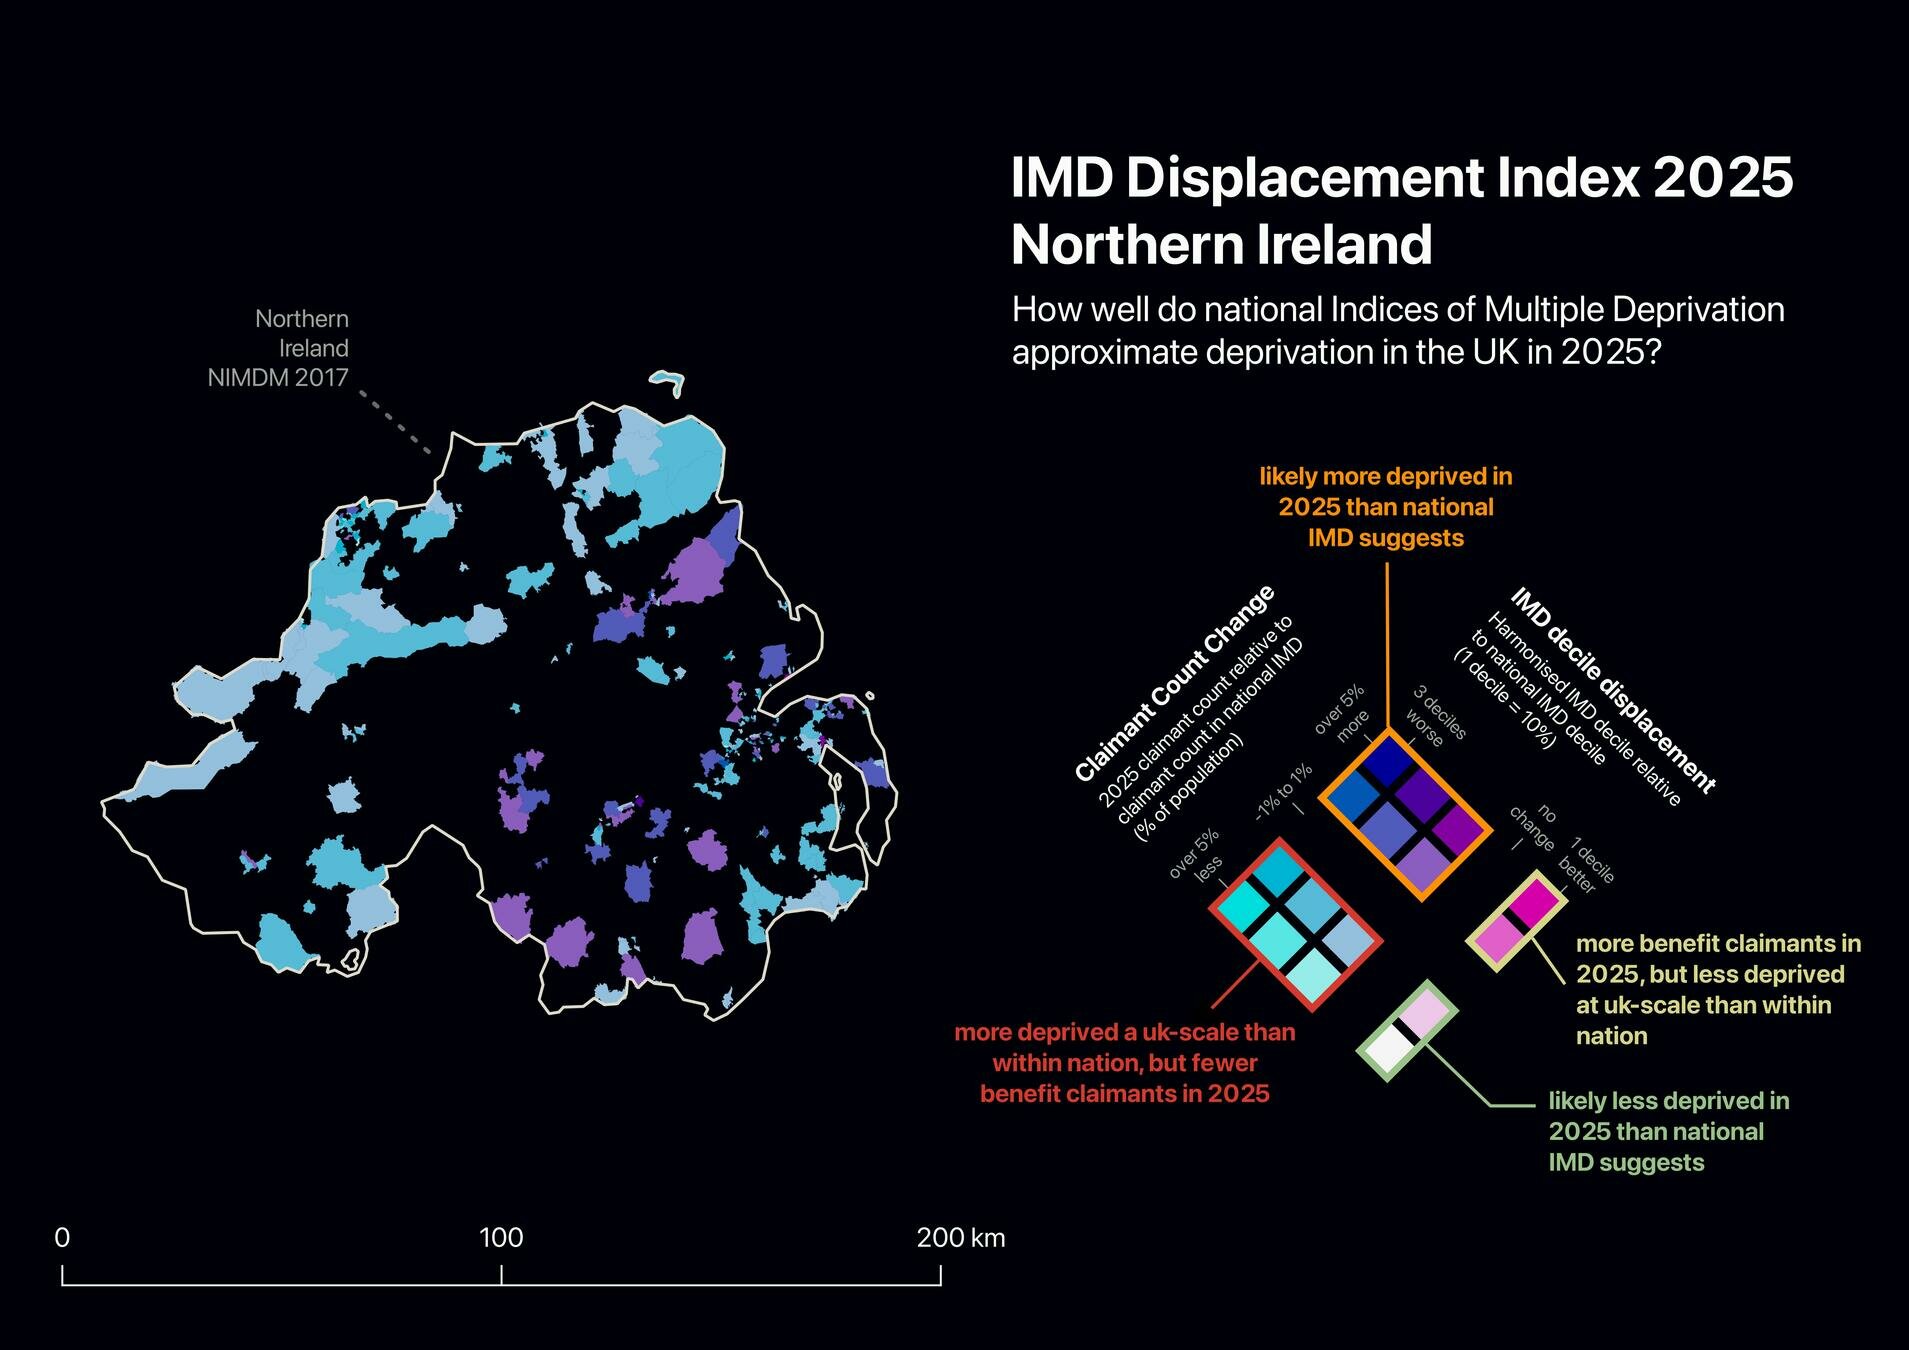
Northern Ireland
NIMDM 2017
NIMDM 2017
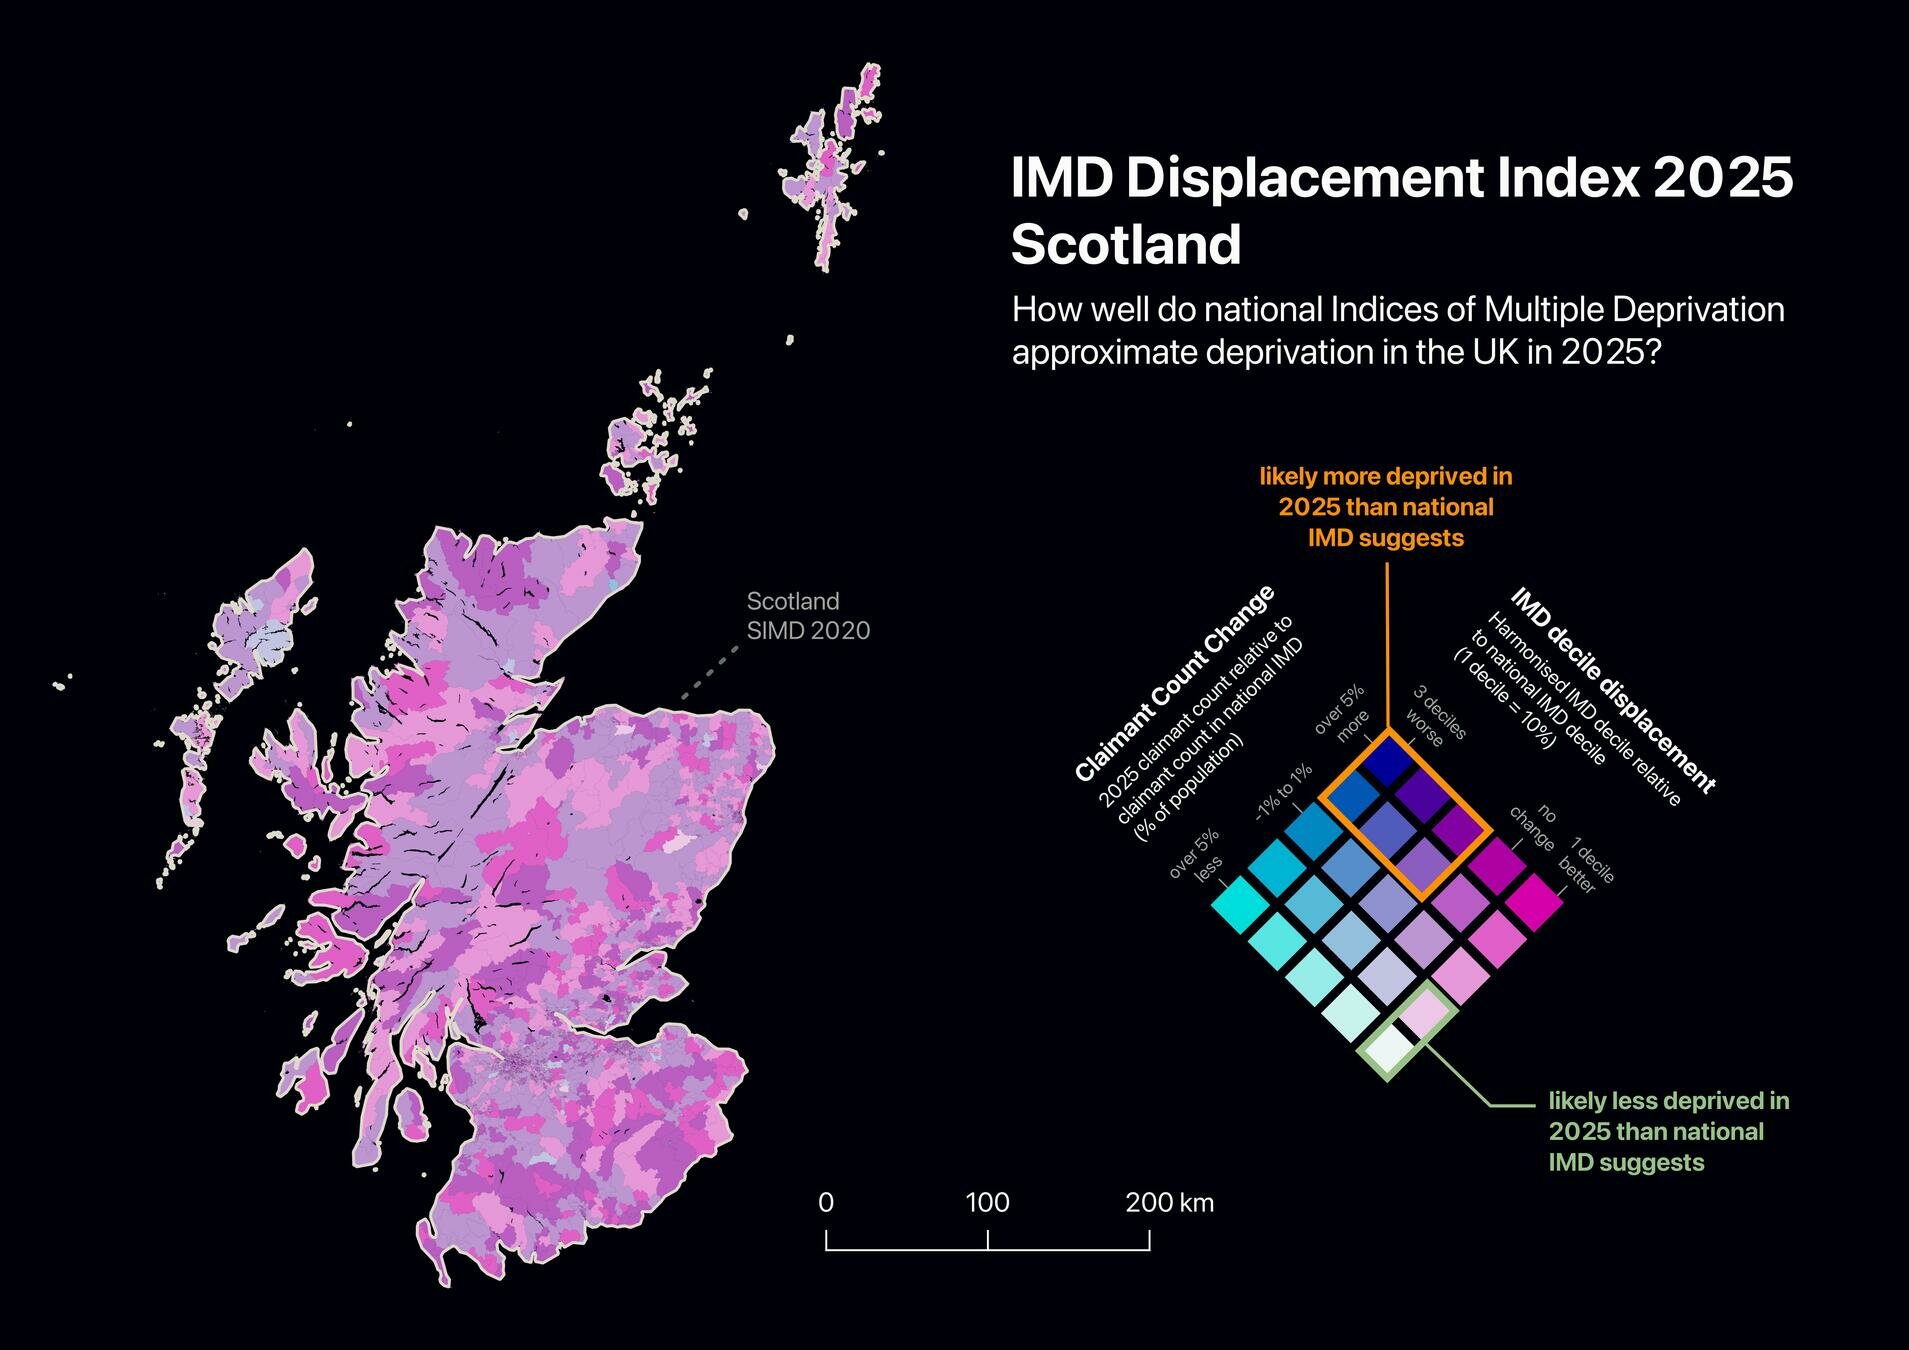
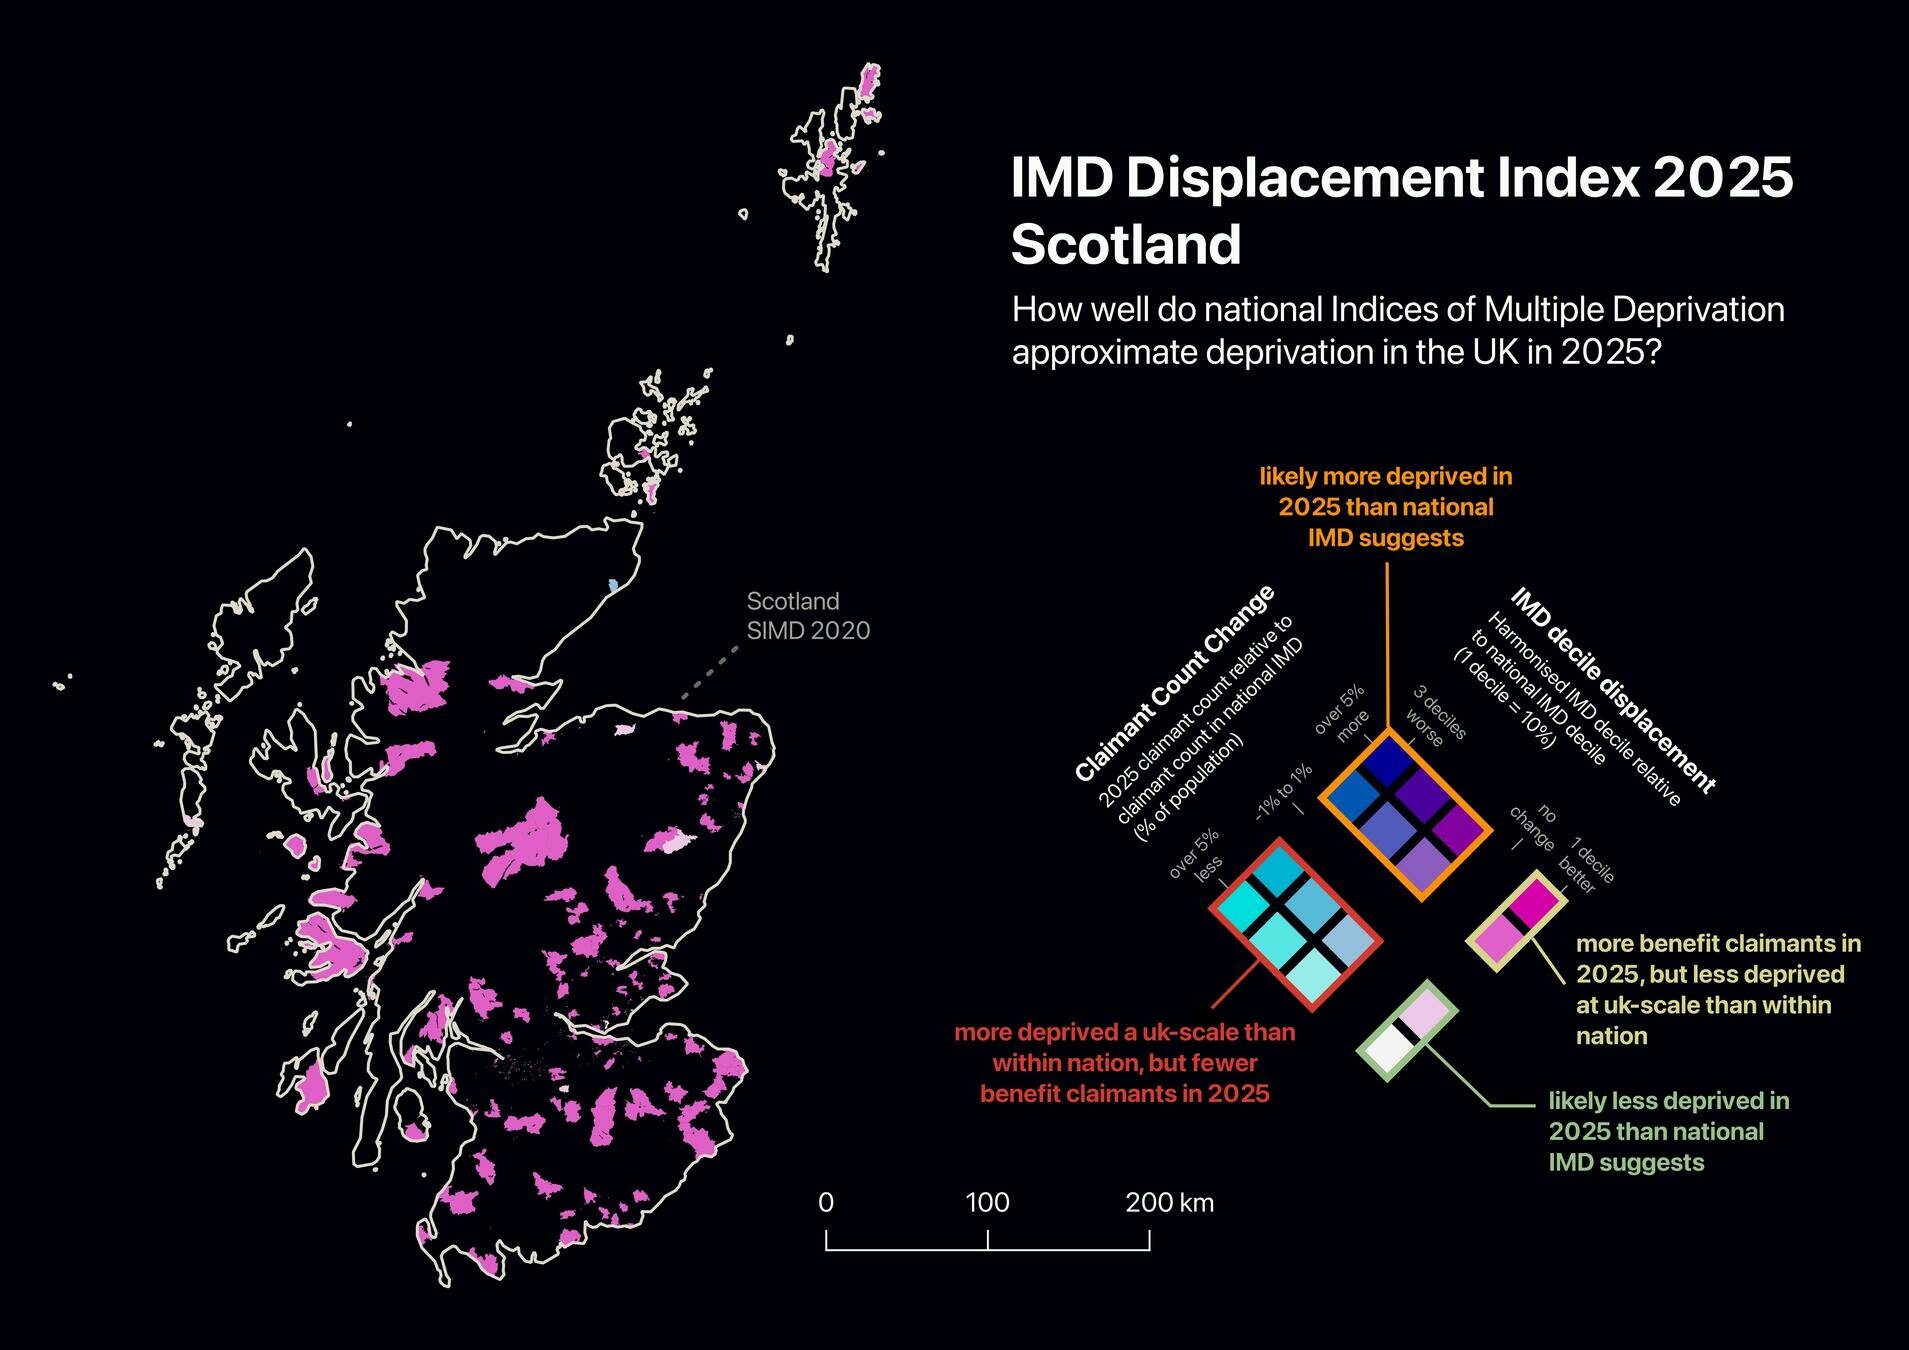
SIMD 2020
EIMD 2025
WIMD 2025
Employment Domain Measures Comparison
| NIMDM 2017 | SIMD 2020 | WIMD 2025 | EIMD 2025 | |
|---|---|---|---|---|
| Job Seeker’s Allowance | yes | yes | yes | yes |
| New Style Jobseeker’s Allowance | yes | yes | yes | yes |
| Universal Credit (UC) in ’out of work’ categories | yes | yes | yes | yes |
| Income Support | ----- | ----- | yes | yes |
| Incapacity Benefit | yes | yes | yes | yes |
| Severe Disablement Allowance | yes | yes | yes | yes |
| Employment and Support Allowance | yes | yes | yes | yes |
| New Style Employment and Support Allowance | yes | yes | yes | yes |
| Carer’s Allowance | yes | ----- | yes | yes |
| People who do not receive benefits or income from employment | yes | ----- | ----- | ----- |
Non-Benfit Measures
Disability
Related
Non-Disability
Related
Benfit
Measures
claimant count
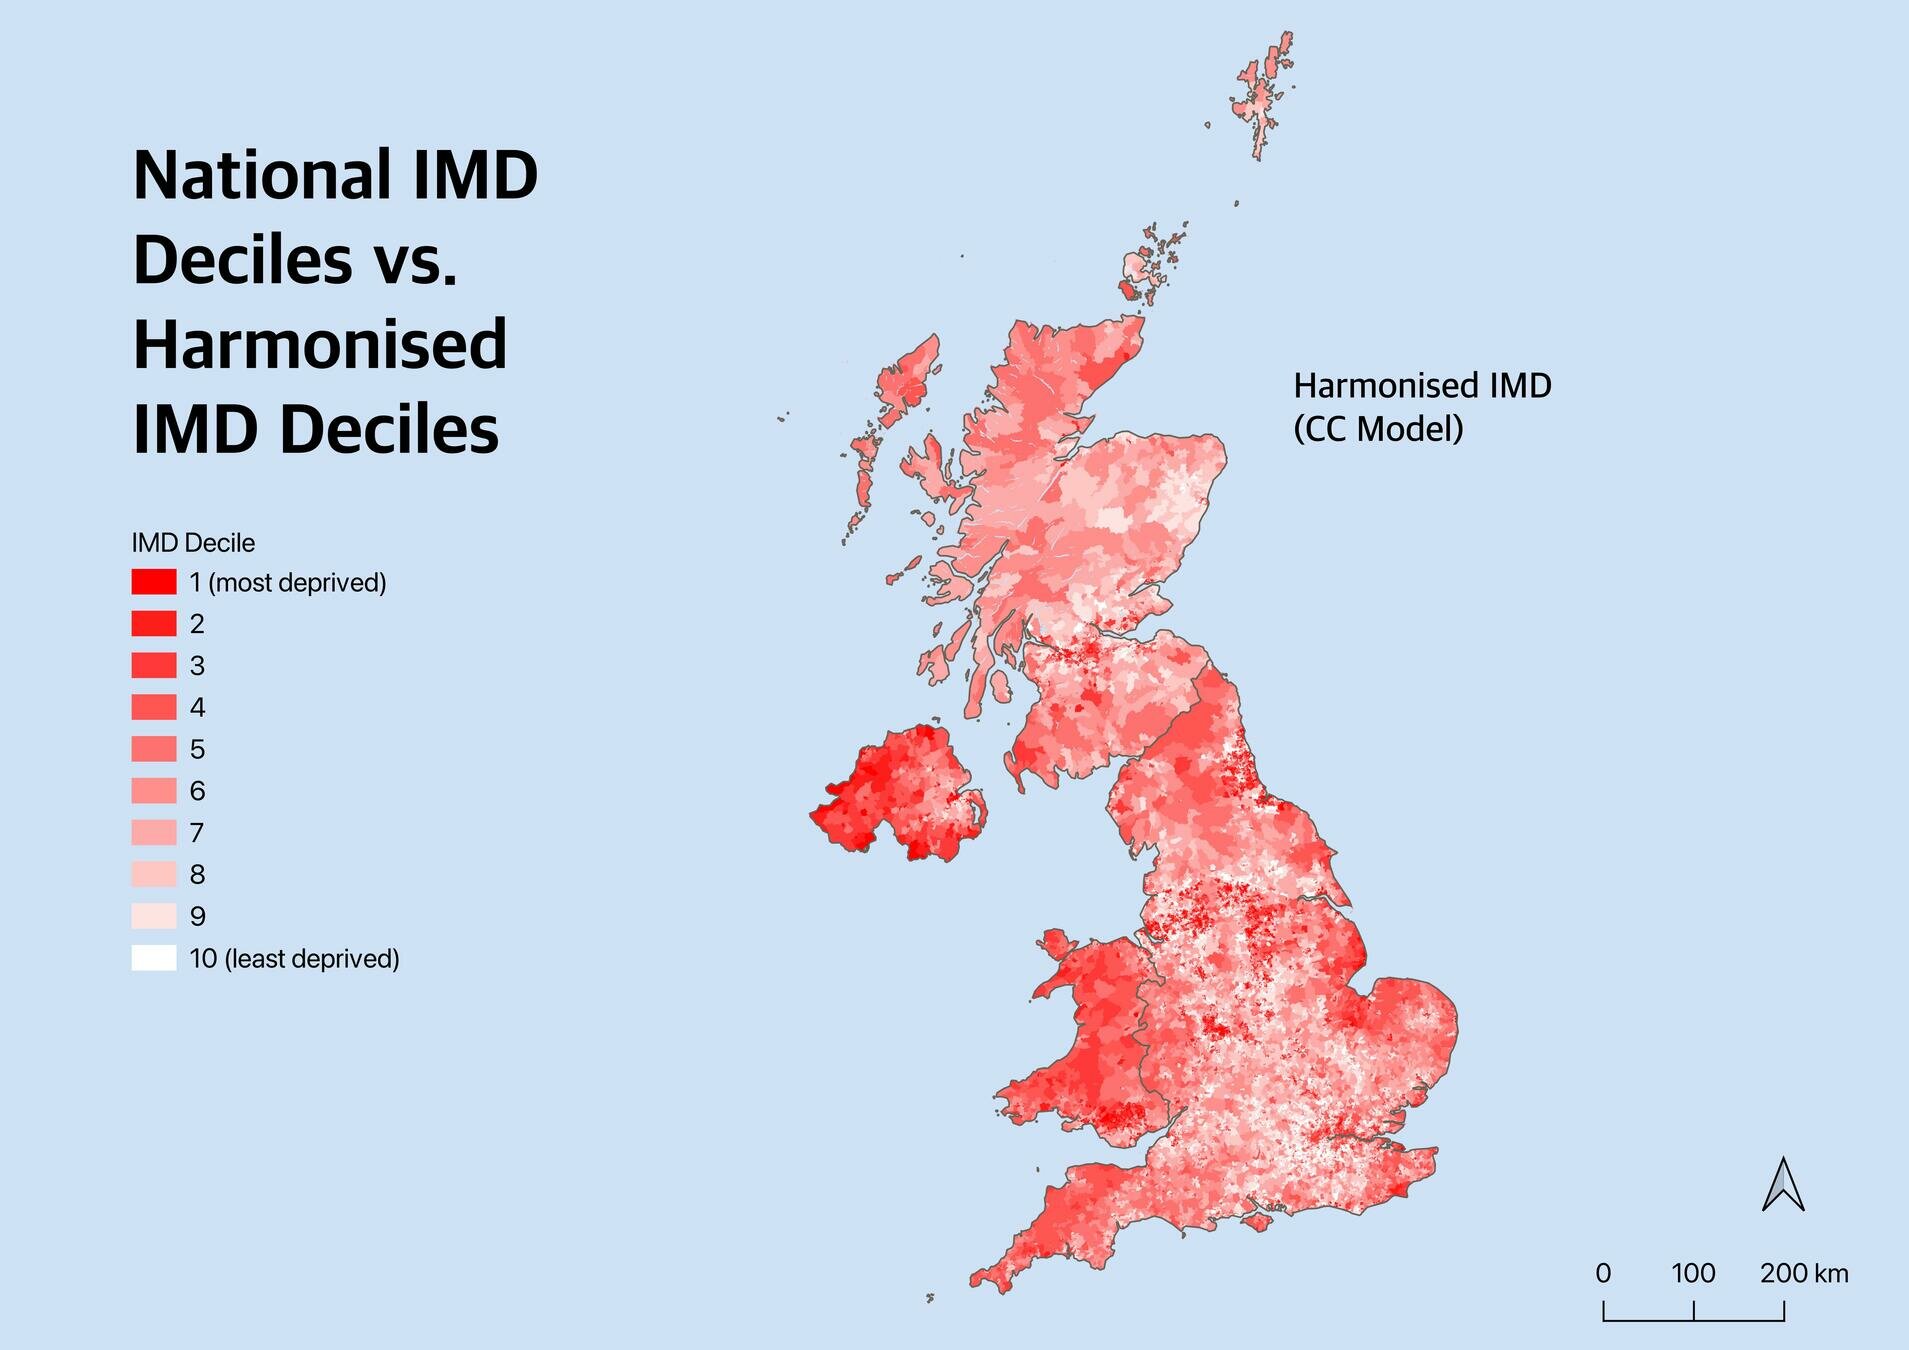
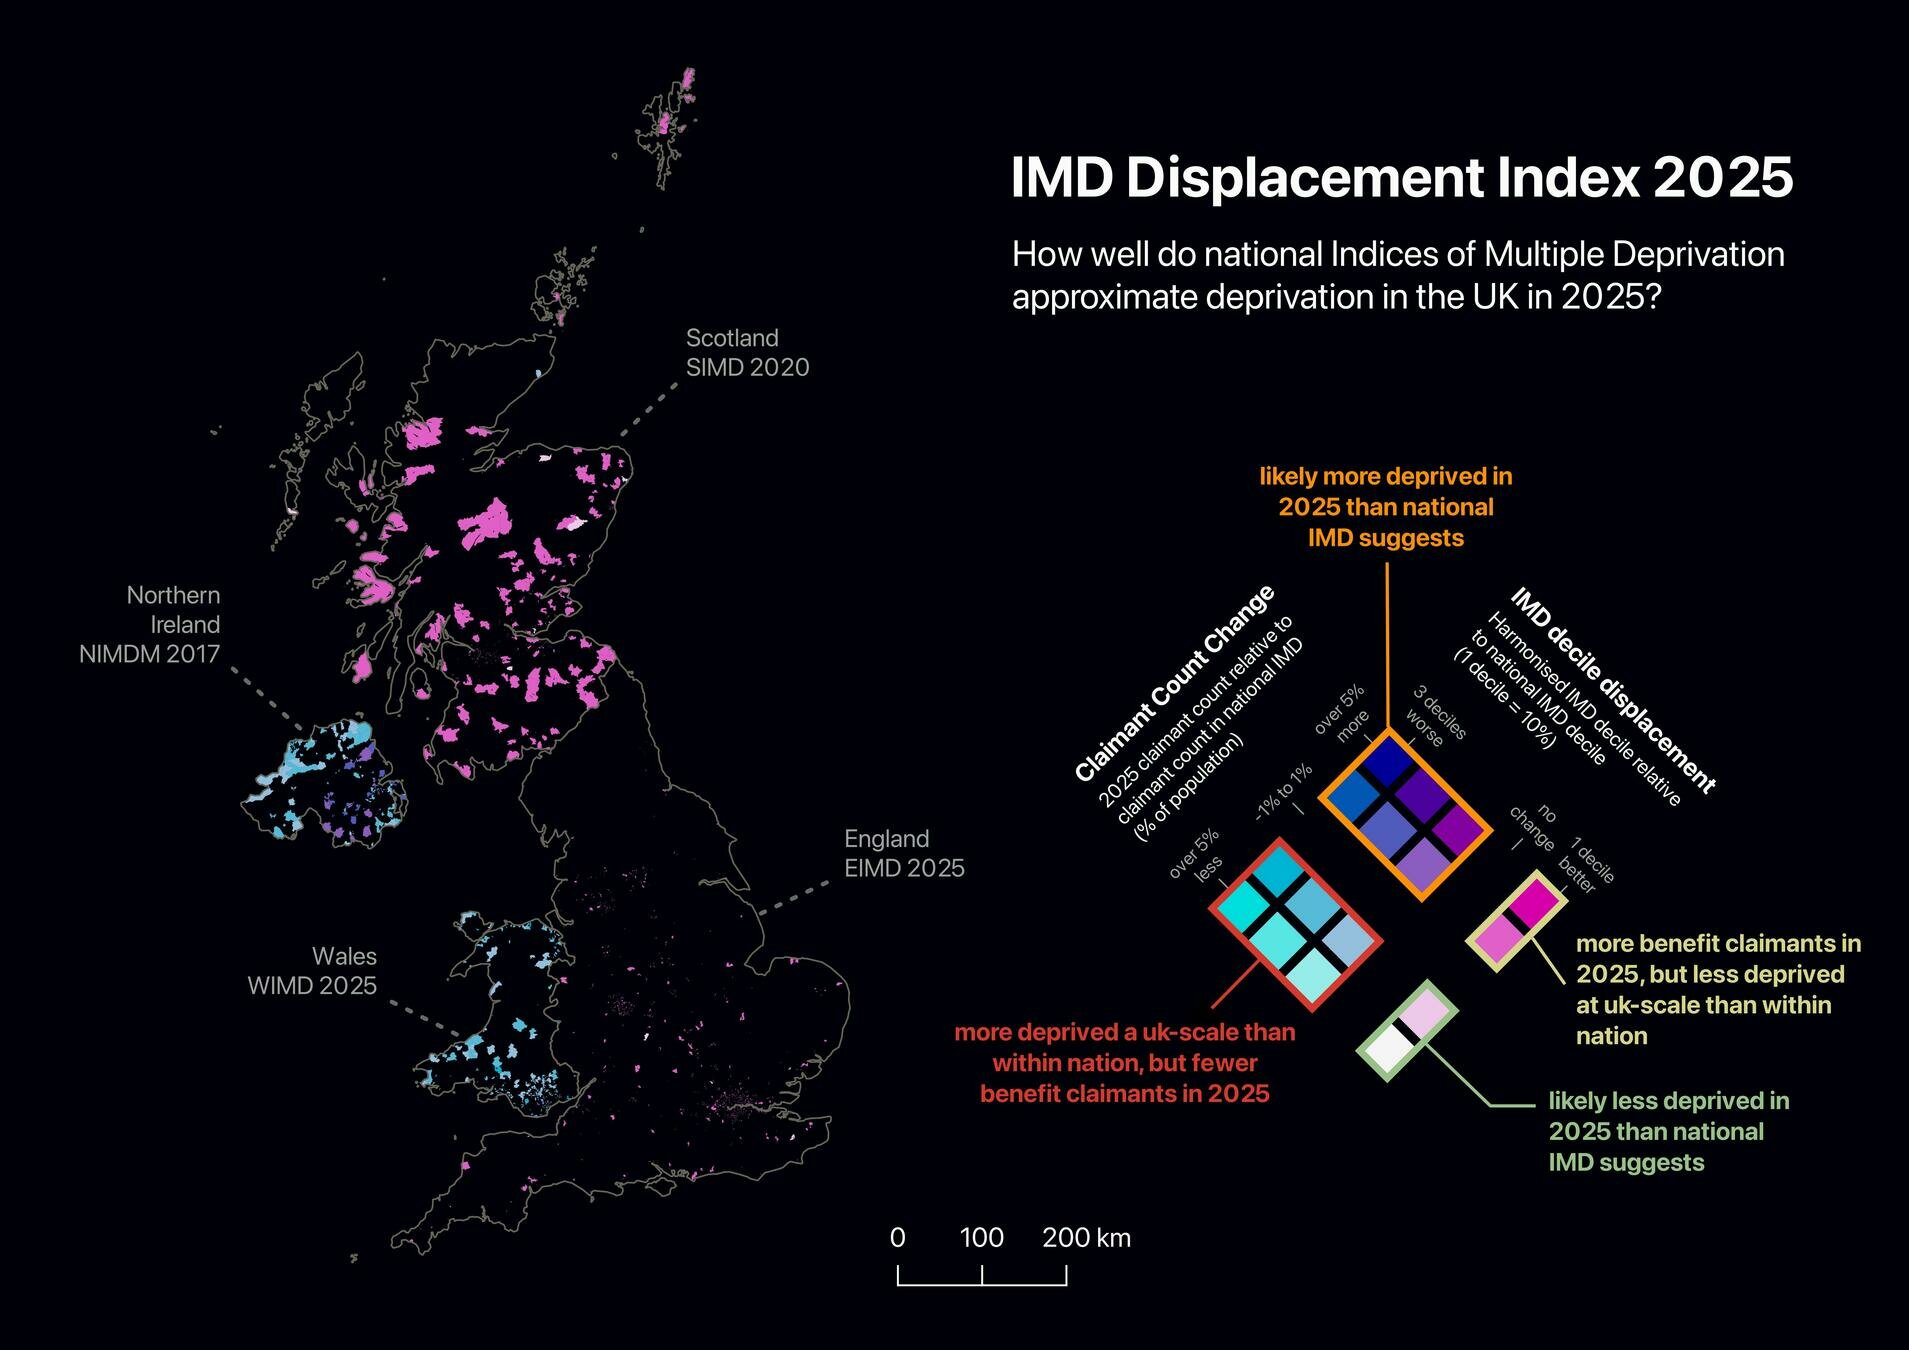
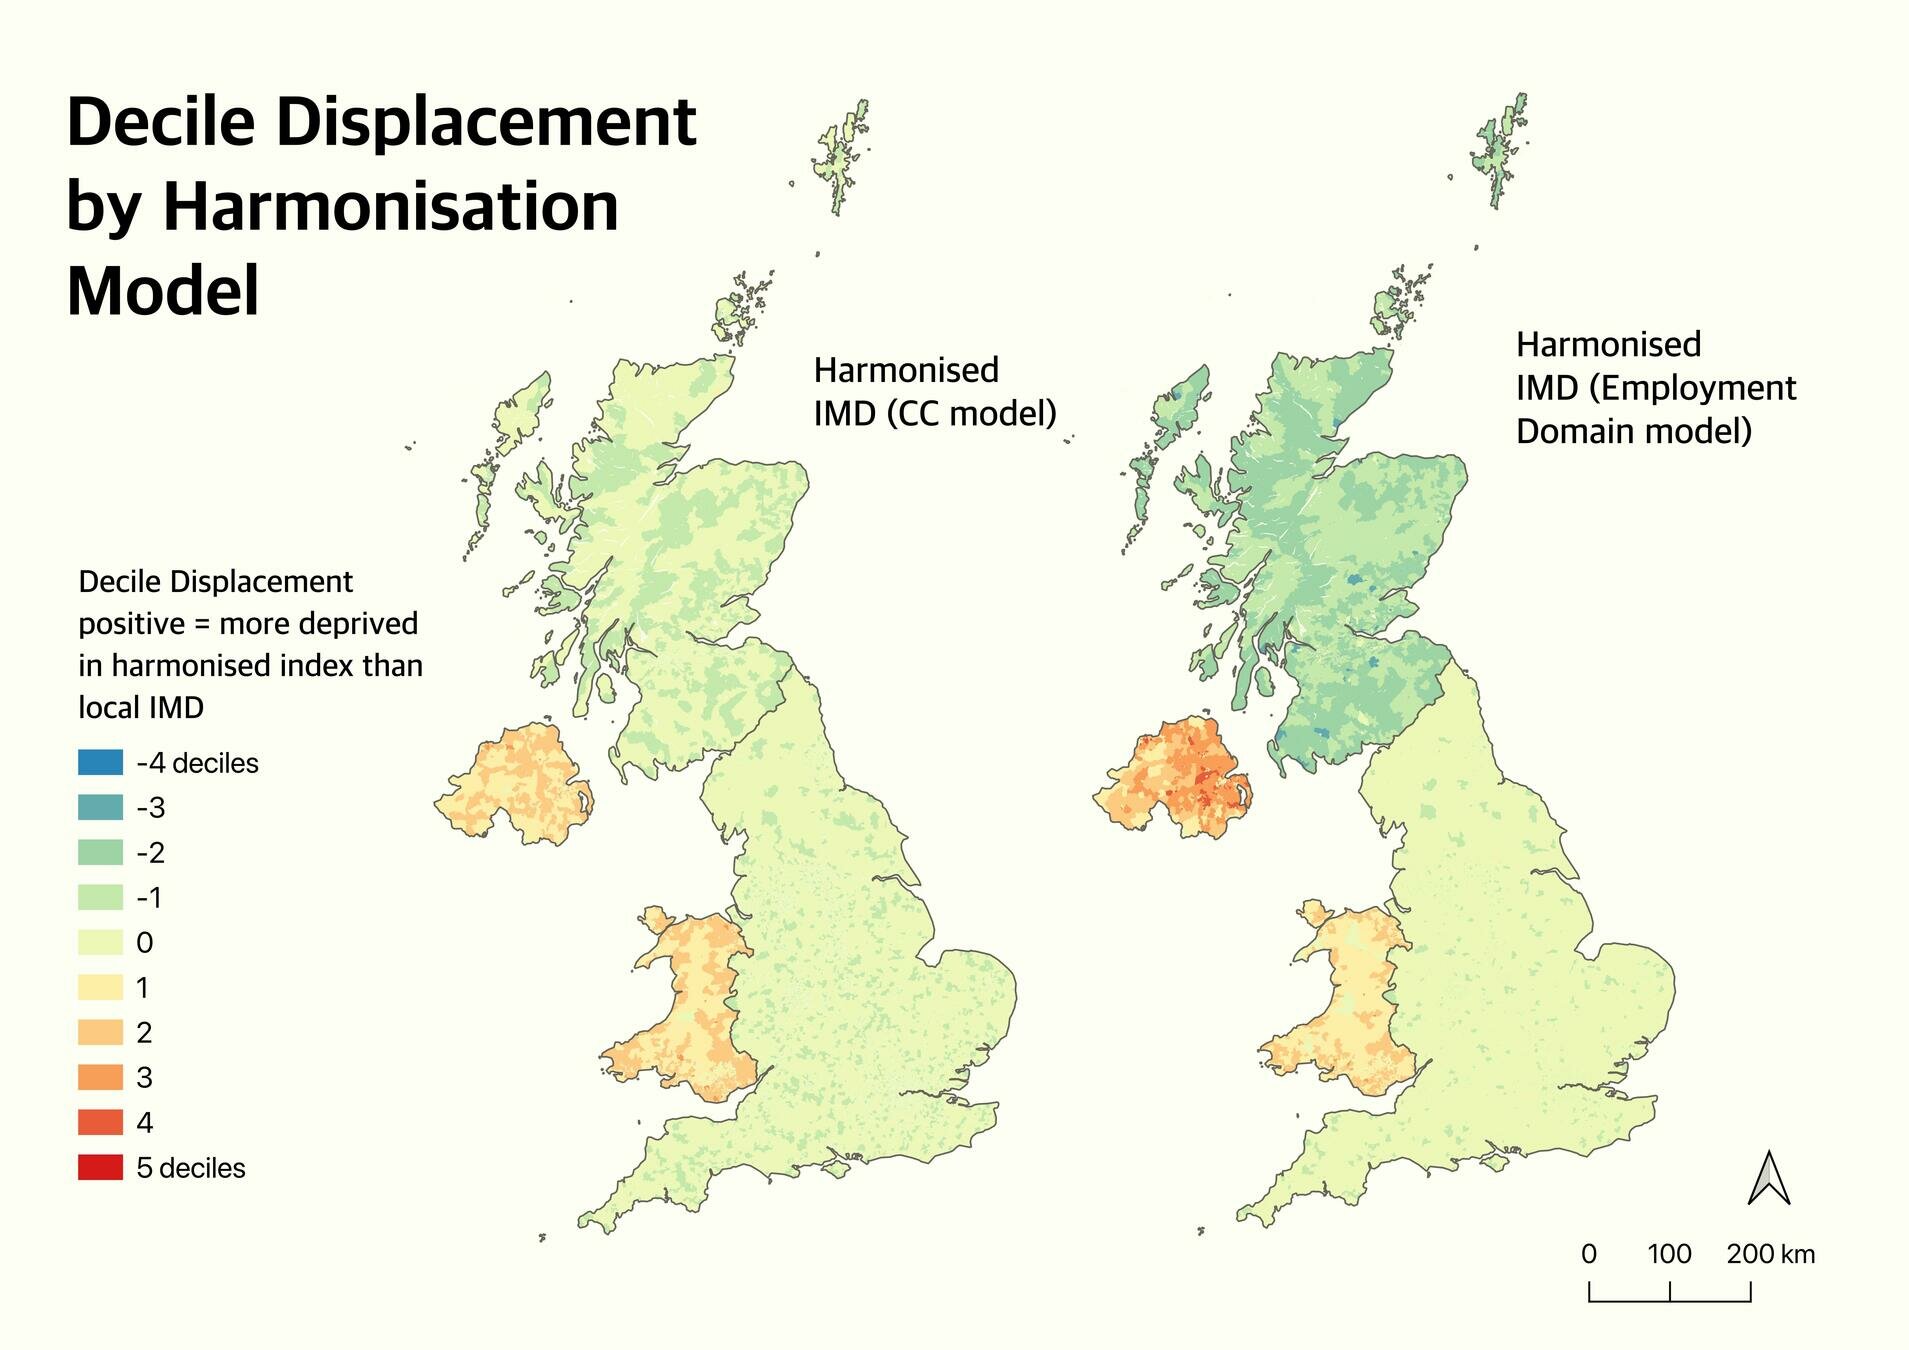
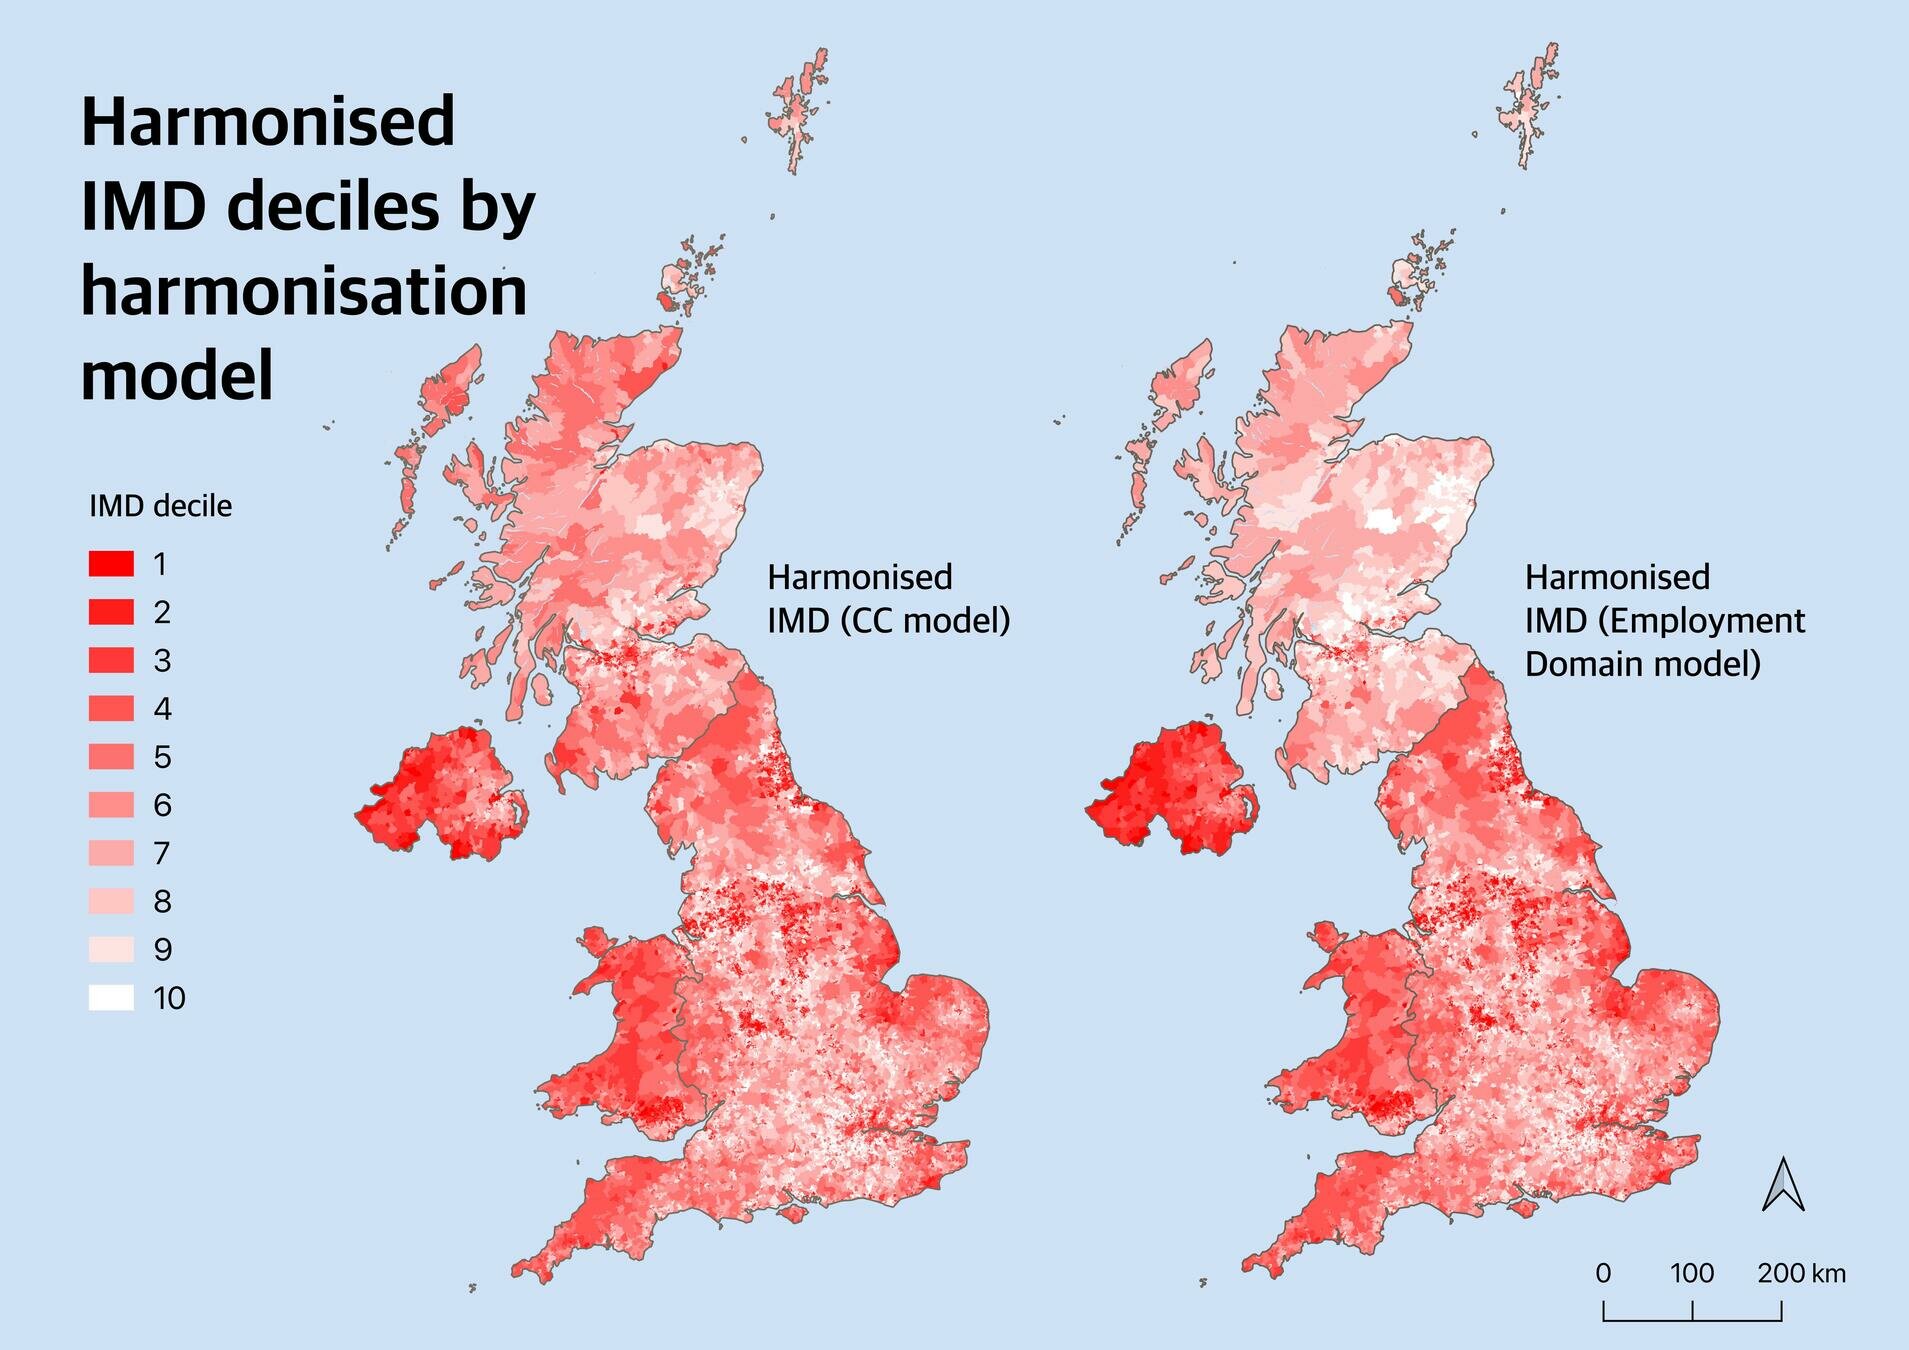
Methodology - IMD Displacement
- Modelling overall IMD scores as a function of Claimant Counts (CC)
- Standardising residuals to a reference nations' residual distribution
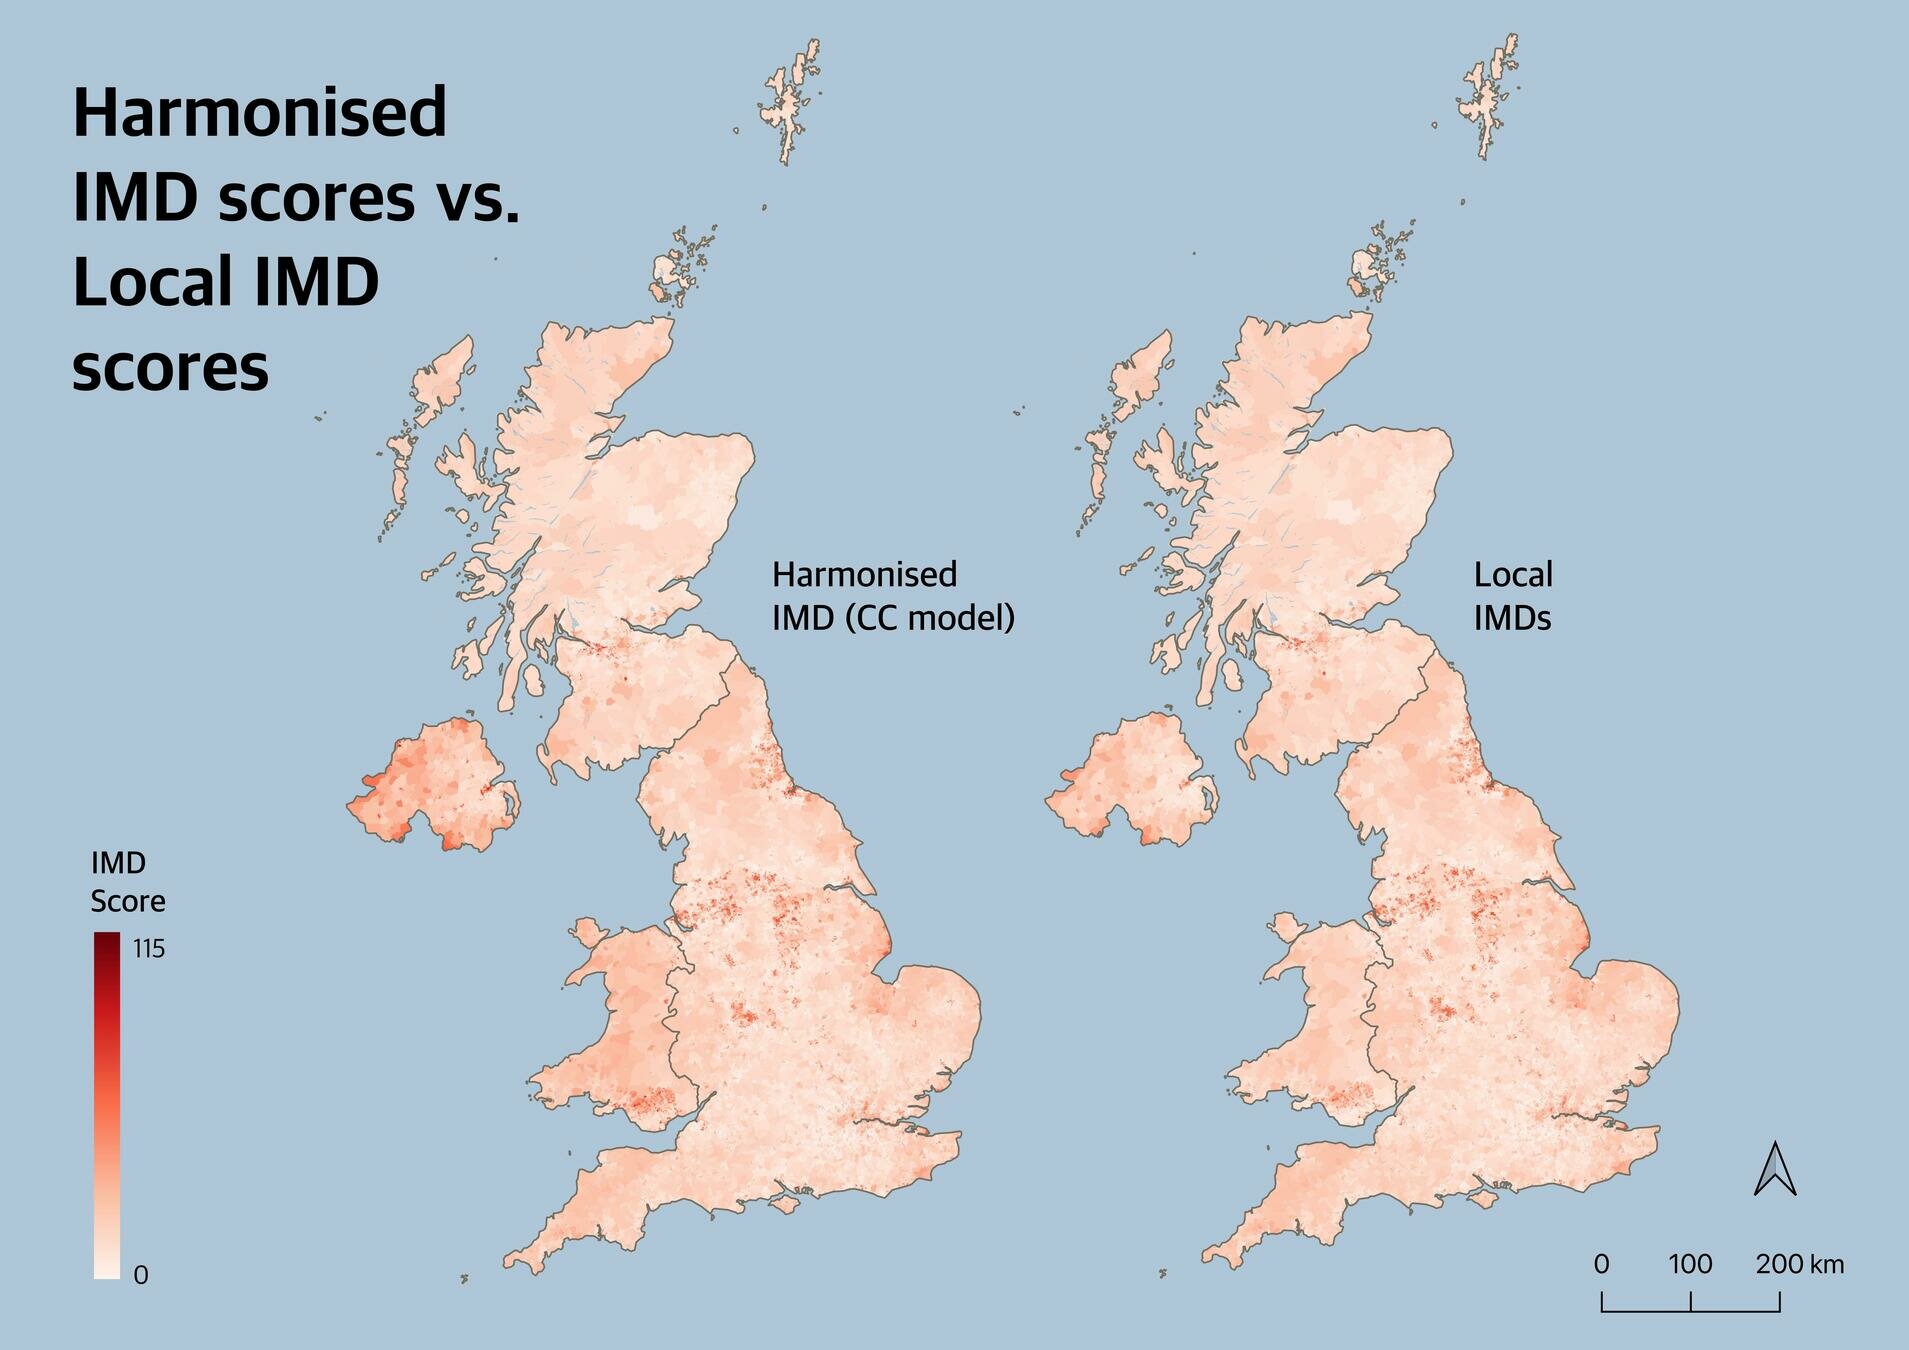
- Calculating harmonised IMD scores
- Re-ranking and dividing into UK population deciles
- Calculate rank and decile displacement
Step 1: Overall IMD score(Wales) = CC(Wales) + Residuals(Wales)
Step 2: Std.Residuals(Wales, ref=Eng) = Residuals(Wales)/Residuals(Eng)
Step 3: Harmonised overall IMD score(Wales, ref=England) =
        CC(Wales) + Std.Residuals(Wales, ref=Eng)
Harmonising WIMD with EIMD as Reference Index
Step 5: IMD rank displacement(Wales, ref=Eng) =
        IMD rank(Wales) - Harmonised IMD rank(Wales, ref=Eng)
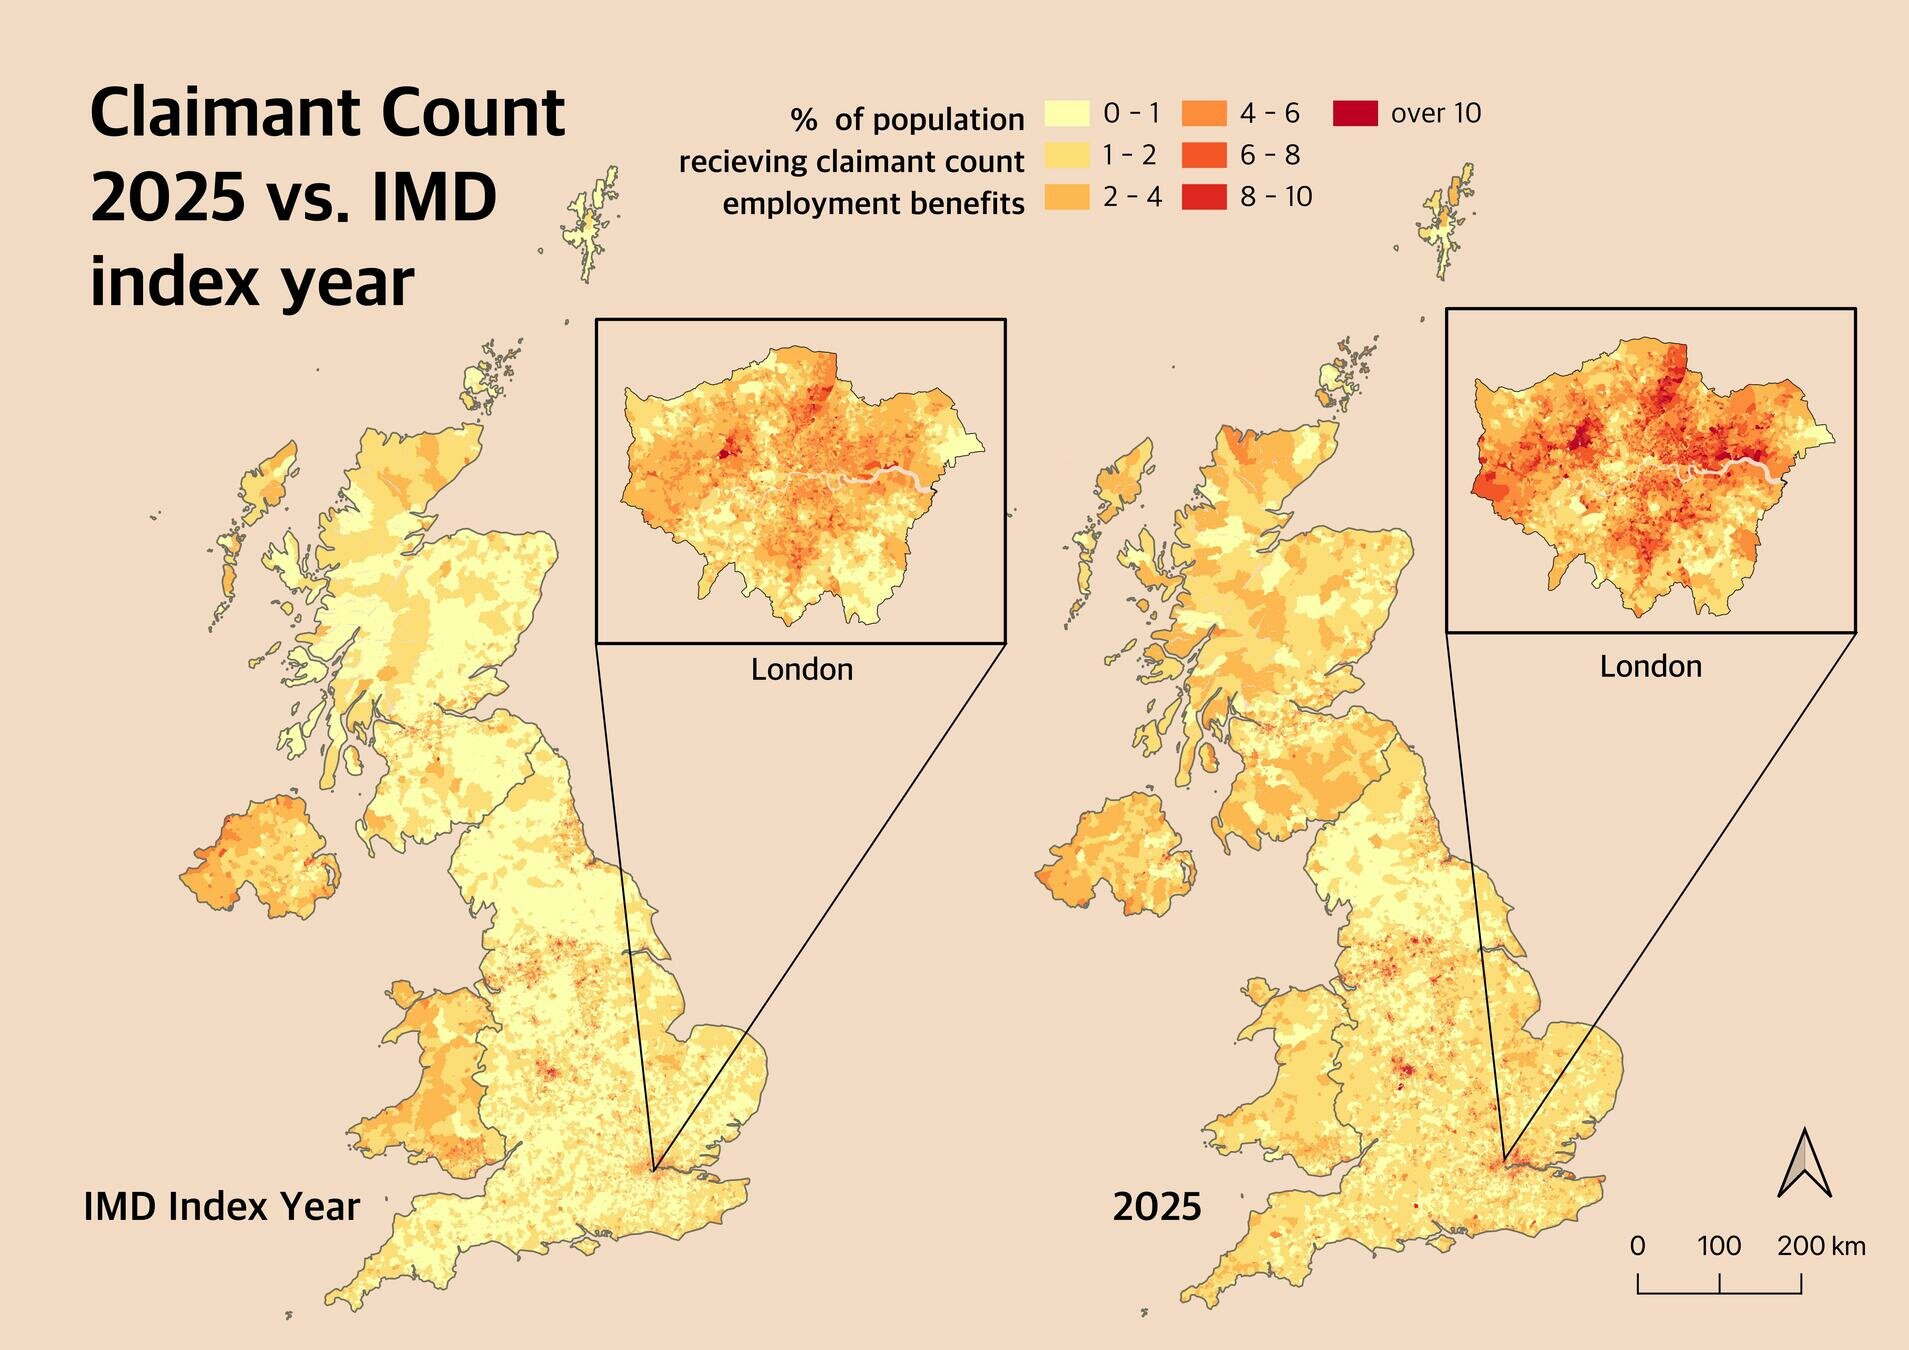
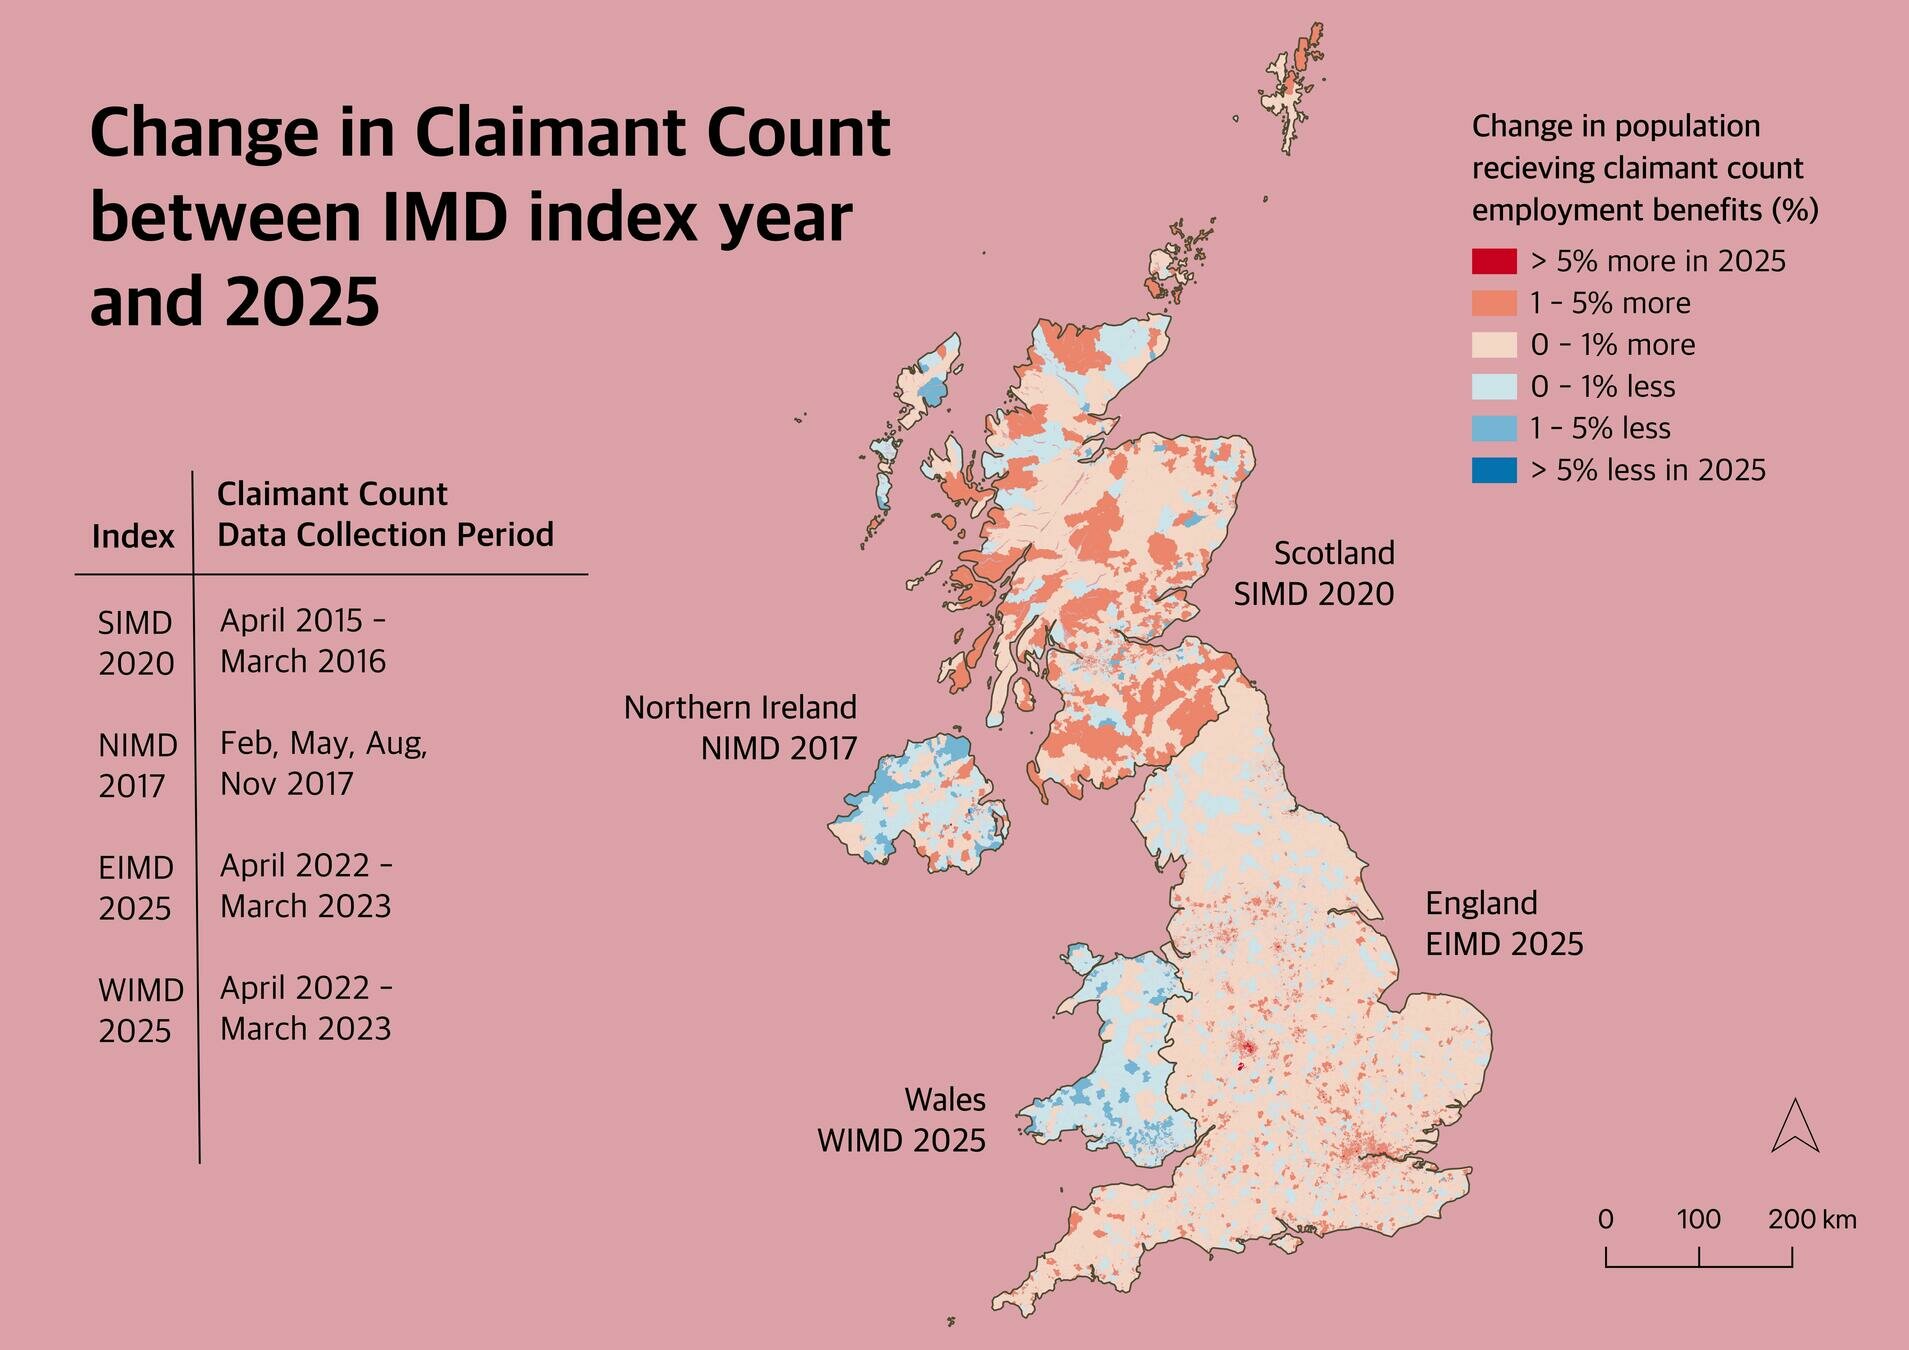
Methodology - Claimant Count Comparison
- Collect Claimant Count and population data for timeperiod in national IMD
- Collect Claimant Count and population data for 2025
- Calculate Claimant Count score
- Calculate difference in Claimant Count scores
CC score (IMD) = (Claimant Count(IMD) /Population denominator(IMD) ) *100

CC score (2025) = (Claimant Count(2025) /Population denominator(2025))  *100
CC difference = CC score(IMD) - CC score(2025)
| Index Name | Claimant Count Data Collection Timeframe (IMD) | Population Denominator (IMD) | ||
|---|---|---|---|---|
| SIMD 2020 | Feb, May, Aug, Nov 2017 | SAPE 2017 mid-year | ||
| NIMDM 2017 | April 2015 - March 2016 | SAPE mid-2016 | ||
| WIMD 2025 | Apr 2022 - Mar 2023 | SAPE mid-2022 | ||
| EIMD 2025 | Apr 2022 - Mar 2023 | SAPE mid-2022 |
| Index Name | Claimant Count Data Collection Timeframe (IMD) | Population Denominator (IMD) | ||
|---|---|---|---|---|
| SIMD 2020 | Feb, May, Aug, Nov 2017 | SAPE 2017 mid-year | ||
| NIMDM 2017 | Dec, Nov, Oct, Sep, Aug, Jul, Apr 2015 and Jan, Feb 2016 | SAPE mid-2016 | ||
| WIMD 2025 | Apr 2022 - Mar 2023 | SAPE mid-2022 | ||
| EIMD 2025 | Apr 2022 - Mar 2023 | SAPE mid-2022 |
| Index Name | Claimant Count Data Collection Timeframe (IMD) | Population Denominator (IMD) | Claimant Count Data Collection Timeframe (2025) | Population Denominator (2025) |
|---|---|---|---|---|
| SIMD 2020 | Feb, May, Aug, Nov 2017 | SAPE 2017 mid-year | Jan 2025-Dec 2025 | NRS mid-2024 |
| NIMDM 2017 | Dec, Nov, Oct, Sep, Aug, Jul, Apr 2015 and Jan, Feb 2016 | SAPE mid-2016 | Jan 2025-Dec 2025 | NISRA mid-2024 |
| WIMD 2025 | Apr 2022 - Mar 2023 | SAPE mid-2022 | Jan 2025-Dec 2025 | SAPE mid-2024 |
| EIMD 2025 | Apr 2022 - Mar 2023 | SAPE mid-2022 | Jan 2025-Dec 2025 | SAPE mid-2024 |
| IMD Decile | E (%) | N (%) | S (%) | W (%) |
|---|---|---|---|---|
| 1 | 9.36 | 19.58 | 10.83 | 14.49 |
| 2 | 9.67 | 13.8 | 9.26 | 14.97 |
| 3 | 9.79 | 14.88 | 8.7 | 13.28 |
| 4 | 9.82 | 12.29 | 7.75 | 15.87 |
| 5 | 9.94 | 10.21 | 9.24 | 12.33 |
| 6 | 10.1 | 8.75 | 9.36 | 9.92 |
| 7 | 10.18 | 7.48 | 9.85 | 8.47 |
| 8 | 10.29 | 7.52 | 9.39 | 7.24 |
| 9 | 10.4 | 4.67 | 11.41 | 3.39 |
| 10 | 10.45 | 0.84 | 14.21 | 0.04 |
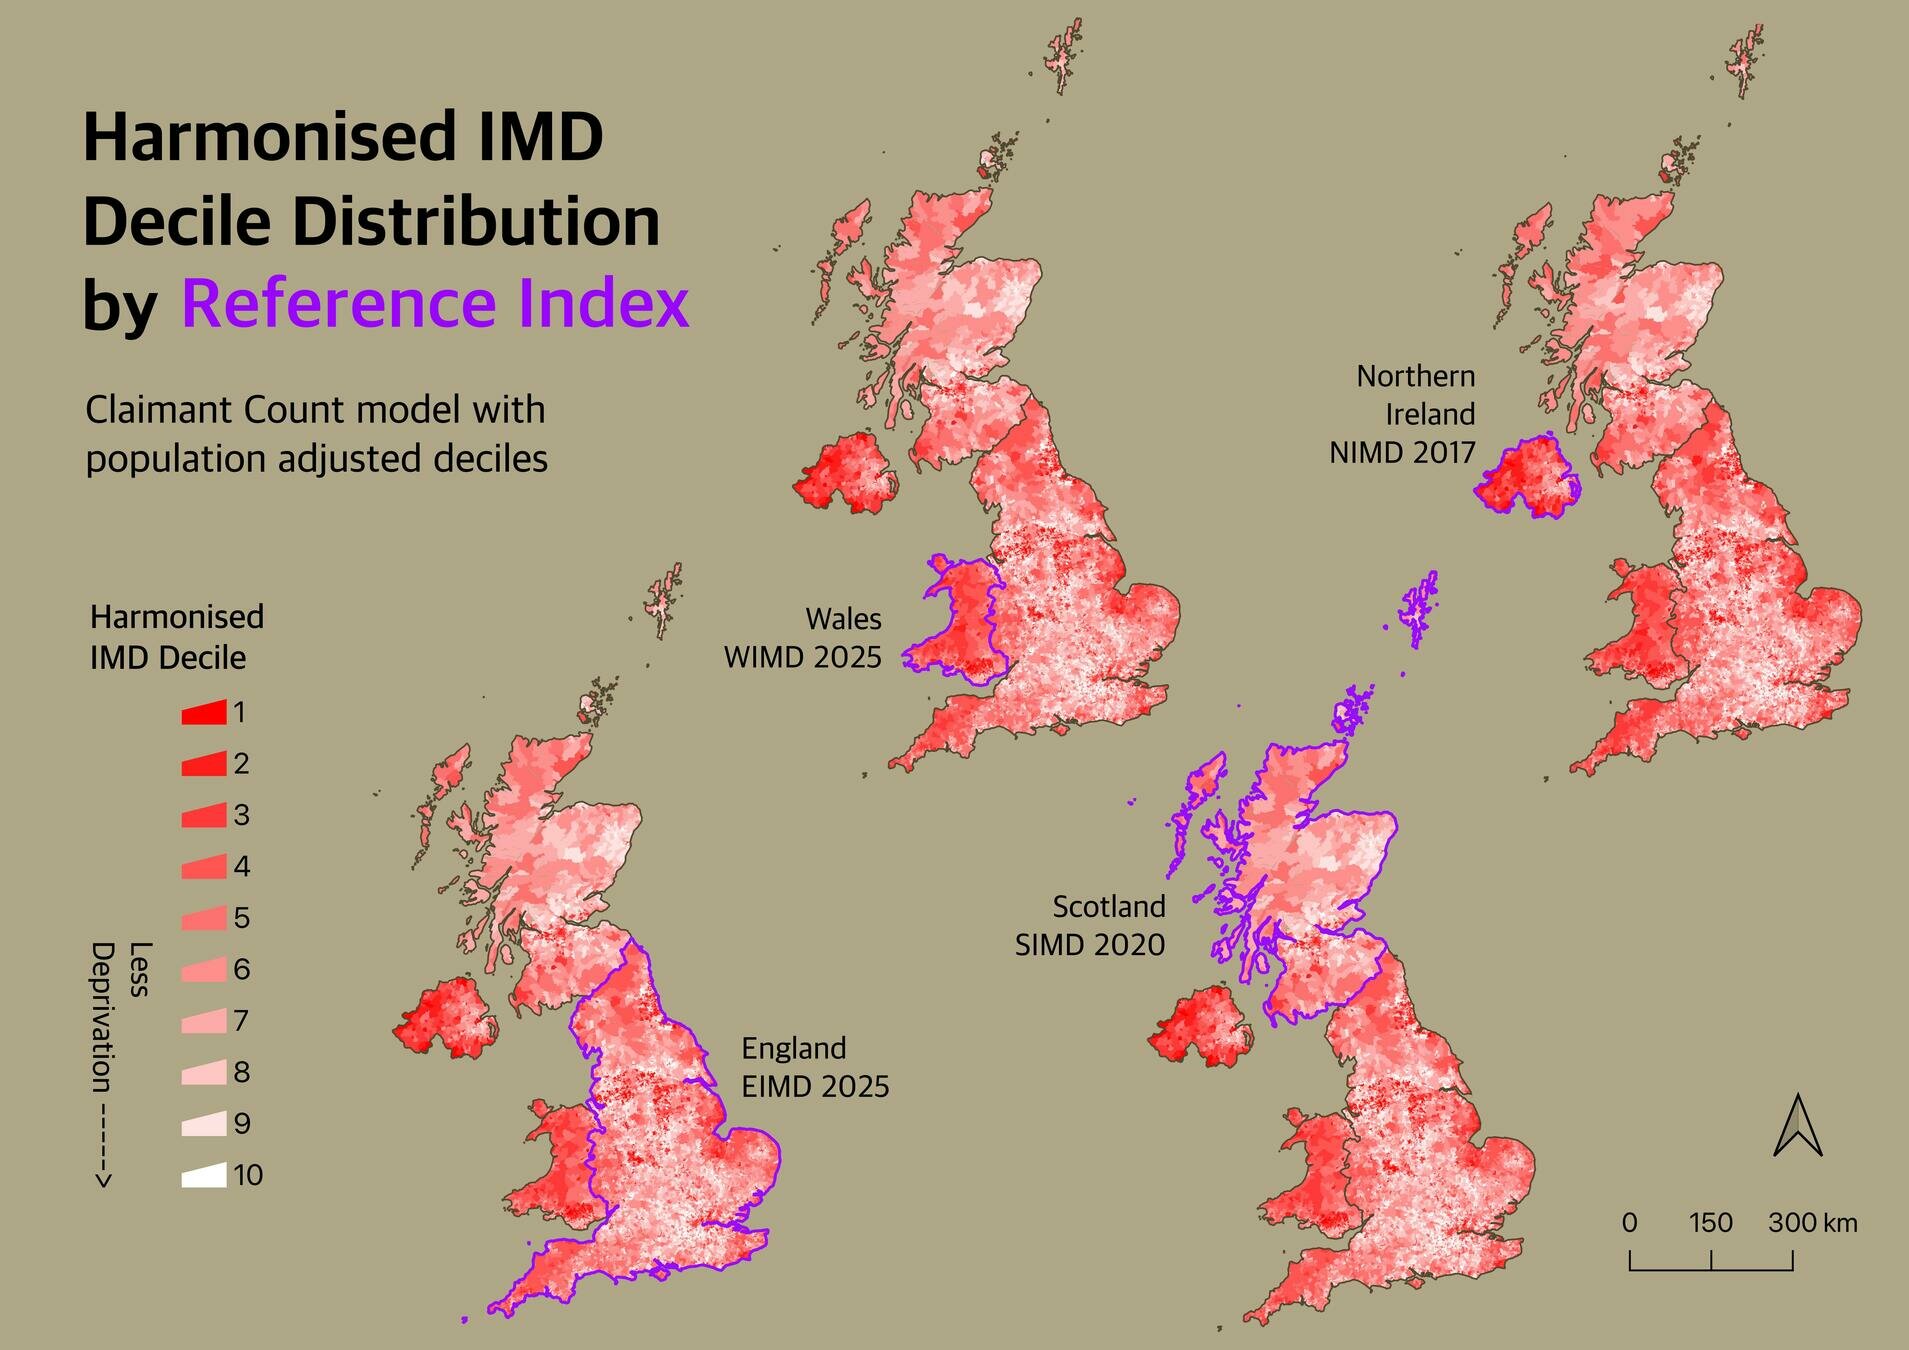
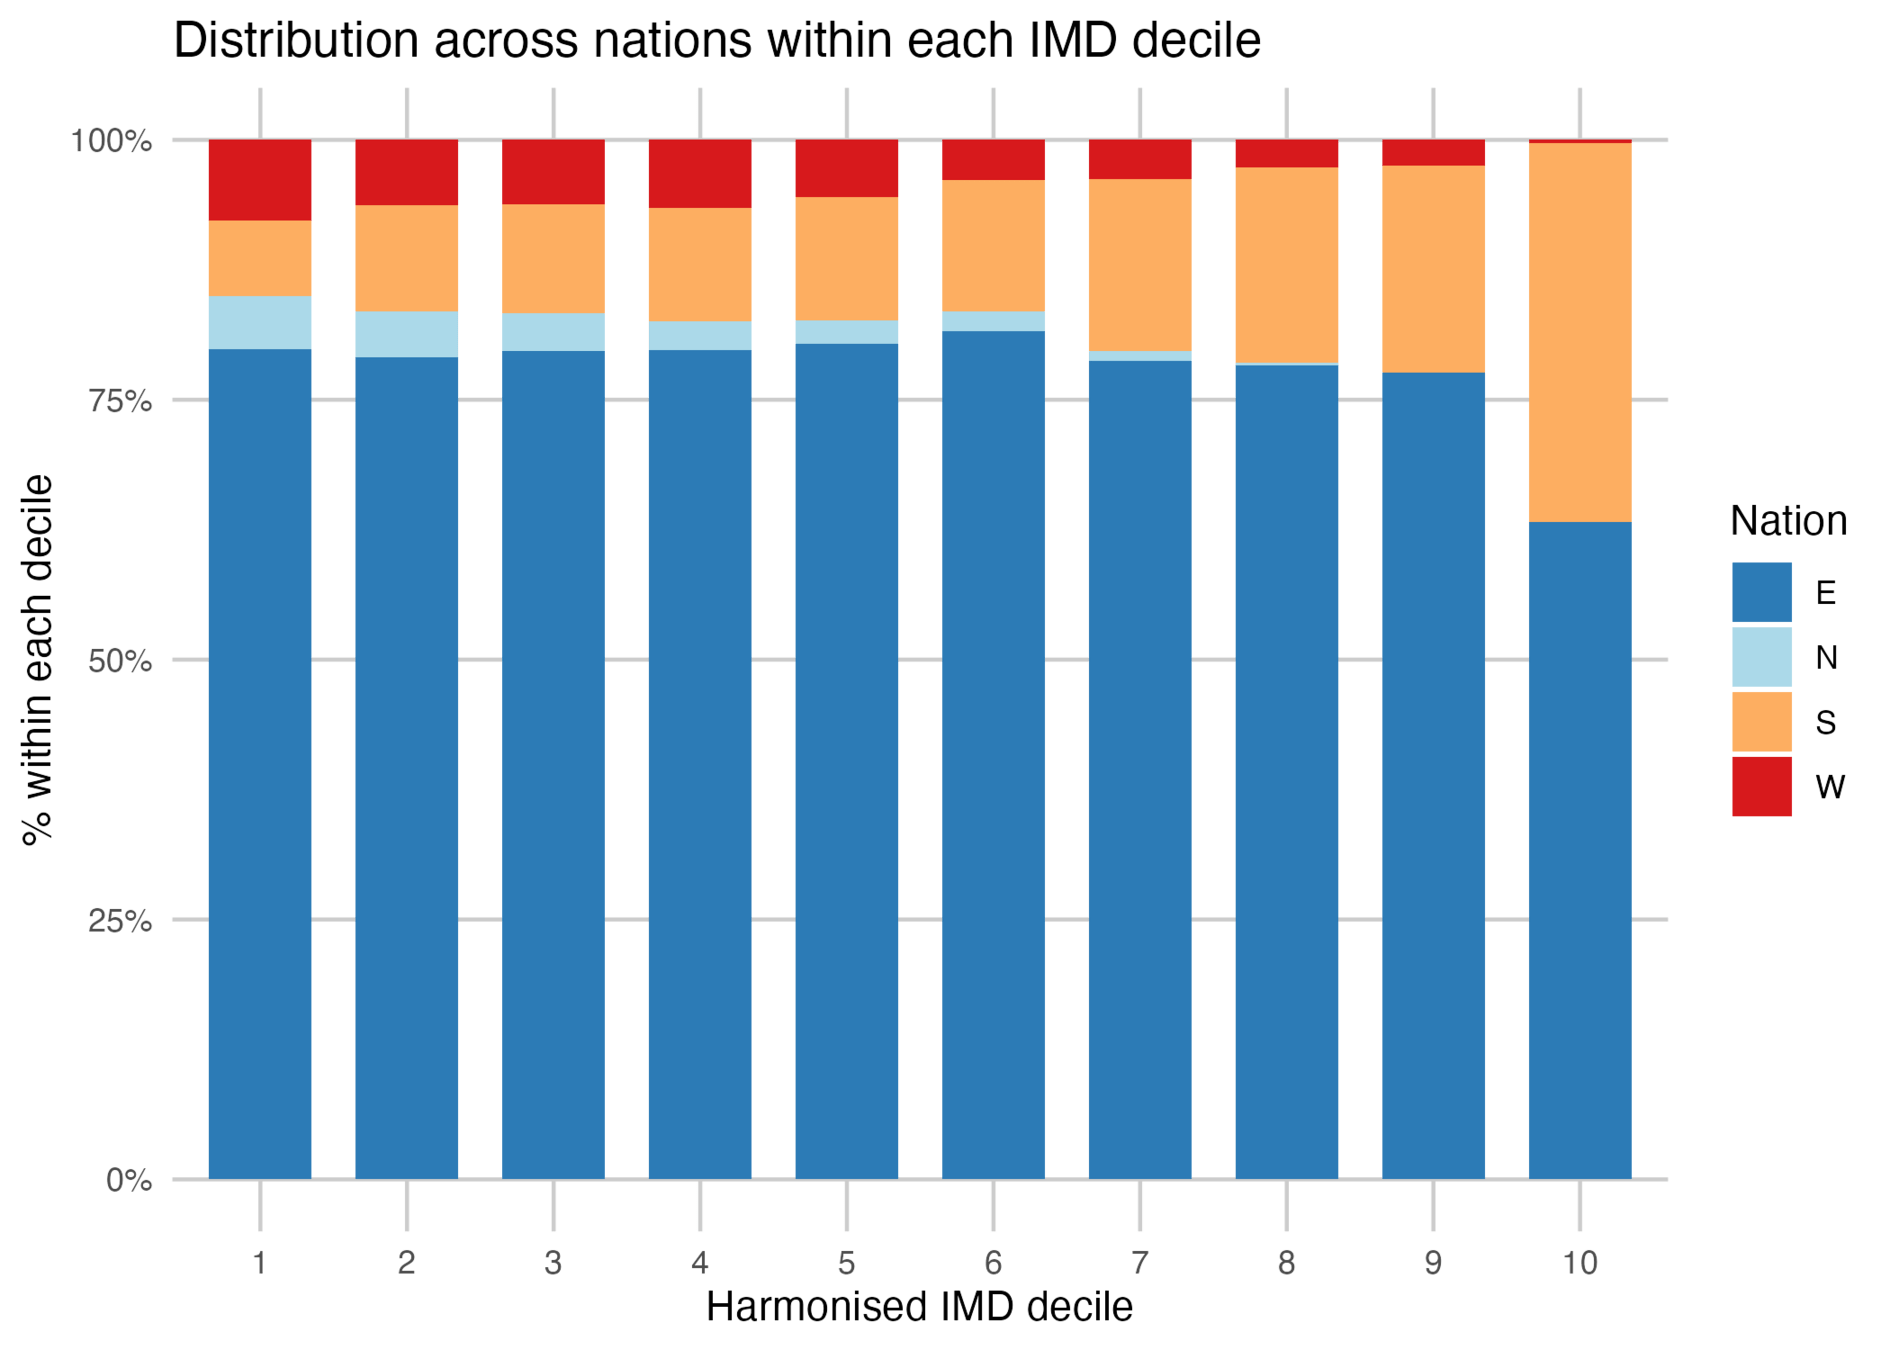
Decile Distribution Claimant Count Harmonisation Model
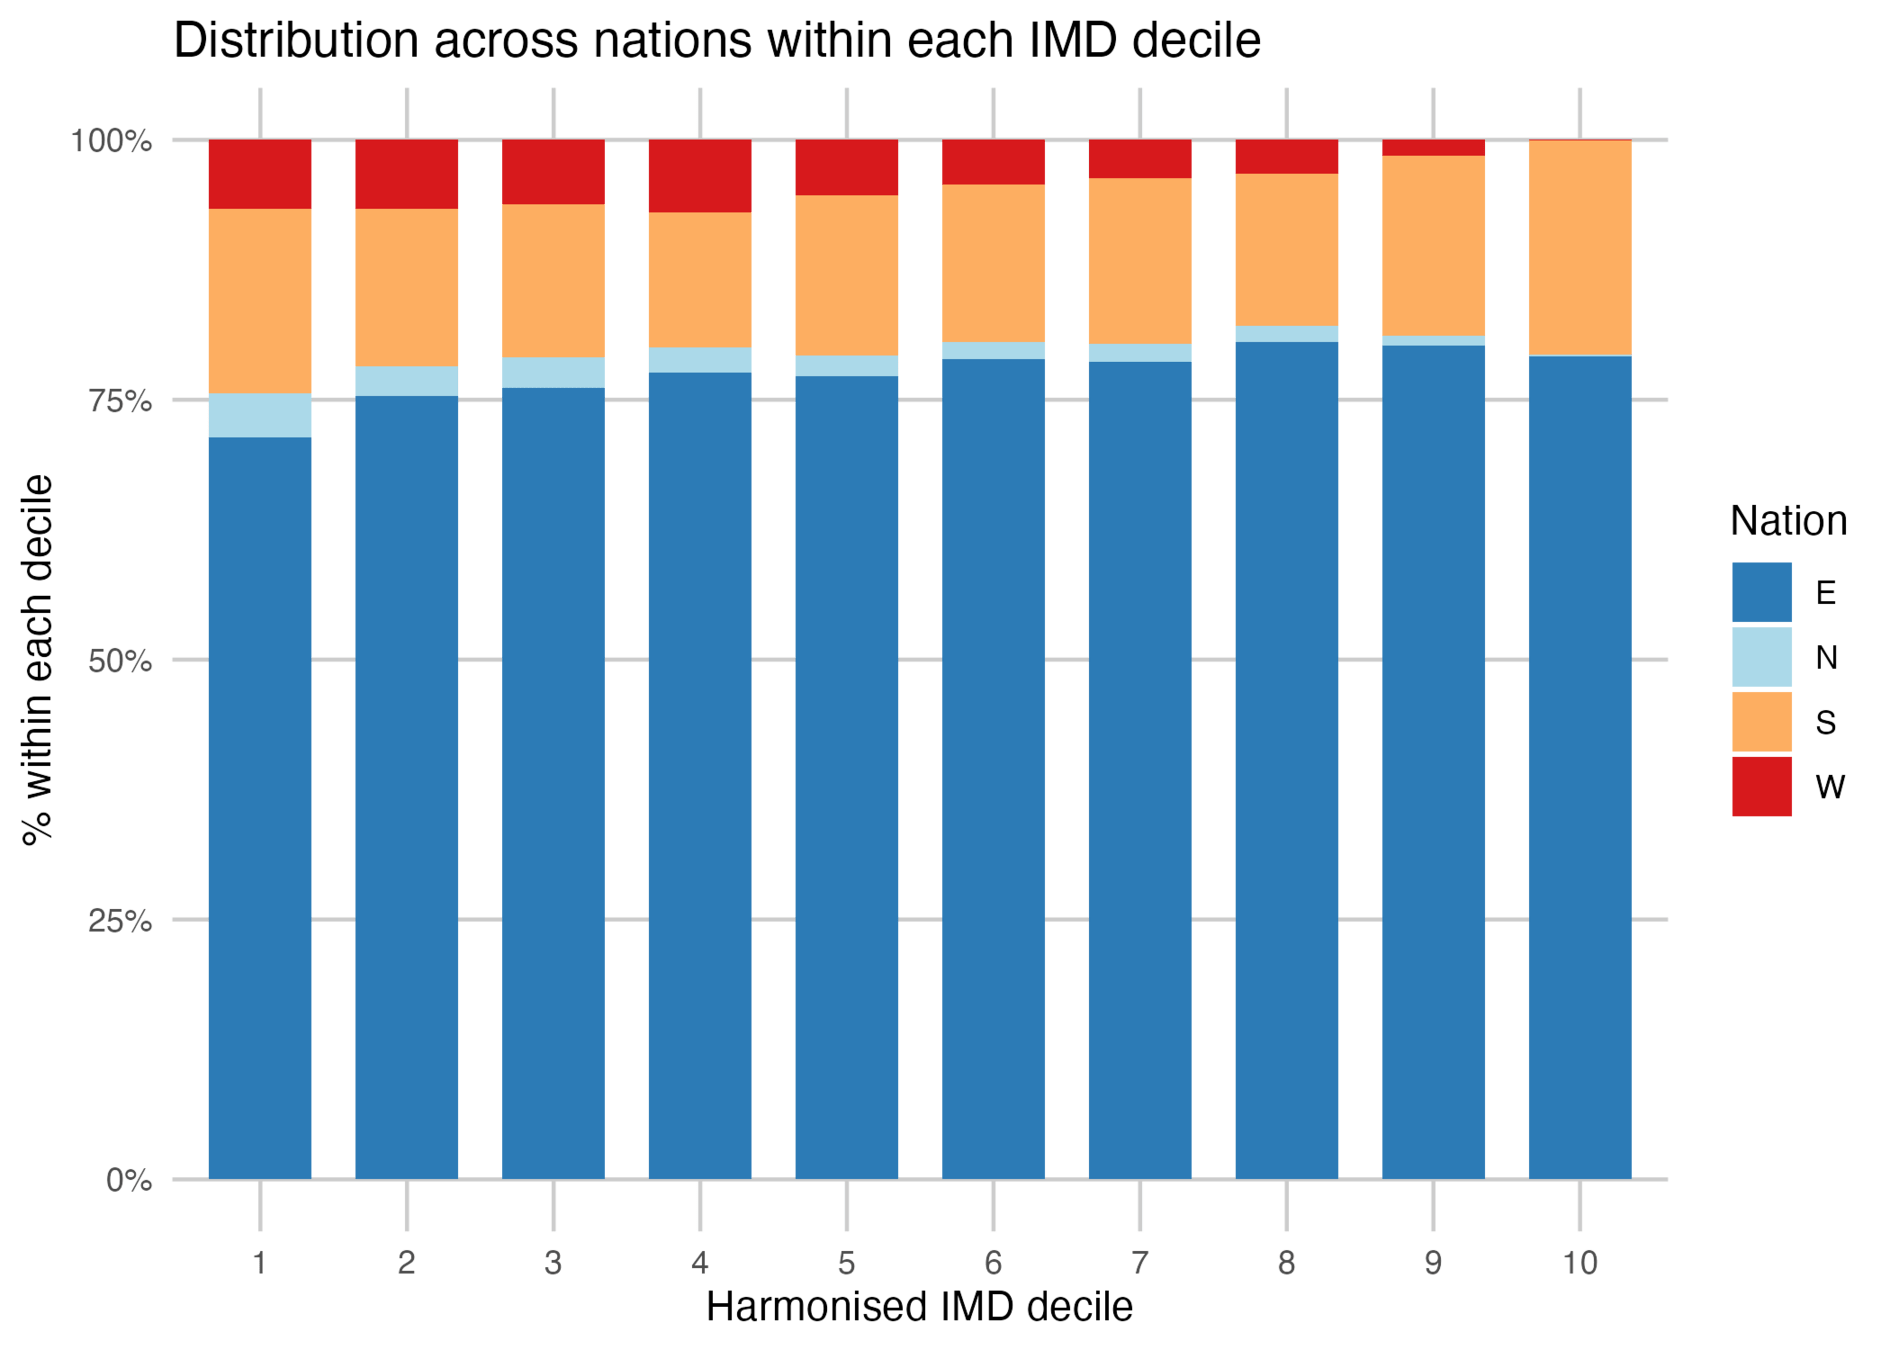
by decile
by nation
Conclusion
- There are significant differences in deprivation between UK nations which are concealed when national IMD measures are used
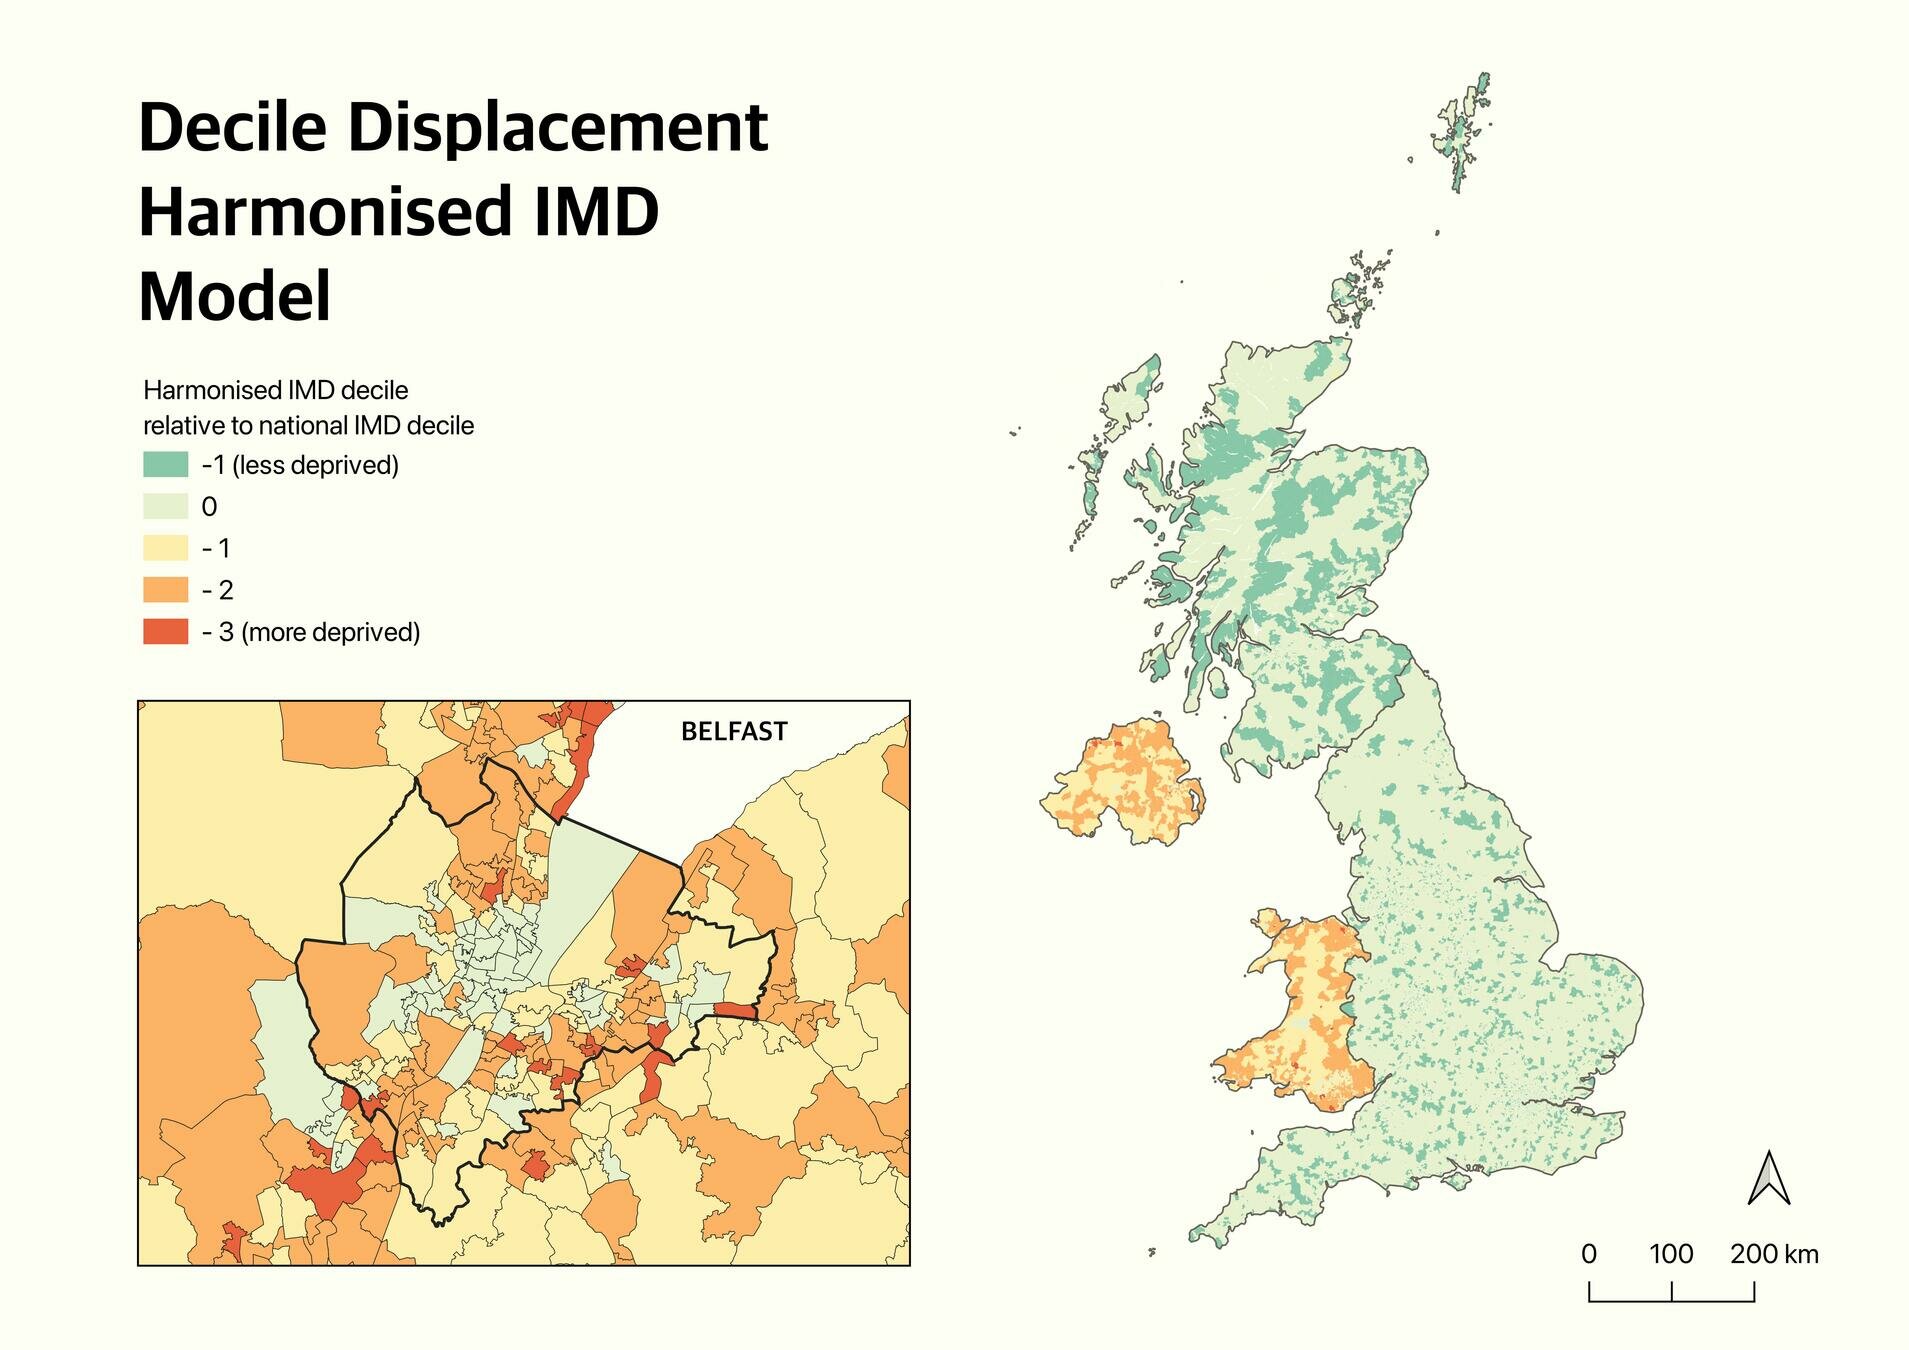
- The IMD displacement Index is an experimental approach to estimating the uncertainty of using out of date and national-scale deprivation statistics
- We need up-to-date deprivation statistics that are comparable across nations and across time-periods
- Administrative statistics like the claimant may be useful but we need to be careful with benefit-based measures of deprivation
- “Poverty is a dynamic, not a static concept” (Townsend, 1962: 219)
N
S
W
E W S
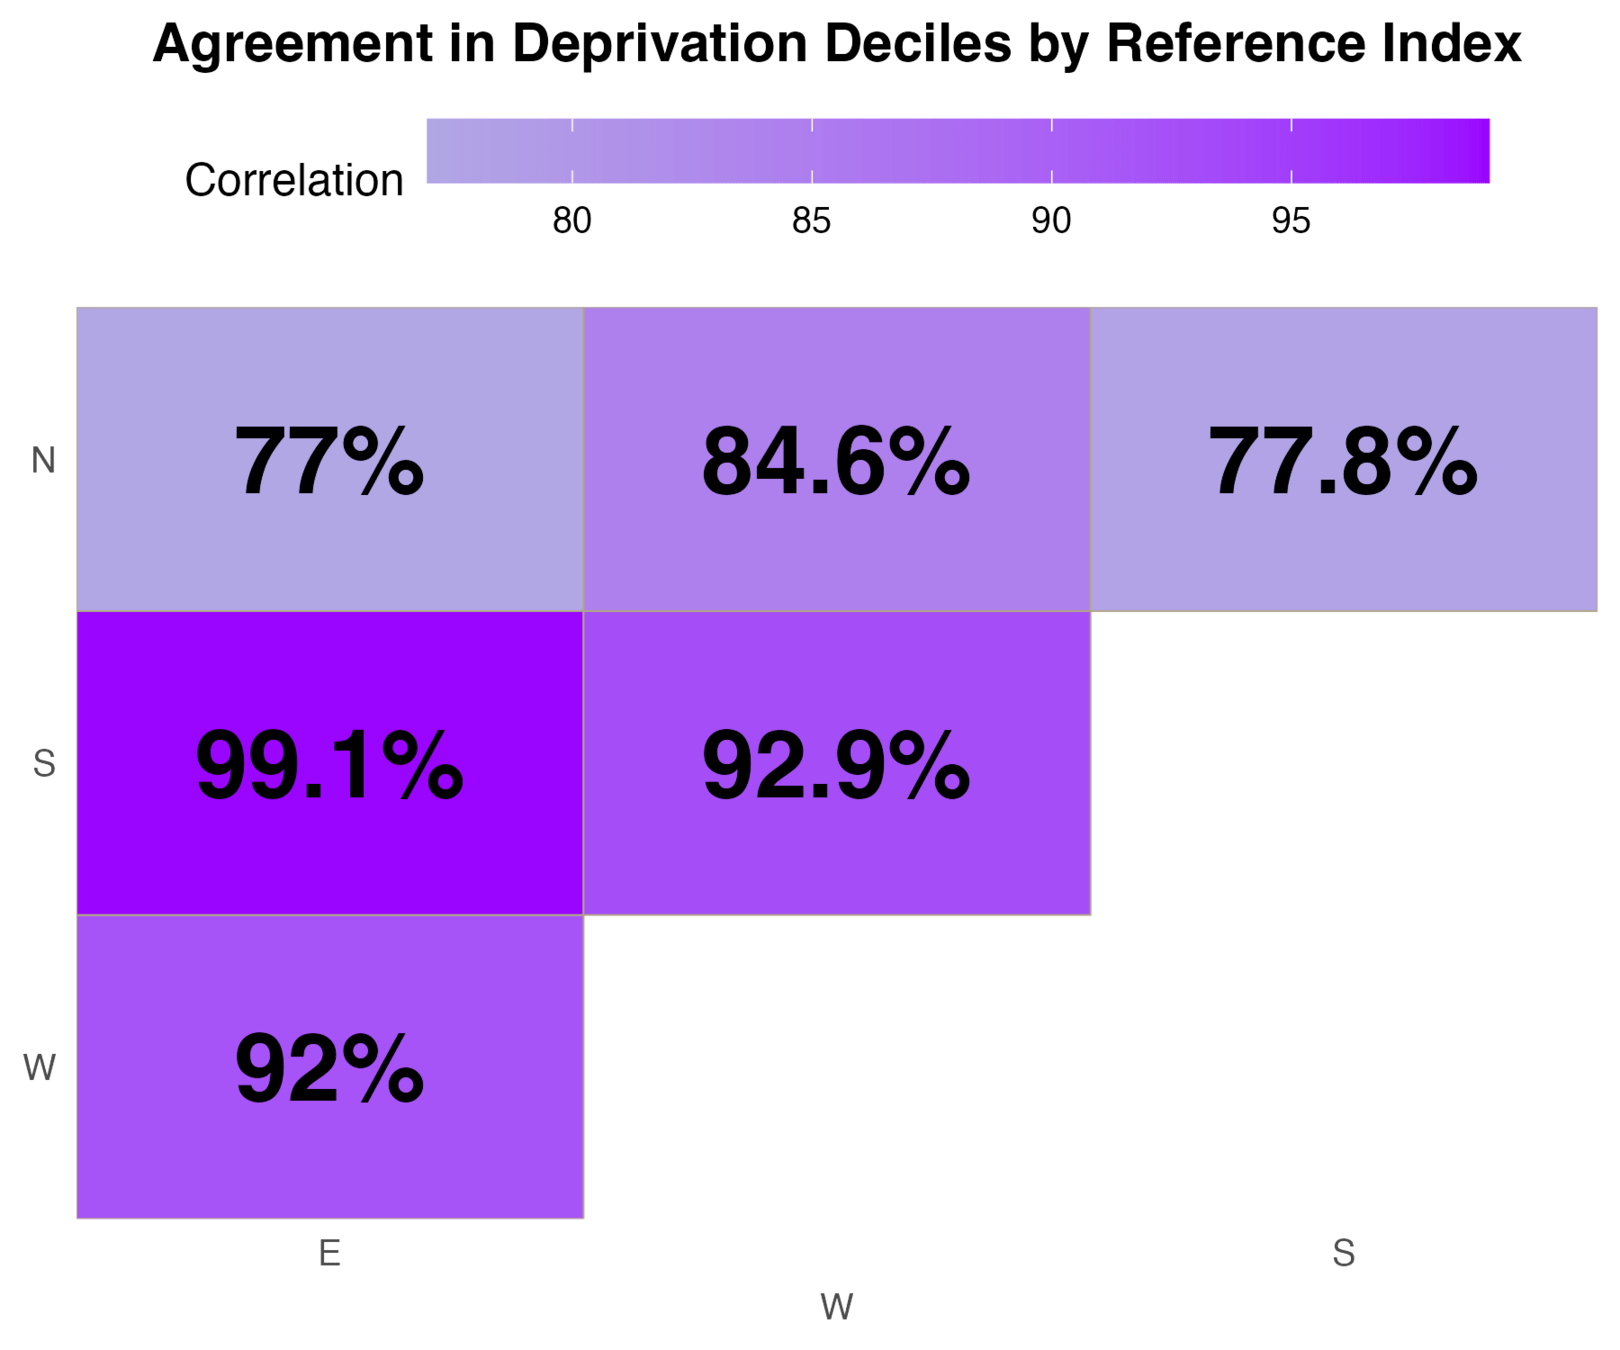
Agreement in
Decile Distribution
...affecting the allocation of local authority funding within and between UK nations
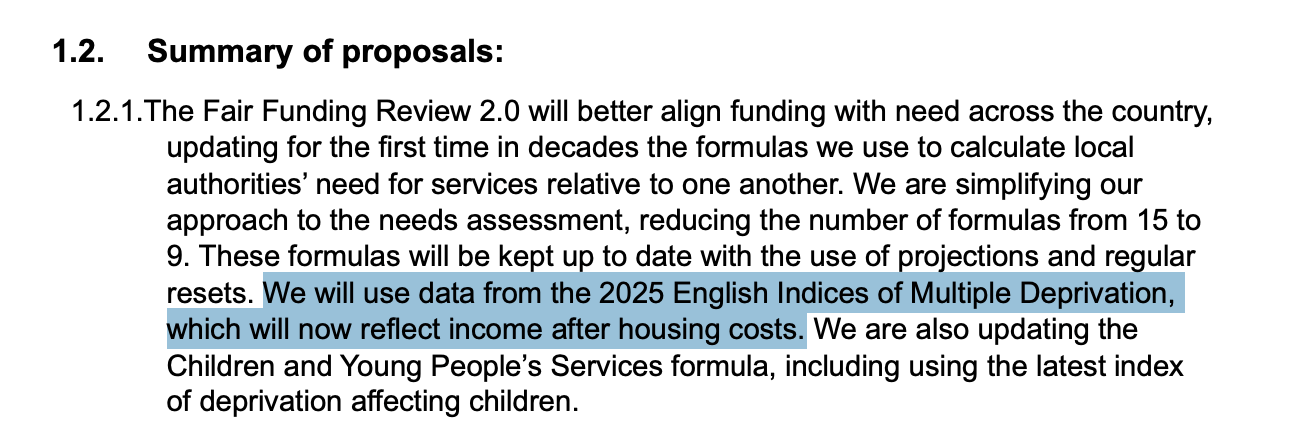

English Funding Formulas - £47 billion
UK Pride in Place Fund - £5 billion

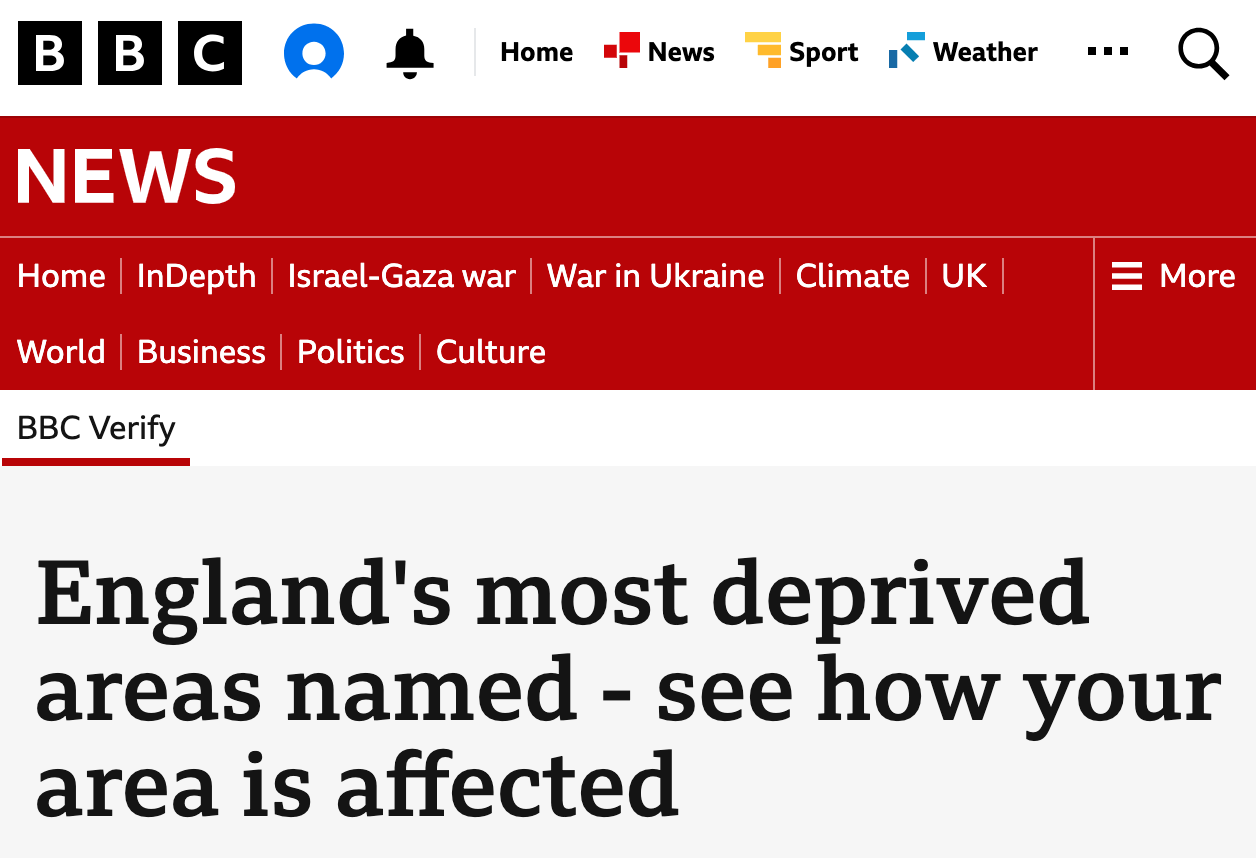
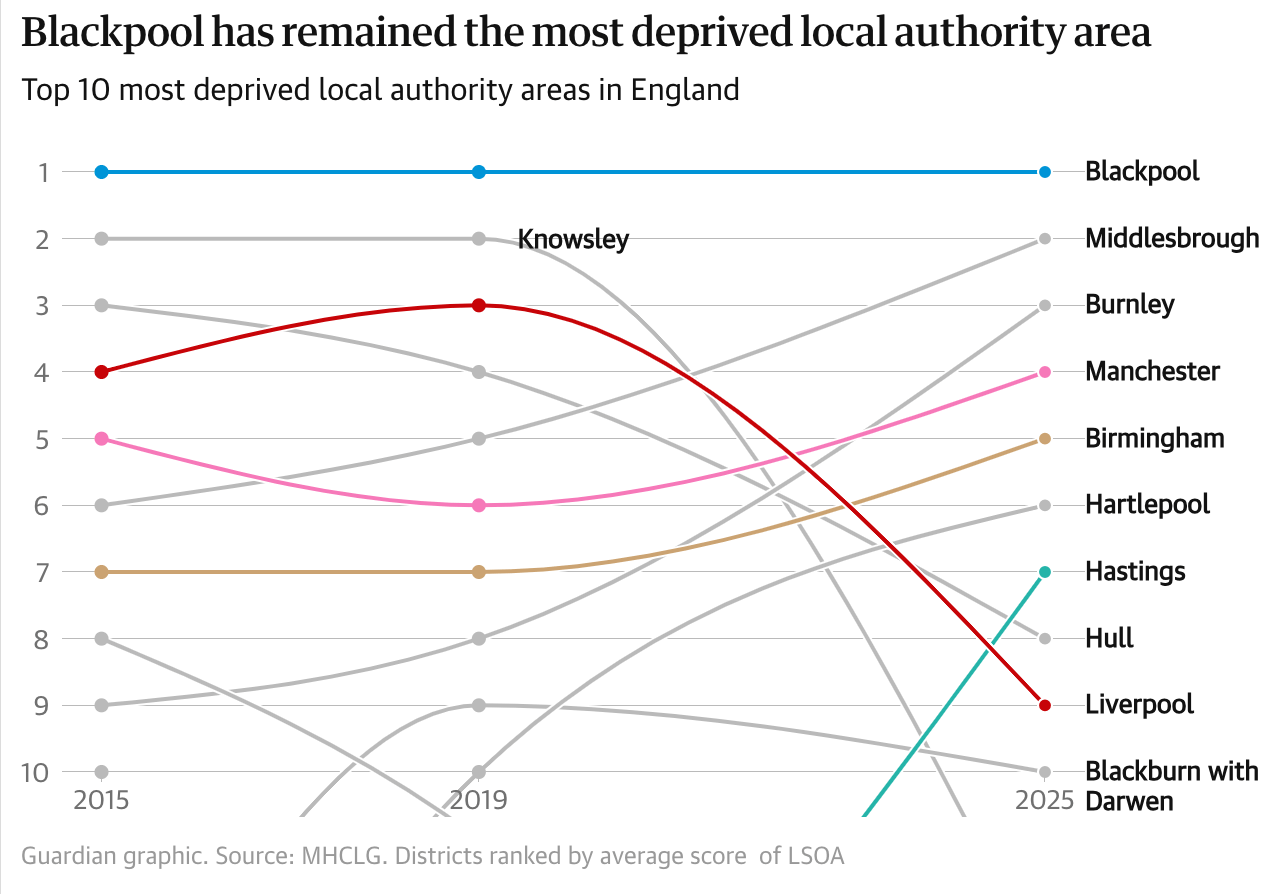
A few months ago the new IMD for England and Wales dropped....

| IMD Decile | E | N | S | W |
|---|---|---|---|---|
| 1 | 9.36 | 19.58 | 10.83 | 14.49 |
| 2 | 9.67 | 13.8 | 9.26 | 14.97 |
| 3 | 9.79 | 14.88 | 8.7 | 13.28 |
| 4 | 9.82 | 12.29 | 7.75 | 15.87 |
| 5 | 9.94 | 10.21 | 9.24 | 12.33 |
| 6 | 10.1 | 8.75 | 9.36 | 9.92 |
| 7 | 10.18 | 7.48 | 9.85 | 8.47 |
| 8 | 10.29 | 7.52 | 9.39 | 7.24 |
| 9 | 10.4 | 4.67 | 11.41 | 3.39 |
| 10 | 10.45 | 0.84 | 14.21 | 0.04 |
| IMD Decile | E | N | S | W |
|---|---|---|---|---|
| 1 | 9.84 | 22.12 | 4.07 | 15.99 |
| 2 | 9.82 | 21.05 | 6 | 13.68 |
| 3 | 9.95 | 17.69 | 6.16 | 12.97 |
| 4 | 9.97 | 13.63 | 6.36 | 14.69 |
| 5 | 10.12 | 10.91 | 7.04 | 12.45 |
| 6 | 10.33 | 8.89 | 7.56 | 8.88 |
| 7 | 10.25 | 4.32 | 10.1 | 8.61 |
| 8 | 10.29 | 1.29 | 12.07 | 6.25 |
| 9 | 10.25 | 0.1 | 13.26 | 5.7 |
| 10 | 9.18 | 0 | 27.38 | 0.79 |
Decile Distribution Claimant Count Harmonisation Model
IMD Decile
Decile Distribution Employment Domain Harmonisation Model
Percentage (%)
| IMD Decile | E (%) | N (%) | S (%) | W (%) |
|---|---|---|---|---|
| 1 | 9.36 | 19.58 | 10.83 | 14.49 |
| 2 | 9.67 | 13.8 | 9.26 | 14.97 |
| 3 | 9.79 | 14.88 | 8.7 | 13.28 |
| 4 | 9.82 | 12.29 | 7.75 | 15.87 |
| 5 | 9.94 | 10.21 | 9.24 | 12.33 |
| 6 | 10.1 | 8.75 | 9.36 | 9.92 |
| 7 | 10.18 | 7.48 | 9.85 | 8.47 |
| 8 | 10.29 | 7.52 | 9.39 | 7.24 |
| 9 | 10.4 | 4.67 | 11.41 | 3.39 |
| 10 | 10.45 | 0.84 | 14.21 | 0.04 |
Decile Distribution Claimant Count Harmonisation Model
by decile
by nation
| IMD Decile | E (%) | N (%) | S (%) | W (%) |
|---|---|---|---|---|
| 1 | 9.36 | 19.58 | 10.83 | 14.49 |
| 2 | 9.67 | 13.8 | 9.26 | 14.97 |
| 3 | 9.79 | 14.88 | 8.7 | 13.28 |
| 4 | 9.82 | 12.29 | 7.75 | 15.87 |
| 5 | 9.94 | 10.21 | 9.24 | 12.33 |
| 6 | 10.1 | 8.75 | 9.36 | 9.92 |
| 7 | 10.18 | 7.48 | 9.85 | 8.47 |
| 8 | 10.29 | 7.52 | 9.39 | 7.24 |
| 9 | 10.4 | 4.67 | 11.41 | 3.39 |
| 10 | 10.45 | 0.84 | 14.21 | 0.04 |
| IMD Decile | E (%) | N (%) | S (%) | W (%) |
|---|---|---|---|---|
| 1 | 9.84 | 22.12 | 4.07 | 15.99 |
| 2 | 9.82 | 21.05 | 6 | 13.68 |
| 3 | 9.95 | 17.69 | 6.16 | 12.97 |
| 4 | 9.97 | 13.63 | 6.36 | 14.69 |
| 5 | 10.12 | 10.91 | 7.04 | 12.45 |
| 6 | 10.33 | 8.89 | 7.56 | 8.88 |
| 7 | 10.25 | 4.32 | 10.1 | 8.61 |
| 8 | 10.29 | 1.29 | 12.07 | 6.25 |
| 9 | 10.25 | 0.1 | 13.26 | 5.7 |
| 10 | 9.18 | 0 | 27.38 | 0.79 |
Decile Distribution Claimant Count Harmonisation Model
Decile Distribution Employment Domain Harmonisation Model
by decile
by nation
| NIMDM 2017 | SIMD 2020 | WIMD 2025 | EIMD 2025 | |
|---|---|---|---|---|
| Job Seeker’s Allowance | yes | yes | yes | yes |
| New Style Jobseeker’s Allowance | yes | yes | yes | yes |
| Universal Credit (UC) in ’out of work’ categories | yes | yes | yes | yes |
| Income Support | ----- | ----- | yes | yes |
| Incapacity Benefit | yes | yes | yes | yes |
| Severe Disablement Allowance | yes | yes | yes | yes |
| Employment and Support Allowance | yes | yes | yes | yes |
| New Style Employment and Support Allowance | yes | yes | yes | yes |
| Carer’s Allowance | yes | ----- | yes | yes |
| People who do not receive benefits or income from employment | yes | ----- | ----- | ----- |
CHANGING THIS TO ONLY NATIONAL AND CC HARMONISED
-
High relative contributions to overall IMD scores, 20-28% across nations
-
Scores reflect what proportion of a population are 'employment deprived'
-
In most cases, the underlying indicator is a count of the number of people claiming a range of employment related benefits
-
(Note: Confusingly, the Welsh 'employment domain score' is rescaled from 0-100)
Employment Domain Comparisson

- Every nation in the UK uses a different IMD measure and they are not directly comparable
- IMD data is out of date.