Karl Ho
School of Economic, Political and Policy Sciences
University of Texas at Dallas
Social Data Collection & Analytics with illustration of COVID-19 data
Presentation prepared for UT Dallas Computer Science Spring Break Online Conference
(Series of Tech-Talks and Tutorials), March 24, 2020
Data Science with a cause
Data scientists should commission themselves to addressing complicated and urgent problems with data-driven solutions and data-based answers.
This workshop illustrates using data science tools in dealing with the most difficult problem of the COVID19 virus. Lack of understanding of the data already poses a serious threat to our population and society.
Outline
-
Introduction
-
Strategy of Social media project
-
Workshop
-
Software
-
Social Media Data Collection
-
API method
-
Non-API method
-
-
Social Media Data Analytics
-
Sentiment analysis
-
Network analysis
-
-
Introduction
This workshop is a survey to the basic collection and analytics methods. It focuses on R and Python tools. Suggested setup:
- R (>=3.6)
- RStudio (>1.2)
- Anaconda
- Python 3 (>=3.6)
- Jupyter notebook (>5.7)
- Text editor
- Excel
Notes for class
No prior experience is required but it is recommended students get the software pre-installed. Sample programs are for MacOS, Windows and Linux.
Class GitHub: https://github.com/datageneration/smdca
Class notes: (to be posted after class)
https://datageneration.org/
Author Twitter:
@karlho
Strategy
Social media data is huge. According to highscalability.com, Twitter processes and stores 250 million tweets per day. Facebook, Instagram and other social media will probably deliver higher volume and size dependent on contents.
Studying social media is big business and the stake is high also. It is advised setting up a strategy in downloading, storing and analyzing the data.
Strategy
Decision to be made:
- What is the purpose of project?
- Resources
- Use personal computer
- Cloud
- UTD computing (e.g. TACC)
- Time
Strategy
This workshop demonstrates methods and options for social media data research.
-
Twitter
-
R and Python
-
Hypothesis formation
Why Twitter?
Facebook can be among the most popular social media. However, since Cambridge Analytica, the company limits its API and collection of data. Instagram under the same company is limited too.
Google is very cautious on its data (e.g. Youtube) and its API's are changing often.
Why Twitter?
Twitter messages convey not only information but sometimes sentiments. The trajectory of retweets reveals the structure and organization of spread of public opinions.
Twitter is primarily keeping its open policy and is getting popular for researchers.
In 2018, over 50,000 studies conducted using Twitter data.
Stieglitz and Dang-Xuan (2012): Sentiments matter!
Public opinion research (O'Connor et al. 2010, Bollen, Mao and Pepe 2011, Forelle et al. 2015)
Literature
Twitter public opinion could be deceitful (Cook et al. 2014, Forelle et al. 2015)
Illustrations
In this workshop, we illustrate how to collect data of public responses on public figures and recent issue or event using social media data. Specifically, we compare different methods to collect Twitter data by 1. username and 2. keyword query search.
API method using R (rtweet) and non-API method using Python (GetOldTweets3) will be demonstrated.
Data source
-
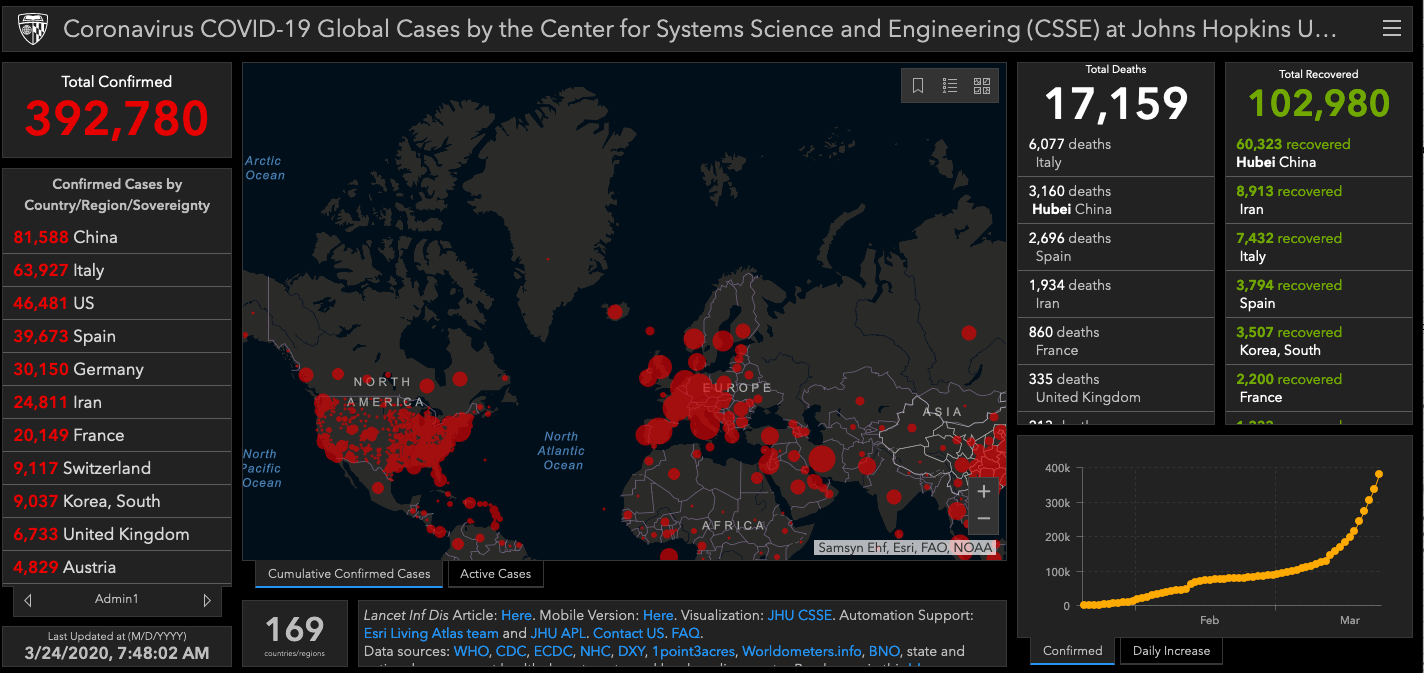
Most cited/used: Johns Hopkins University Center for Systems Science and Engineering (JHU CSSE)
-
https://github.com/CSSEGISandData/COVID-19
Data source
-
US CDC: https://www.cdc.gov/coronavirus/2019-ncov/index.htmlNational Health Commission of the People's Republic of China (NHC): http://www.nhc.gov.cn/xcs/yqtb/list_gzbd.shtml
-
China CDC (CCDC): http://weekly.chinacdc.cn/news/TrackingtheEpidemic.htm
-
Hong Kong Department of Health: https://www.chp.gov.hk/en/features/102465.html
-
Macau Government: https://www.ssm.gov.mo/portal/
-
Taiwan CDC: https://sites.google.com/cdc.gov.tw/2019ncov/taiwan?authuser=0
-
Government of Canada: https://www.canada.ca/en/public-health/services/diseases/coronavirus.html
-
Australia Government Department of Health: https://www.health.gov.au/news/coronavirus-update-at-a-glance
-
European Centre for Disease Prevention and Control (ECDC): https://www.ecdc.europa.eu/en/geographical-distribution-2019-ncov-cases
-
Ministry of Health Singapore (MOH): https://www.moh.gov.sg/covid-19
-
Italy Ministry of Health: http://www.salute.gov.it/nuovocoronavirus
-
Worldometer https://www.worldometers.info/coronavirus/
-
The COVID Tracking Project https://covidtracking.com/
-
1Point3Acres https://coronavirus.1point3acres.com/#stat
Underreporting
Useable
Data source
-
Most cited/used: Johns Hopkins University Center for Systems Science and Engineering (JHU CSSE)
-
https://github.com/CSSEGISandData/COVID-19
Data on key word
Your mileage will vary!
- #COVID19
- #coronavirus
- #covid19
- #CoronaVirus
- #Coronavirusflorida
- #coronavirusnewyork
- #coronaviruscalifornia
- #Coronavirustexas
API method
An application programming interface (API) is an interface or communication protocol a company or organization employs to interface with public users.
All social media companies make API available for public (customers) to access its data. Twitter's API, for example, allows paying customers to get data for business and development purposes.
API method
The essential weakness of the API methods however is the “blackbox” process that lacks transparency and stability (Morstatter et al. 2013). Social media companies can alter the amount of data available and fashion of acquisitions at own discretion at any point of time.
In Twitter’s case, the company offers Premium or Enterprise APIs to allow developers or account holders to get "full" data at a fee (reportedly $149/month to $2,499/month for the former, according to techcrunch.com).
non-API method
In this study, a non-API method is introduced to illustrate a method of extracting Twitter data using simple mechanism with Python-based programs. While the new approach does not rely on API tokens and specifications, it points to a new direction of social and web data extraction using simple programs (see also Fu, Chan and Chau 2013).
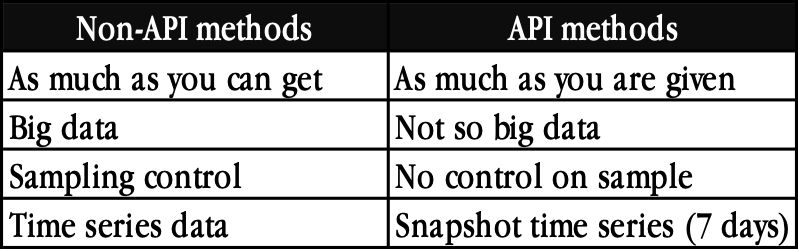
Data
| Advantages | Disadvantages | |
|---|---|---|
| REST API | API regulated | |
| GOT | More time and data control (12 variables | Needs Python customizations |
| Scraper | Older data | Limited N; needs Python customizations |
| rtweet | more variables (92) | <7 days of data |
Non-API method
Twitter API is not without limits. These limits vary over time and it currently allows up to one week’s data. Some packages can reach data within a shorter period due to data size and number of variables. Other methods have been developed to collect historical Twitter data.
Non-API method
Jefferson Henrique and Dimtry Mottl have developed python packages to scrape Twitter data based on the query system. These non-API methods collect Twitter data based on search results by parsing the result page with a scroll loader, then calling to a JSON provider. While theoretically it can search through oldest tweets and collect data accordingly, the number of variables are limited to the layout of search results.
Non-API method: key word
The non-API methods can collect Twitter data by keyword or username search. The former approach is good for studying public responses on a policy or an issue such as Corona Virus, etc.
The second approach allows studying social network, influence and behaviors of a certain user or group (e.g. Trump).
Twitter volume
January 23 to March 24, 2020
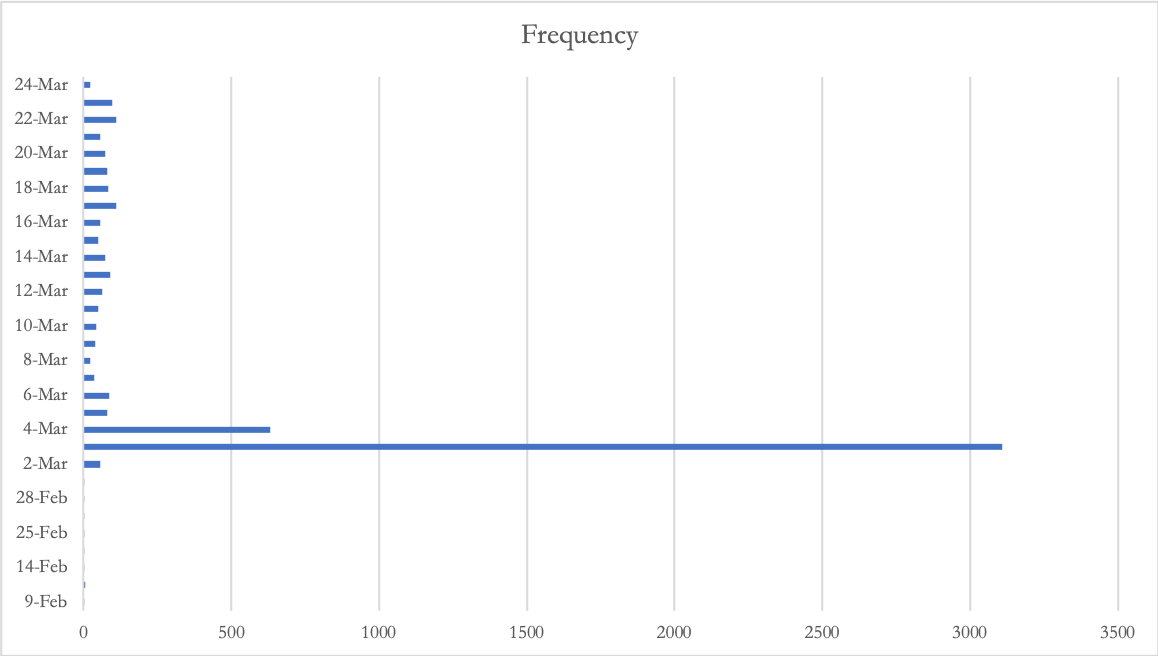
Illustration: retweet data
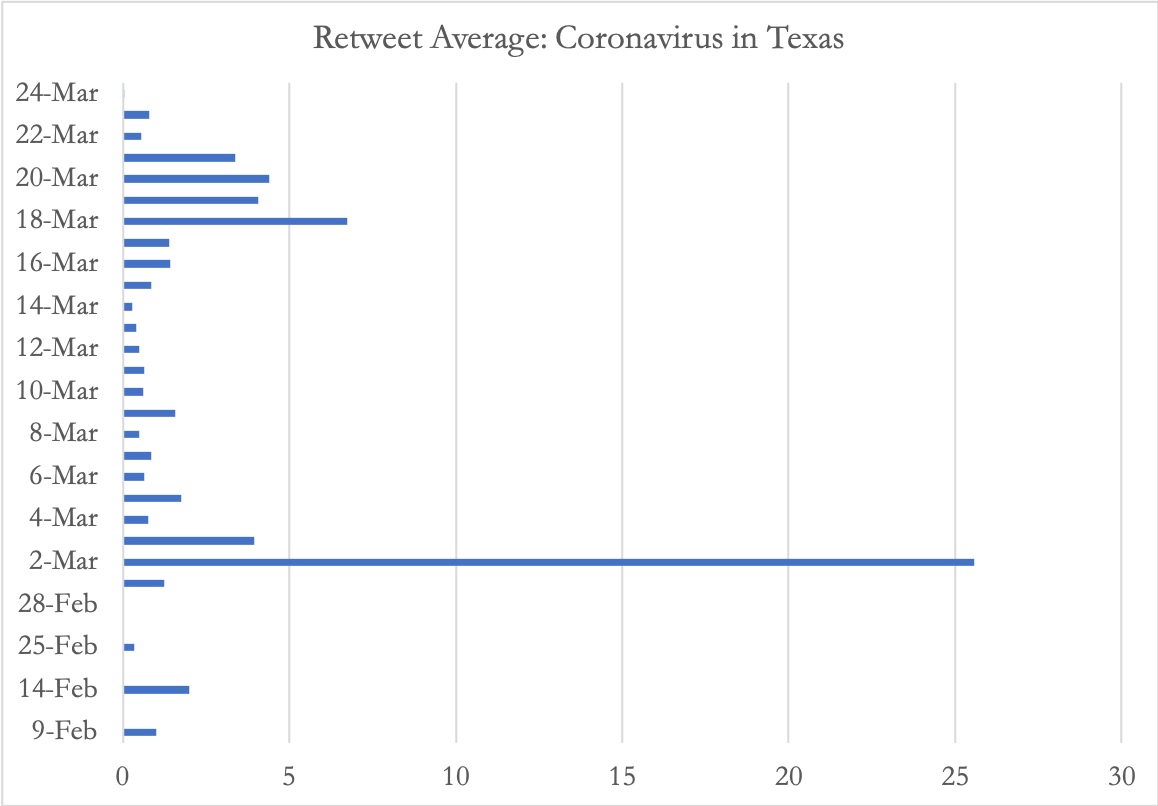
A simple retweeting goes beyond a single click’s impact. It represents the contagion effect spreading to other users. The mechanism for information dissemination and diffusion demonstrates how public opinions in particular political ones take on different track on contagion in the social media world (Stieflitz and Dang-Xuan 2012).
Retweet daily averages
January 23 to March 24, 2020
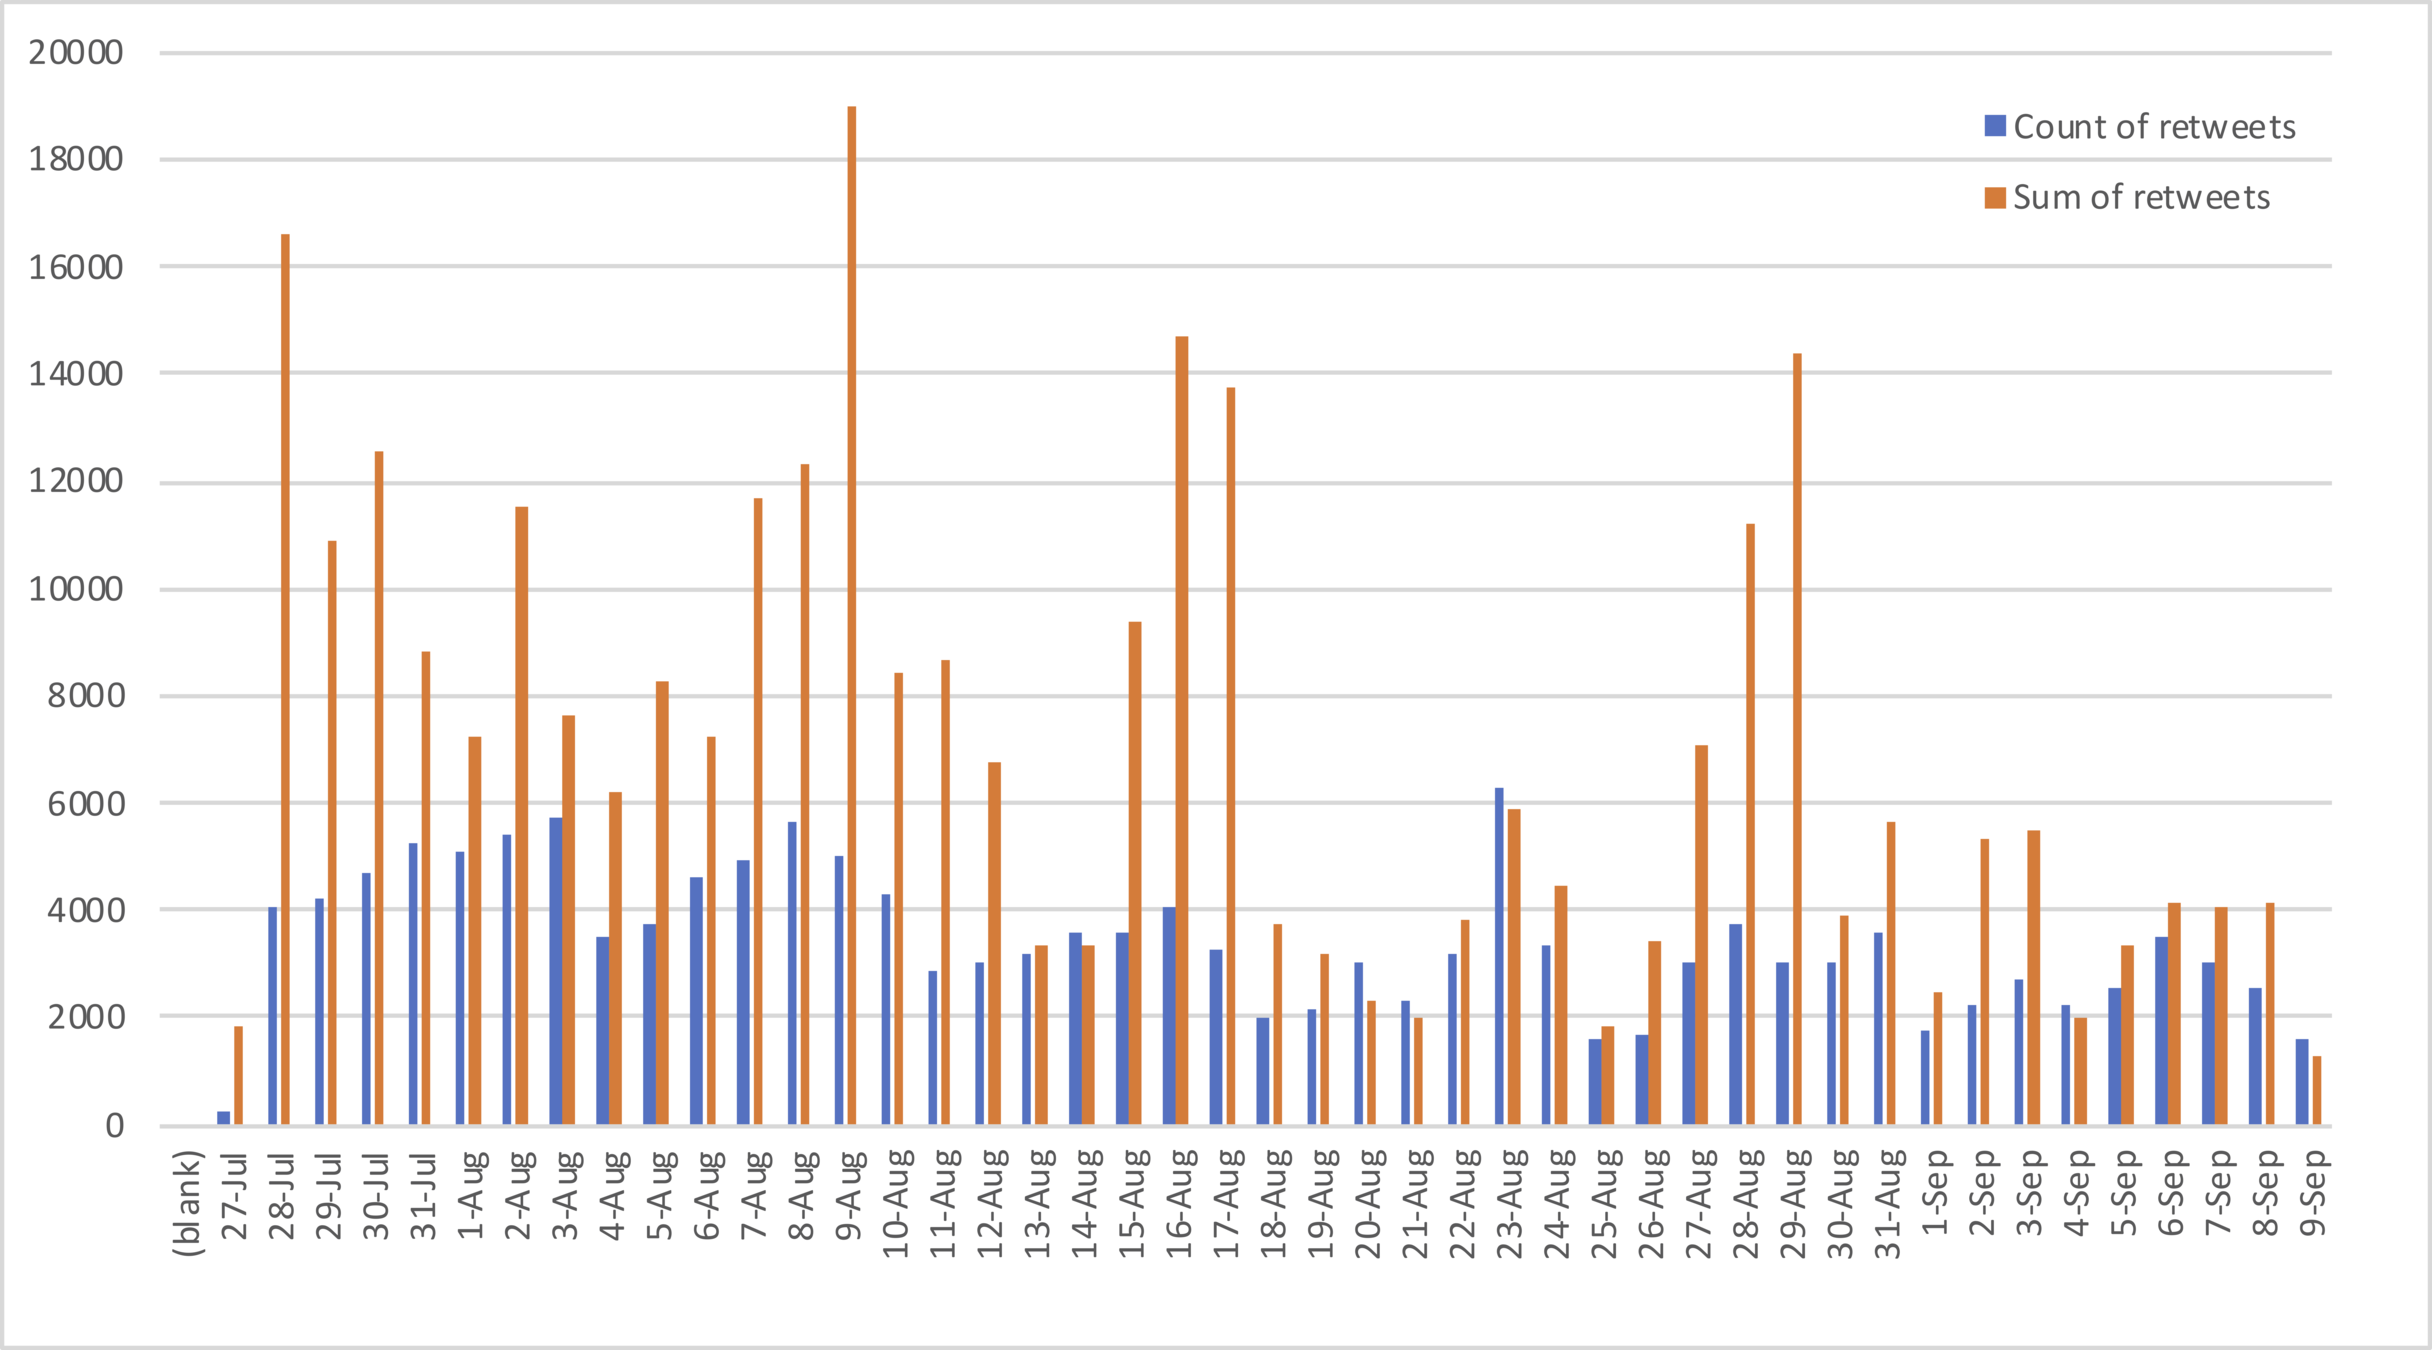
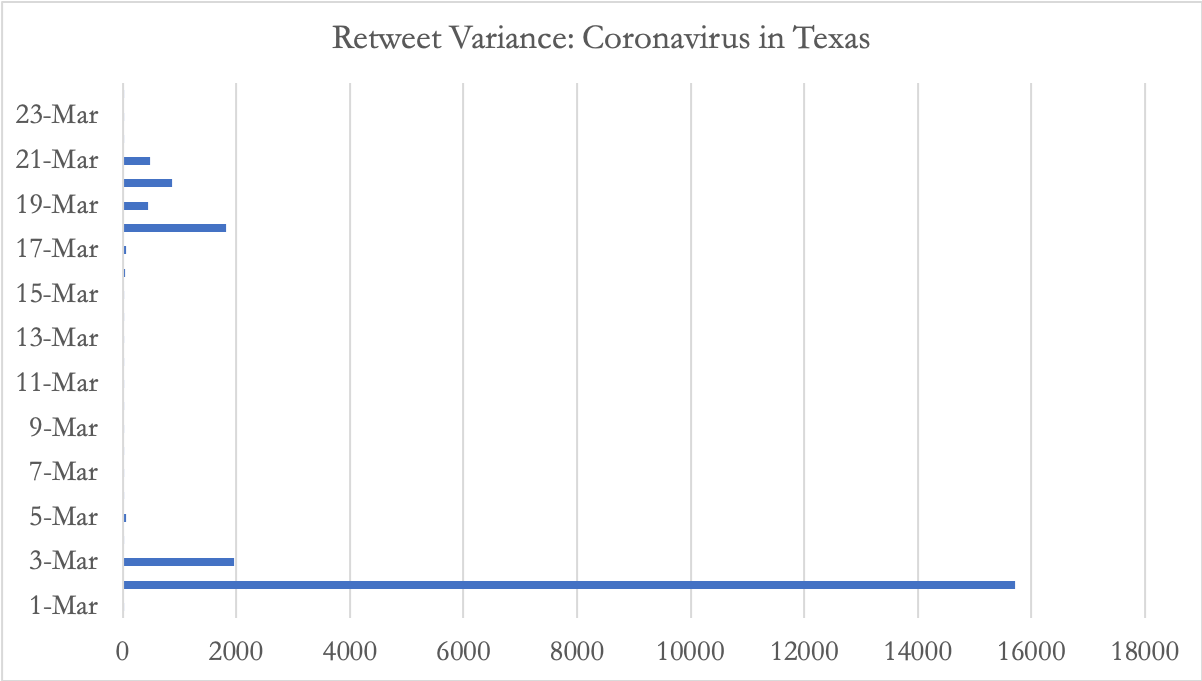
Retweet daily variances
July 27, 2018-September 8, 2018
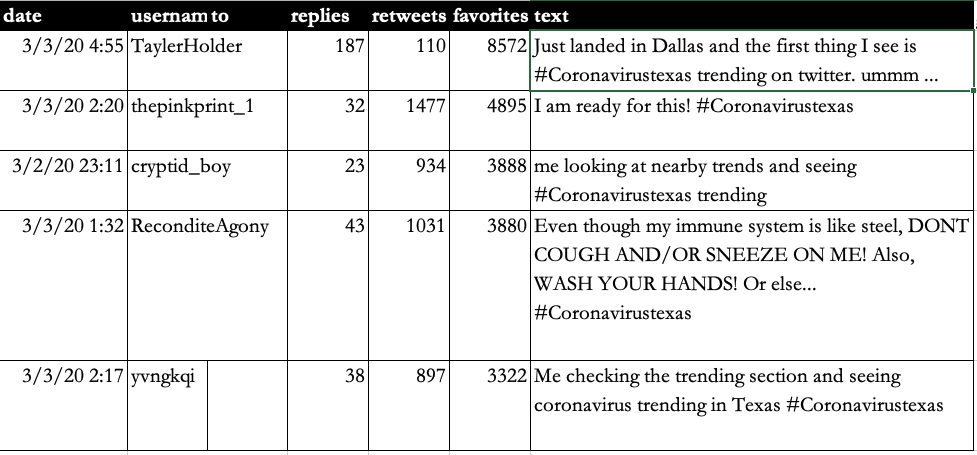
Twitter samples: top 5 retweeted
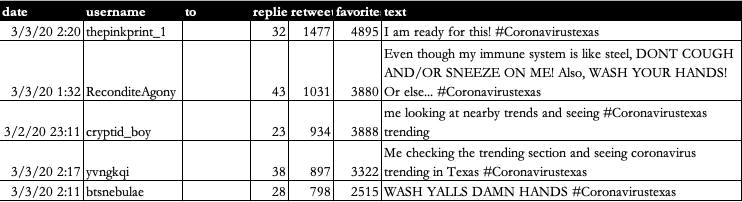
Twitter samples: top 5 liked posts
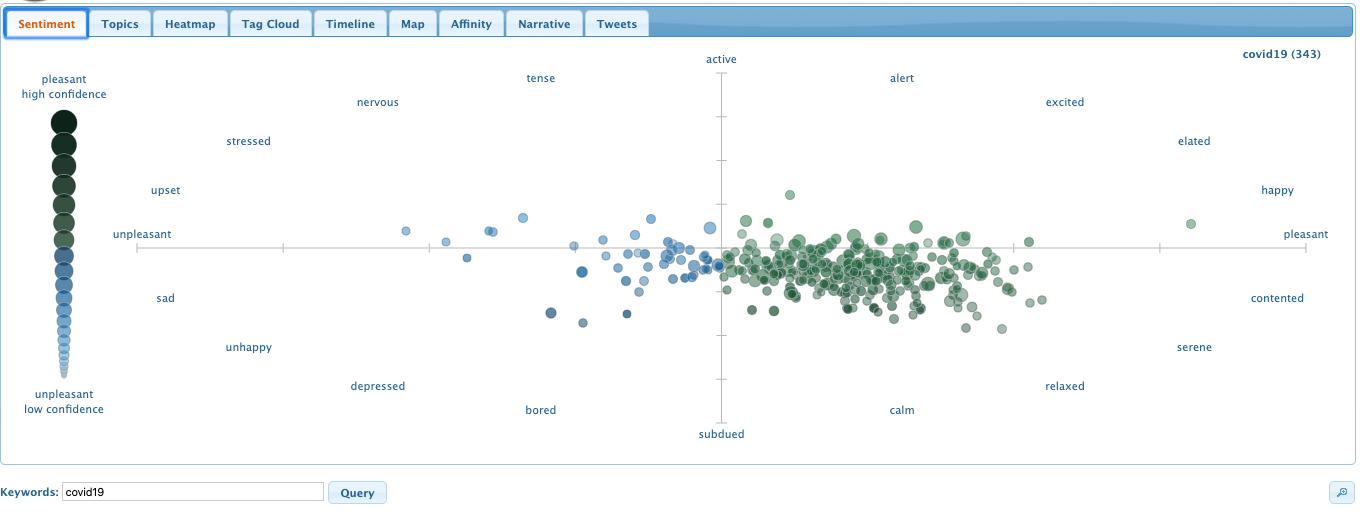
Sentiments
Sentiments

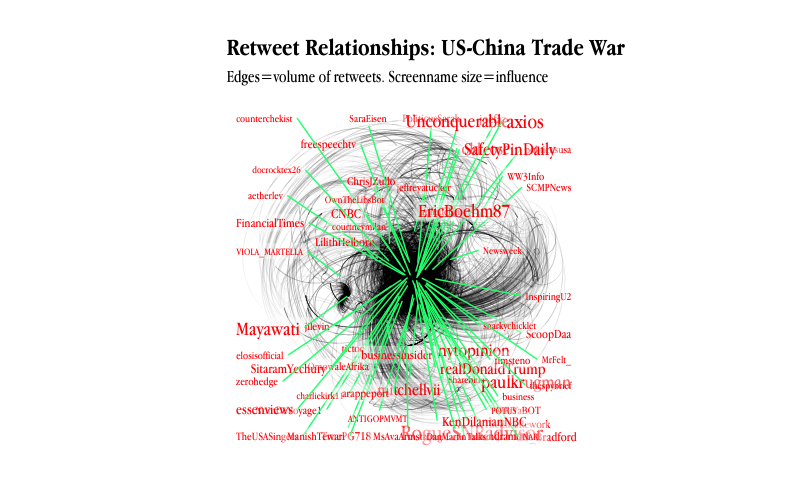
Illustration: Public Sentiments on Trade War
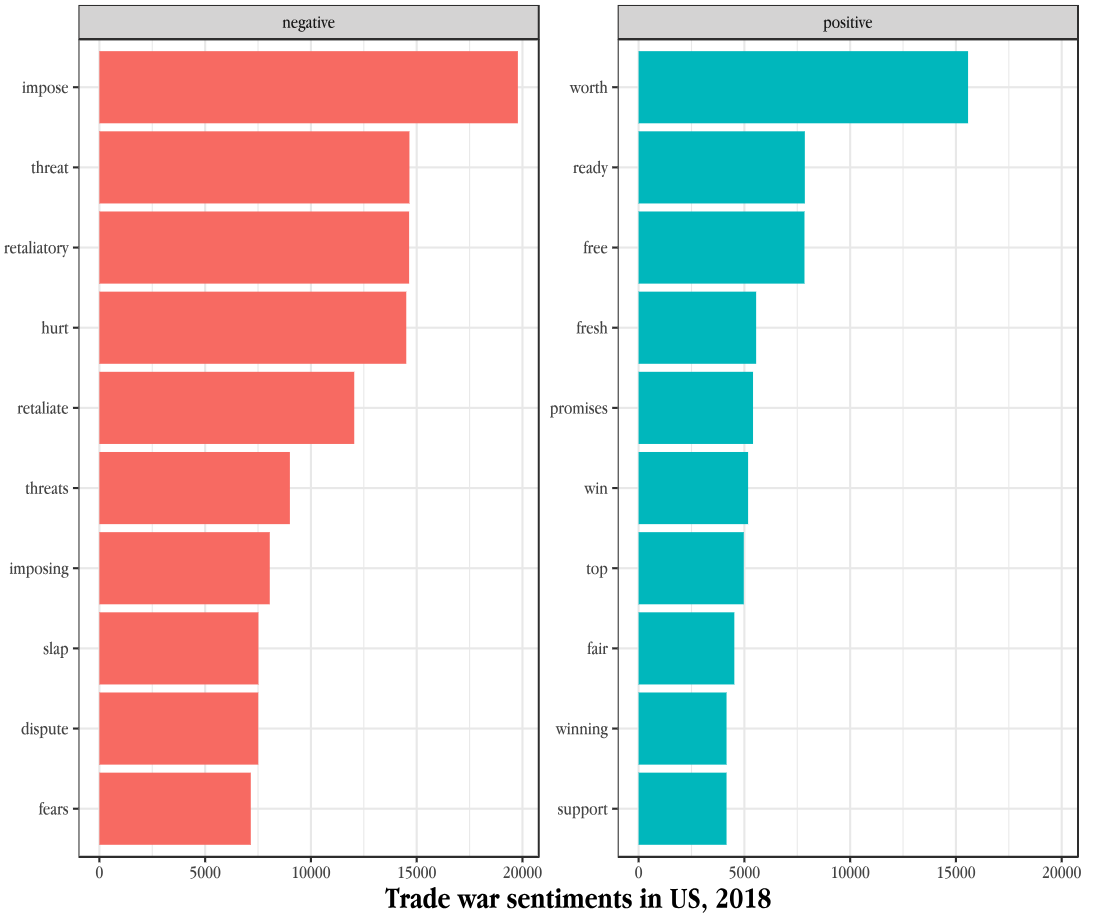
Illustration: Public Sentiments on Trade War
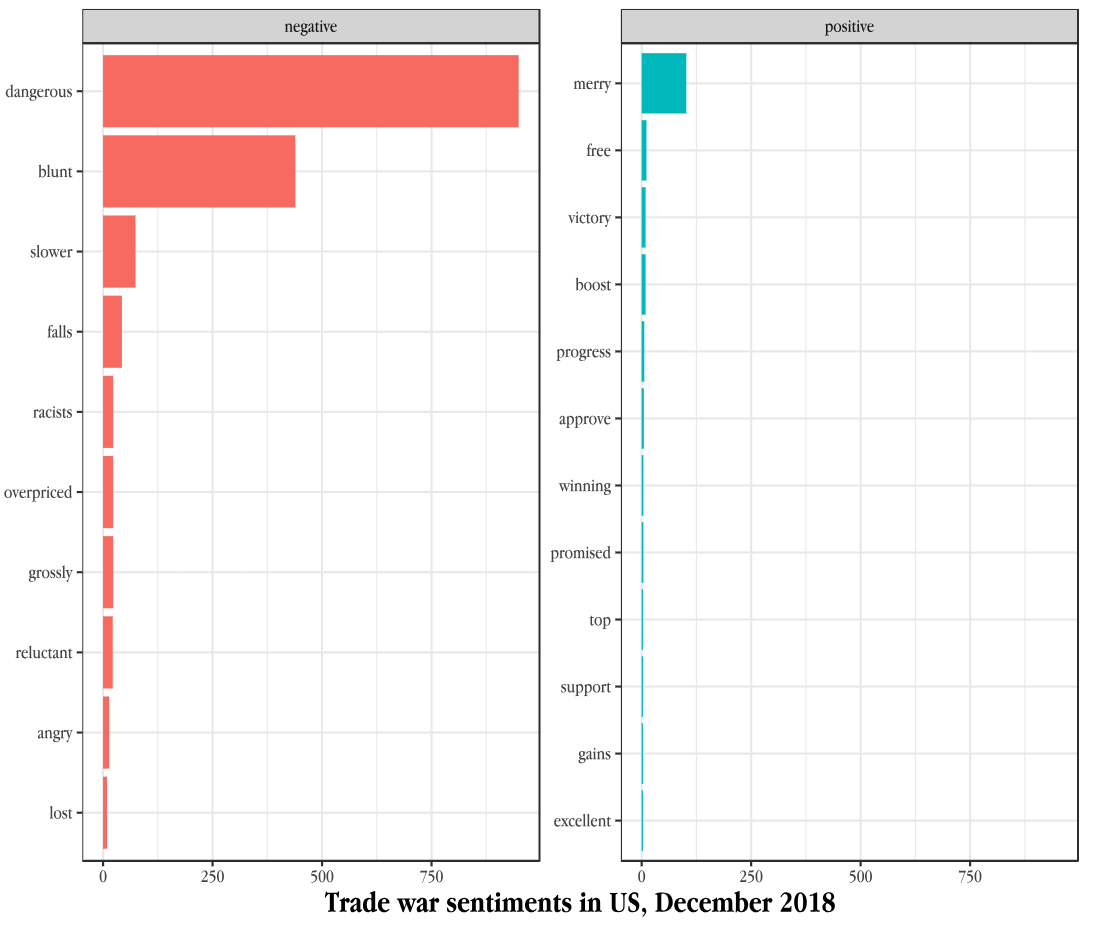
Illustration: Public Sentiments on Mexico wall
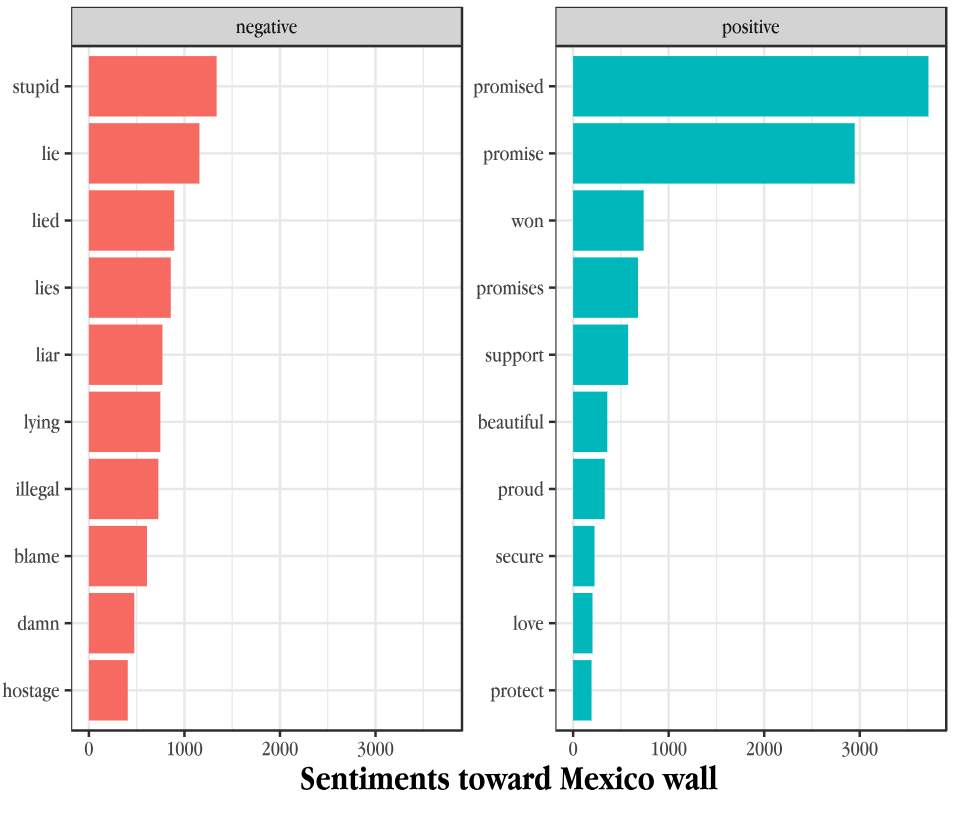
Illustration: Public Sentiments on Mexico wall
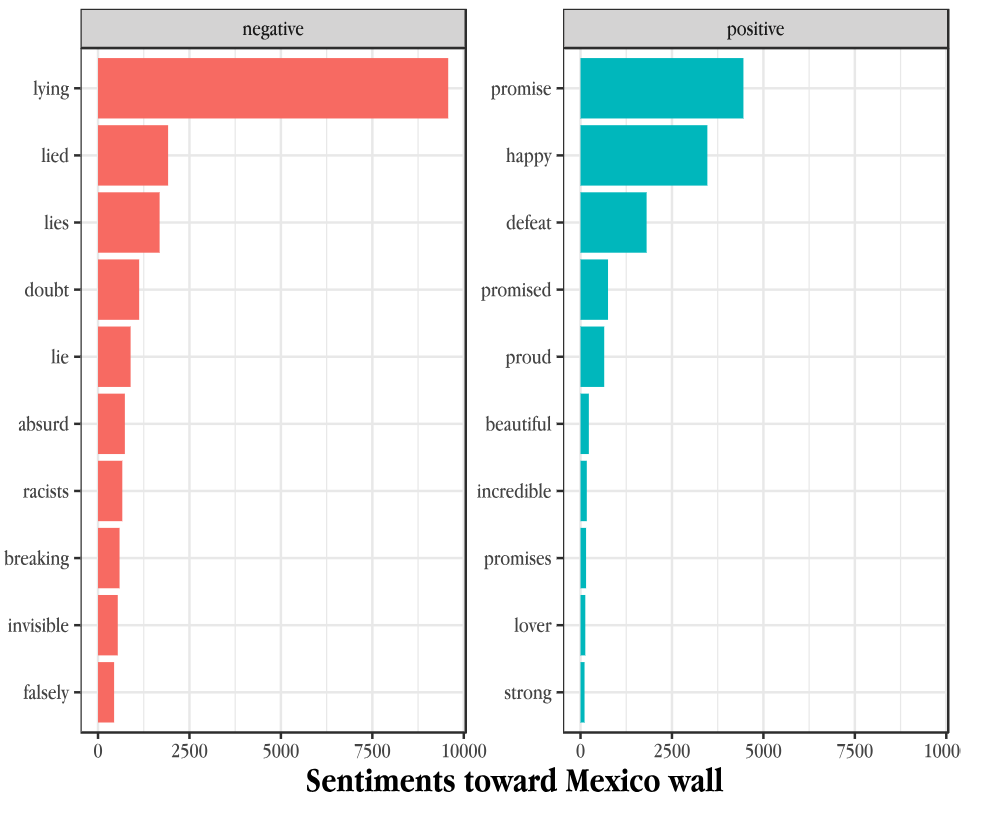
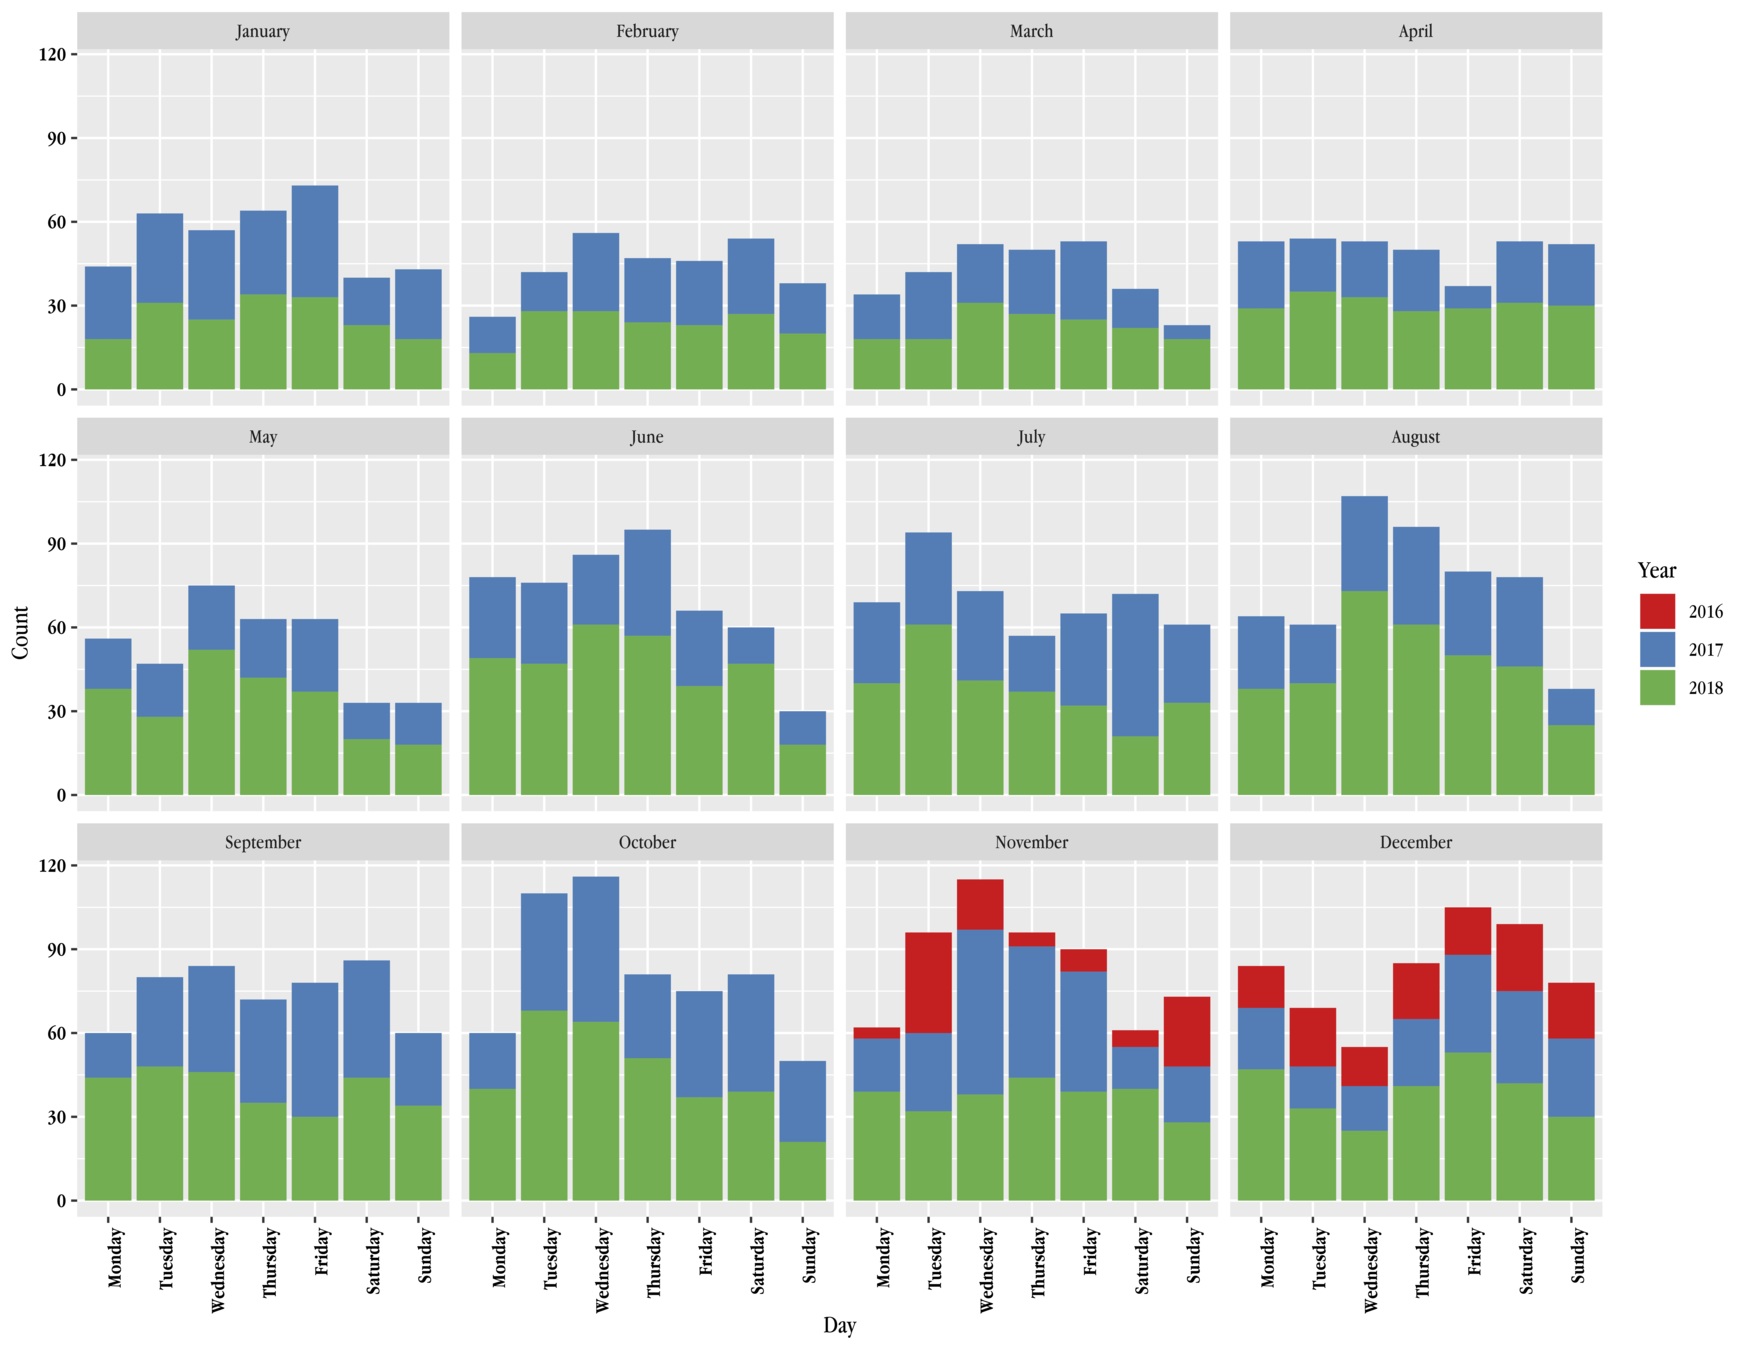
Illustration: Donald Trump's Tweet Pattern
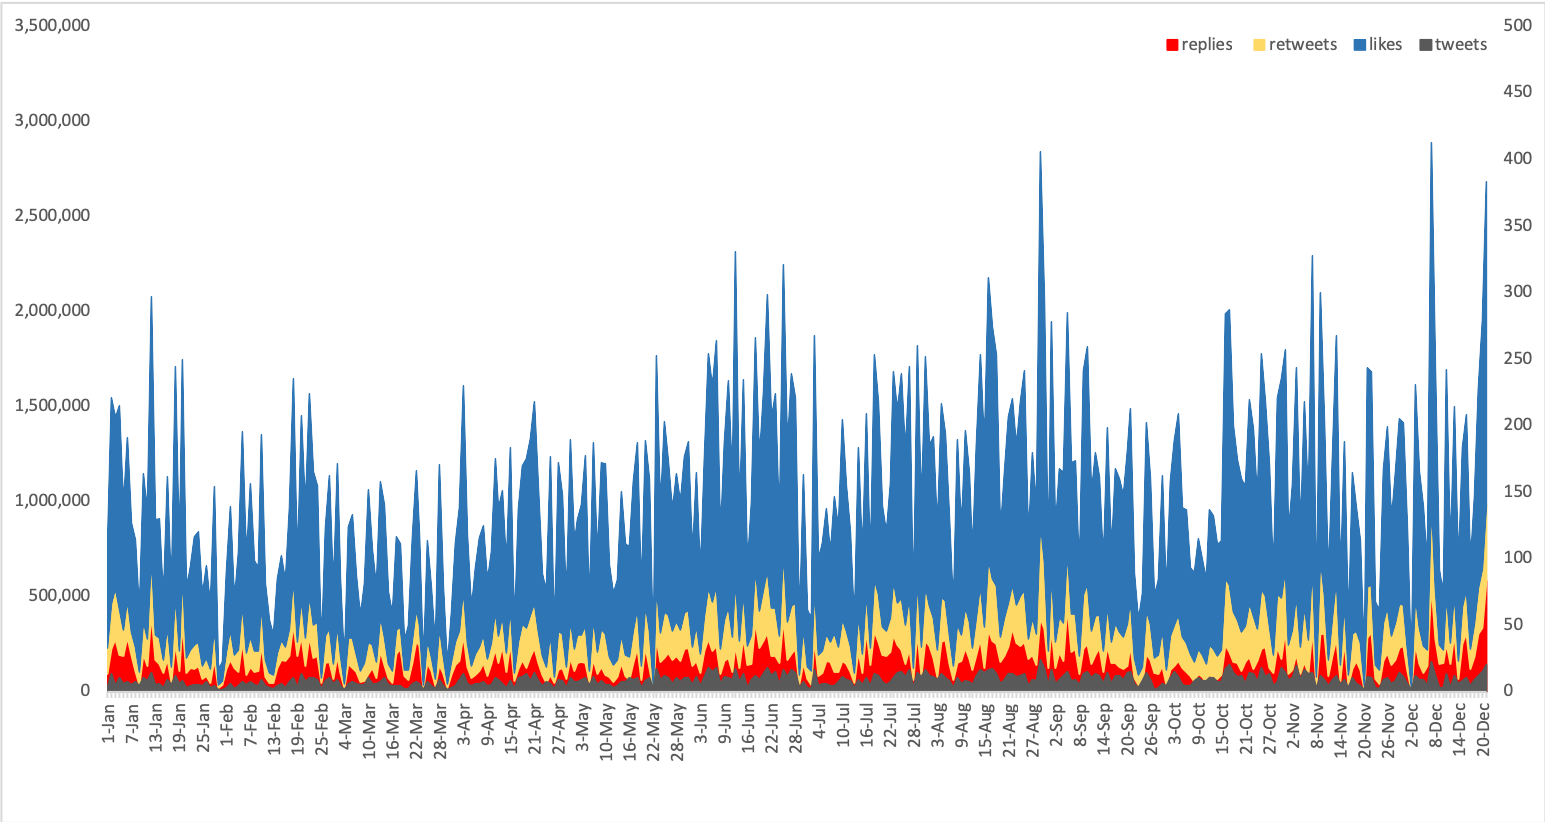
Illustration: Donald Trump's Tweet Pattern (per week)
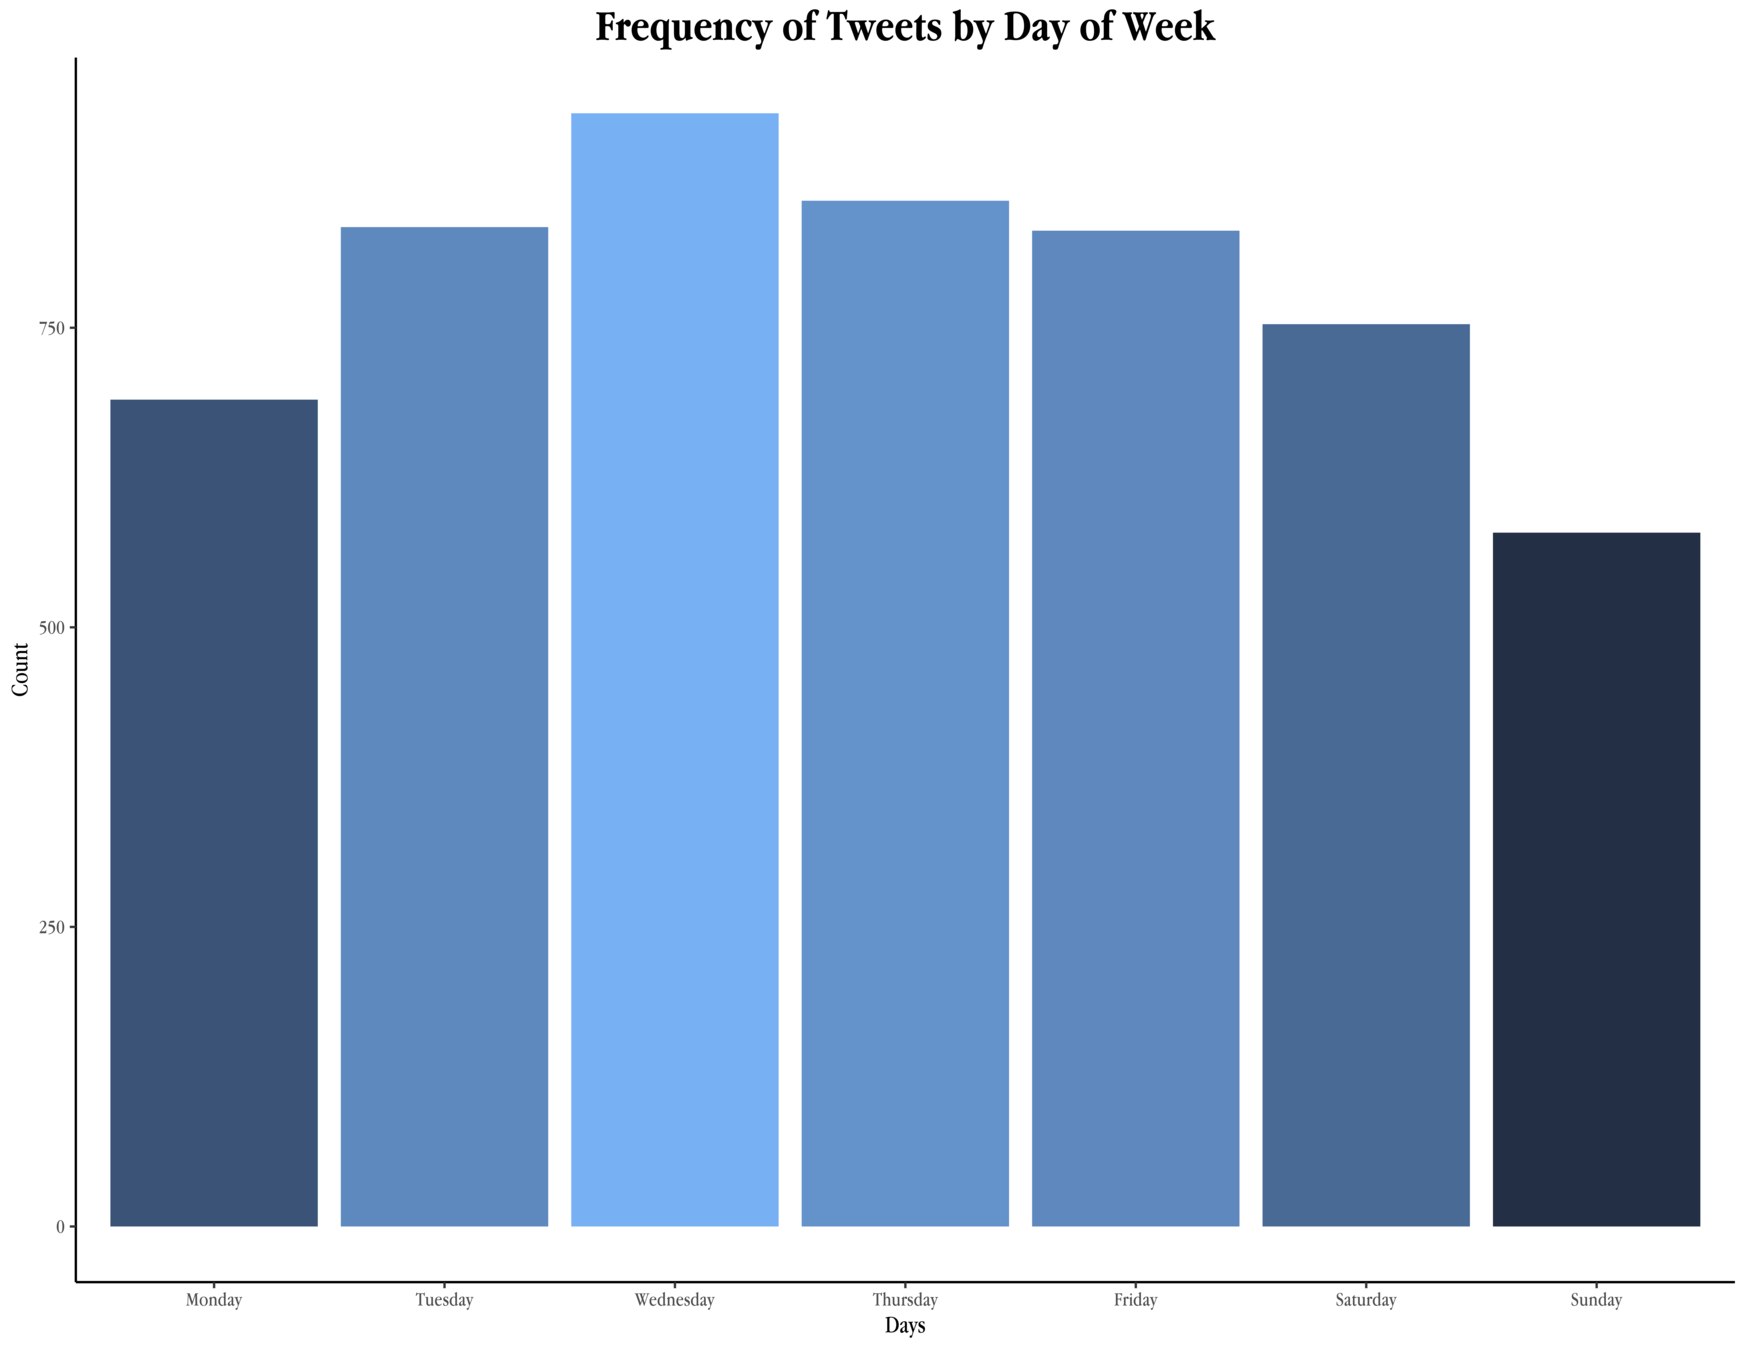
Illustration: Donald Trump's Diction use
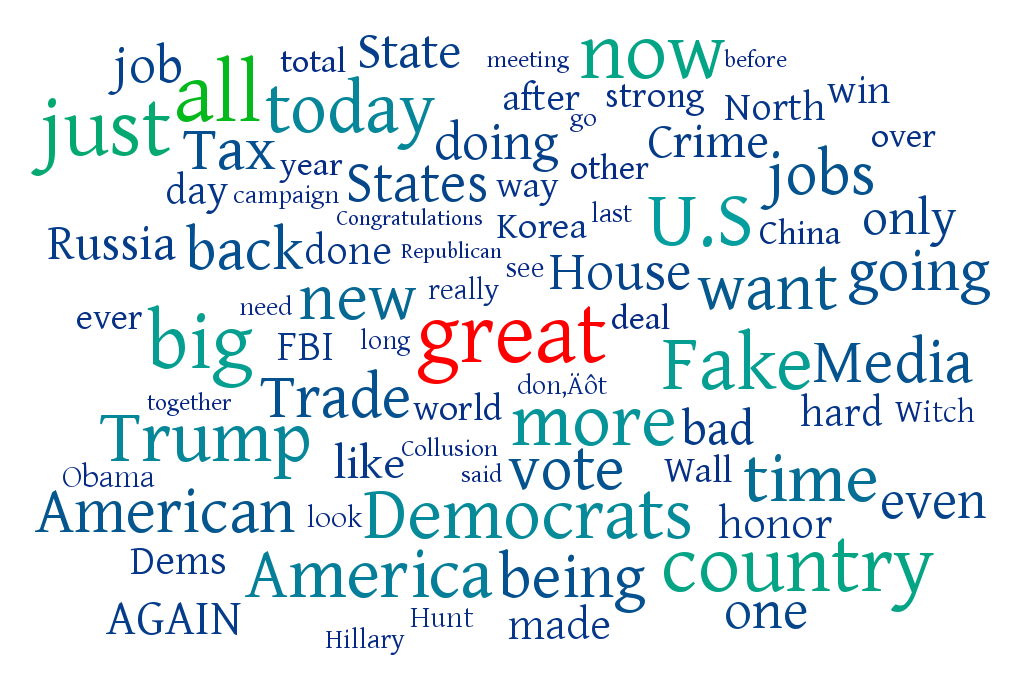
Illustration: Donald Trump's Twitter Popularity
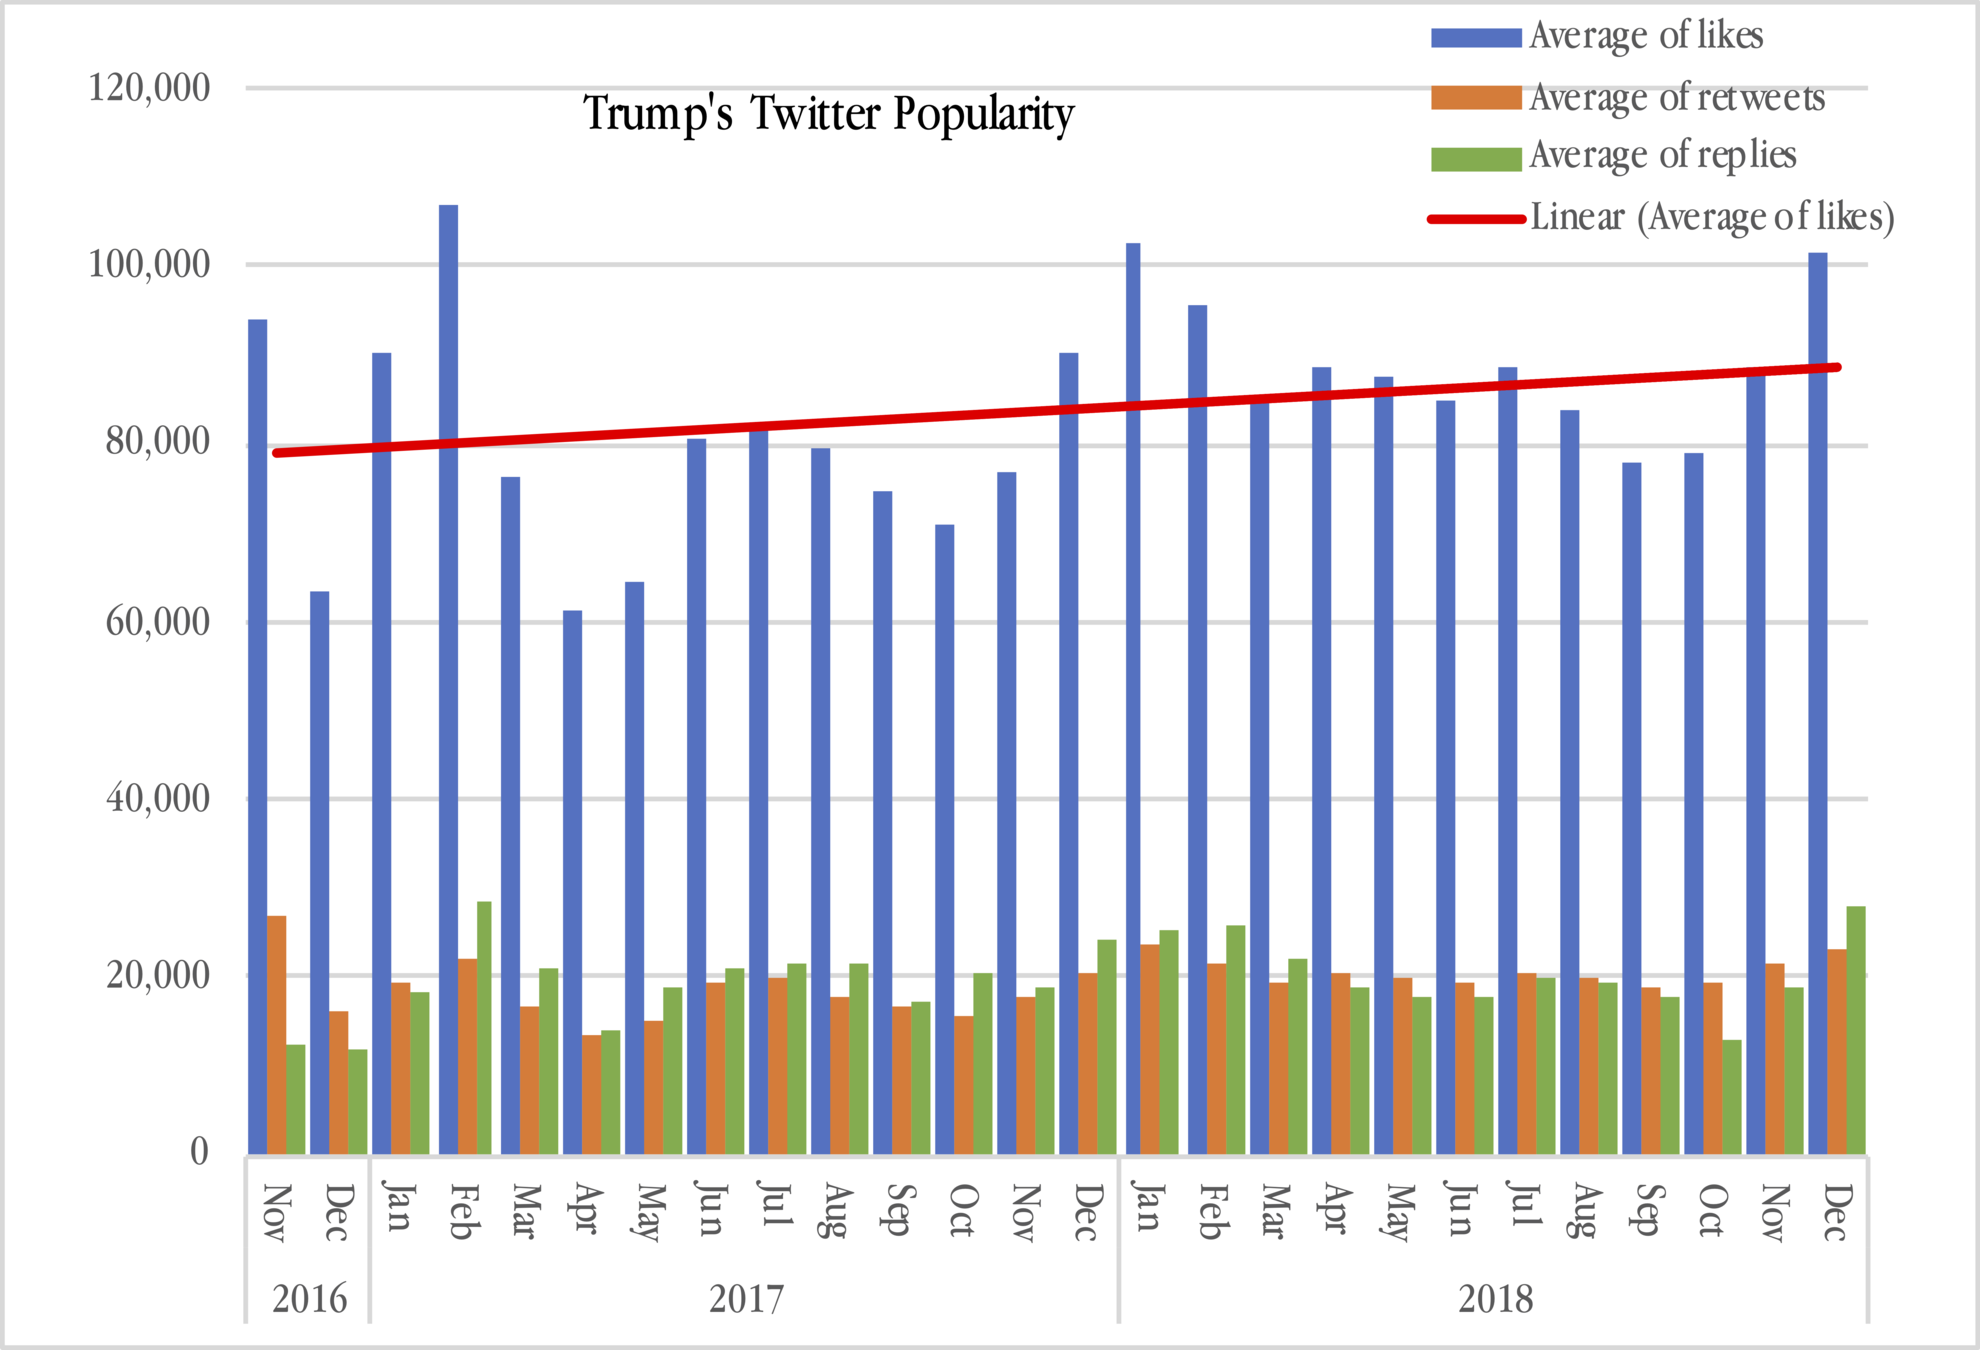
Illustration: Donald Trump's Twitter Popularity
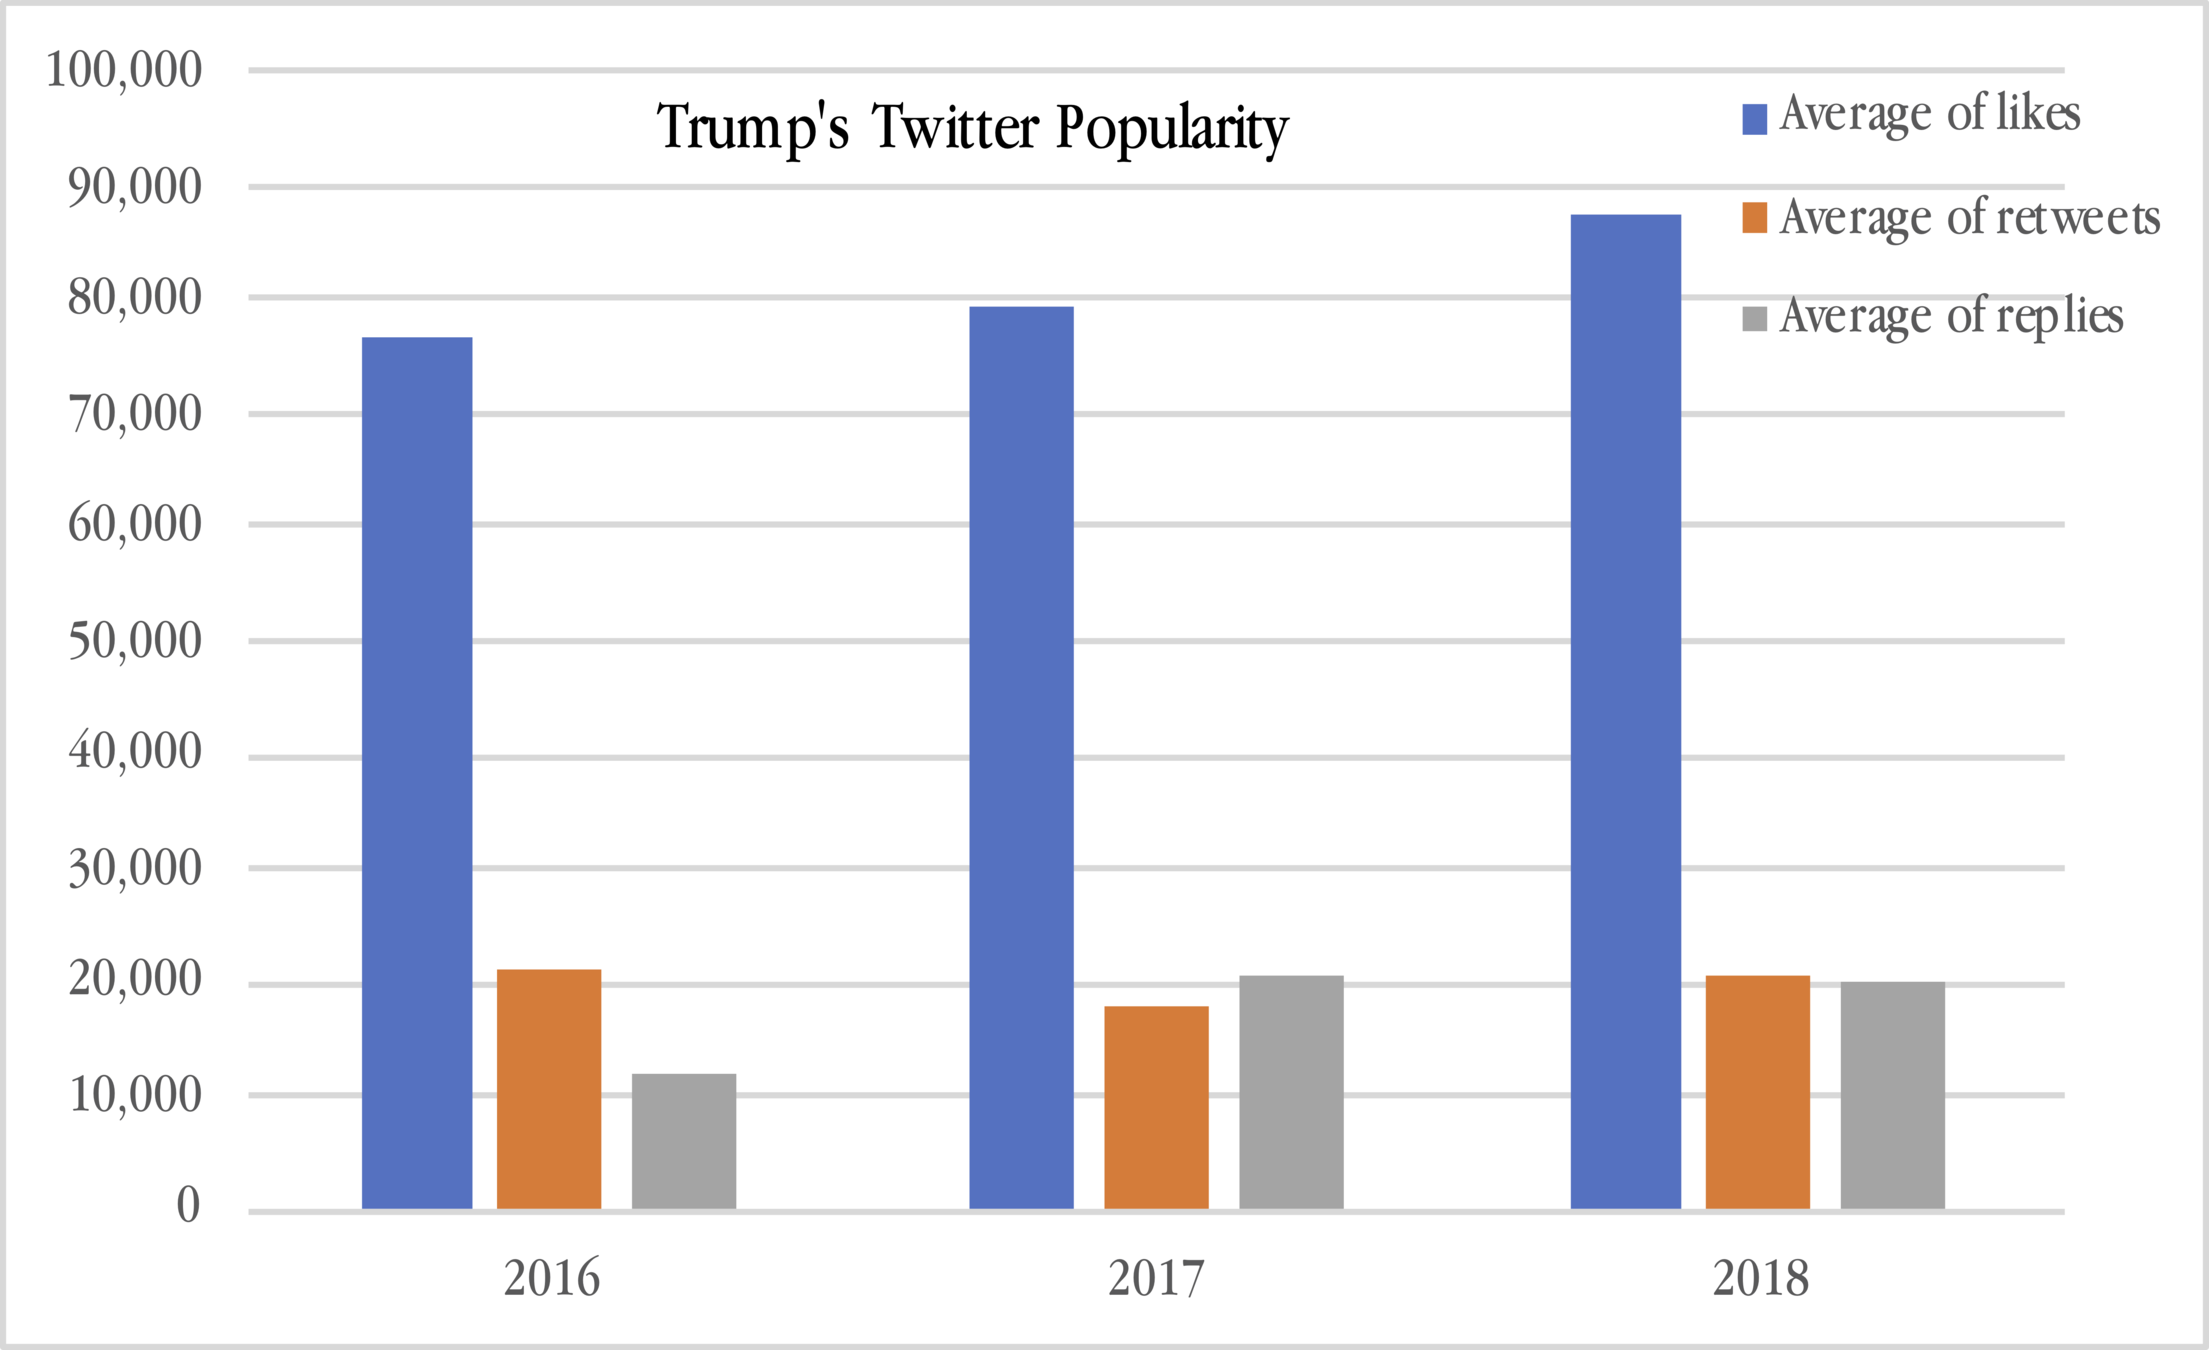
Illustration: Donald Trump's Direct Impact on Public Opinion
Non-API method: username
Another way of collecting Twitter data via the non-API methods is the username search. The method is good for collecting all data from one single user such as Donald Trump ("realDonaldTrump"). The merit of this method: sample = population.
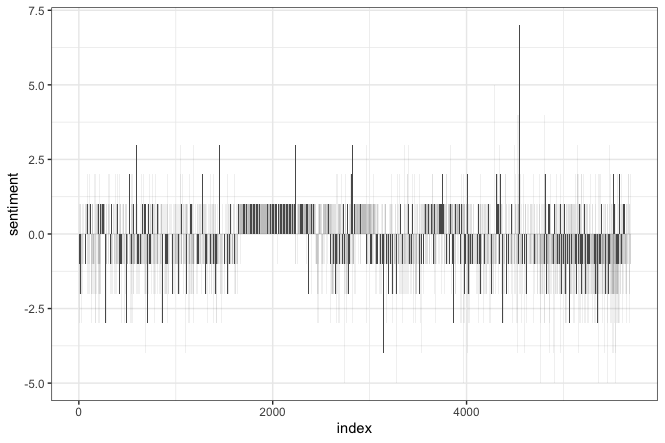
"realDonaldTrump" tweets
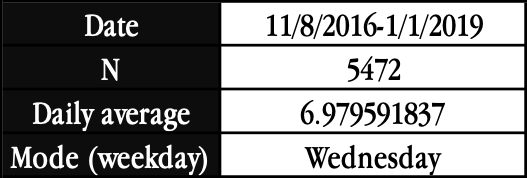
Sample: all tweets (5,472)
"realDonaldTrump" tweets
"realDonaldTrump" tweets
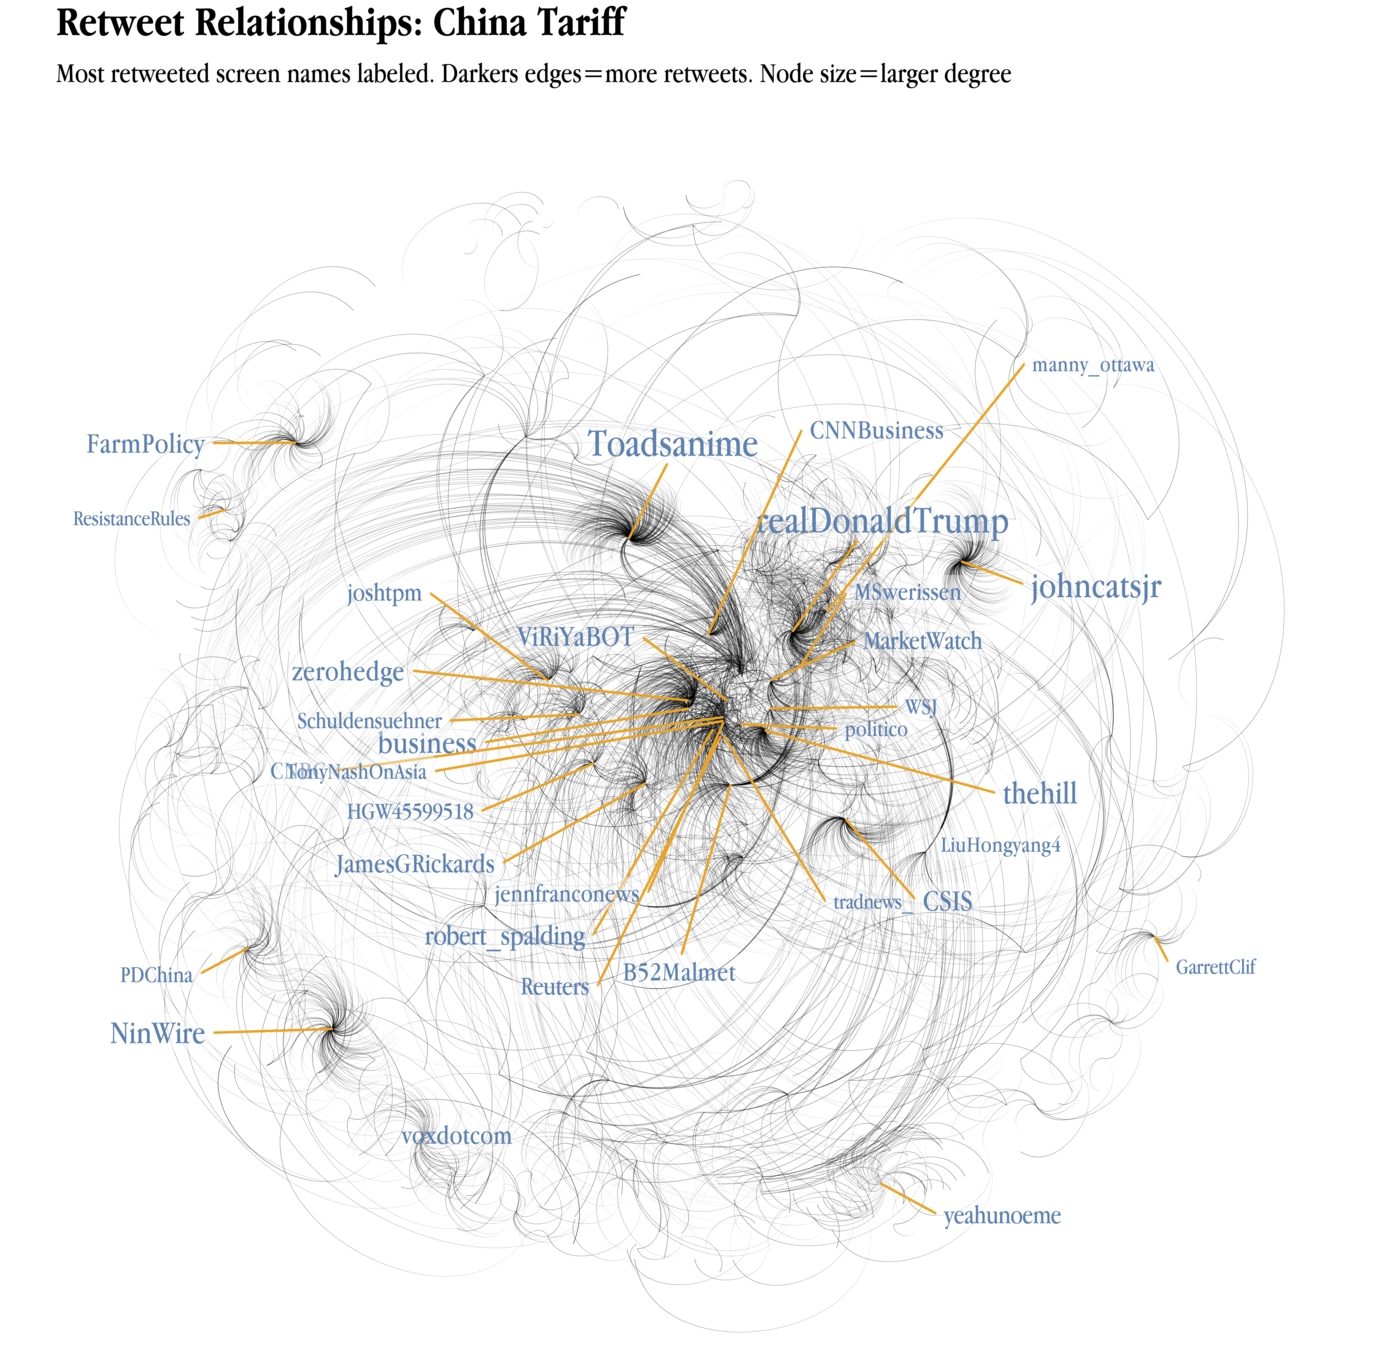
"China tariff" tweets

Issues and Implications
- Scraping methods determine representativeness:
- Size does matter? Or not?
- Width of RHS list
- More than finding Wally
- Sentiment analysis
- Word count method
- Text analytics vs. DL
- Intensity vs. volume
- Systemic bias
- Contagion effects

Example of Possible Sentiment Bias
Example of Possible Sentiment Bias
Conclusions and Discussions
-
Twitter provide great data sources for understanding instant public opinion.
-
Limitations:
-
API methods
-
Inference, samples and population
-
More variables needed
-
New strategy for social media sampling:
-
Focus on the network structure
-
Build samples over time
-
Collect data by influential networks and nodes
-
State-space models
-
Twitter data are time series data
-
Twitter data are social network data
-
Community identification
-
Future developments:
-
Network-driven sampling vs. Respondent-driven sampling (Heckathorn 1997, 2009)
-
Exponential random graph models (ERGM)
-
Markov chain models
-
Conclusions and Discussions
Little understanding of data collection process.....
"might lead to the collection of incomplete or biased data sets, which in turn might negatively influence the inferences drawn based on the data.”
- Jungherr (2016)
What went wrong?

What went wrong?
What went wrong?
What went wrong?
What went wrong?
What went wrong?
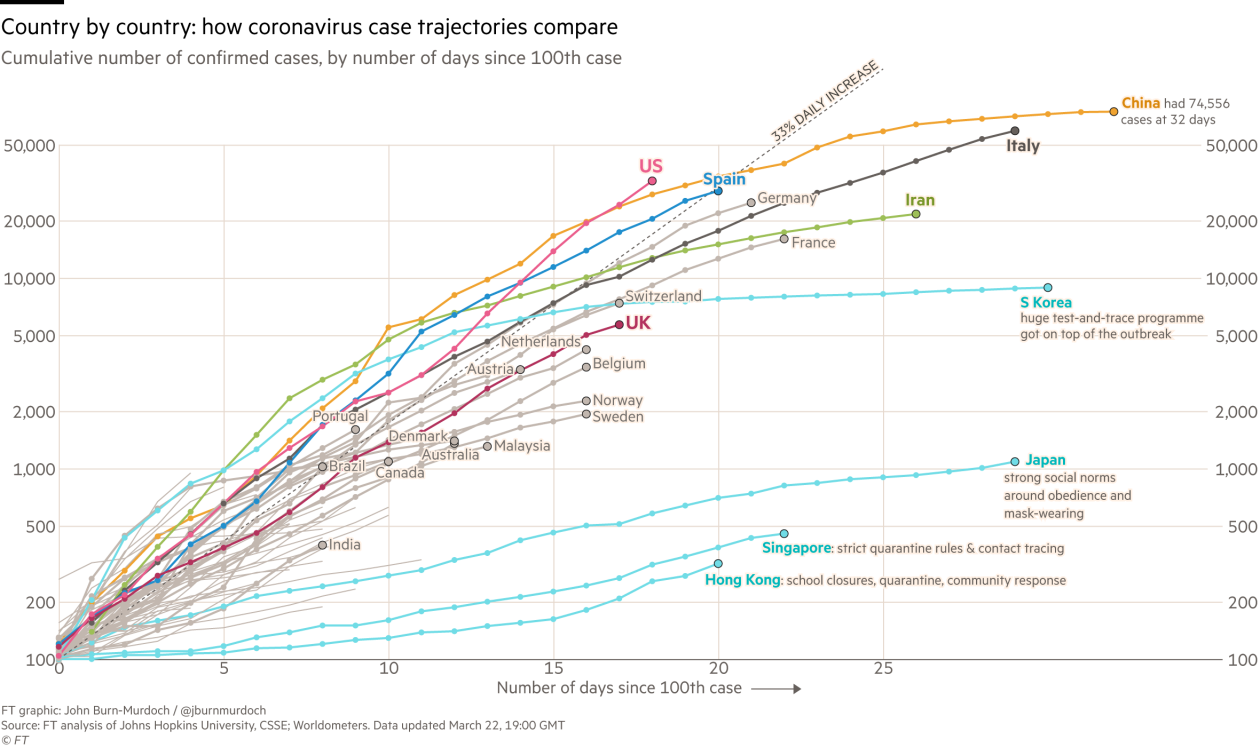
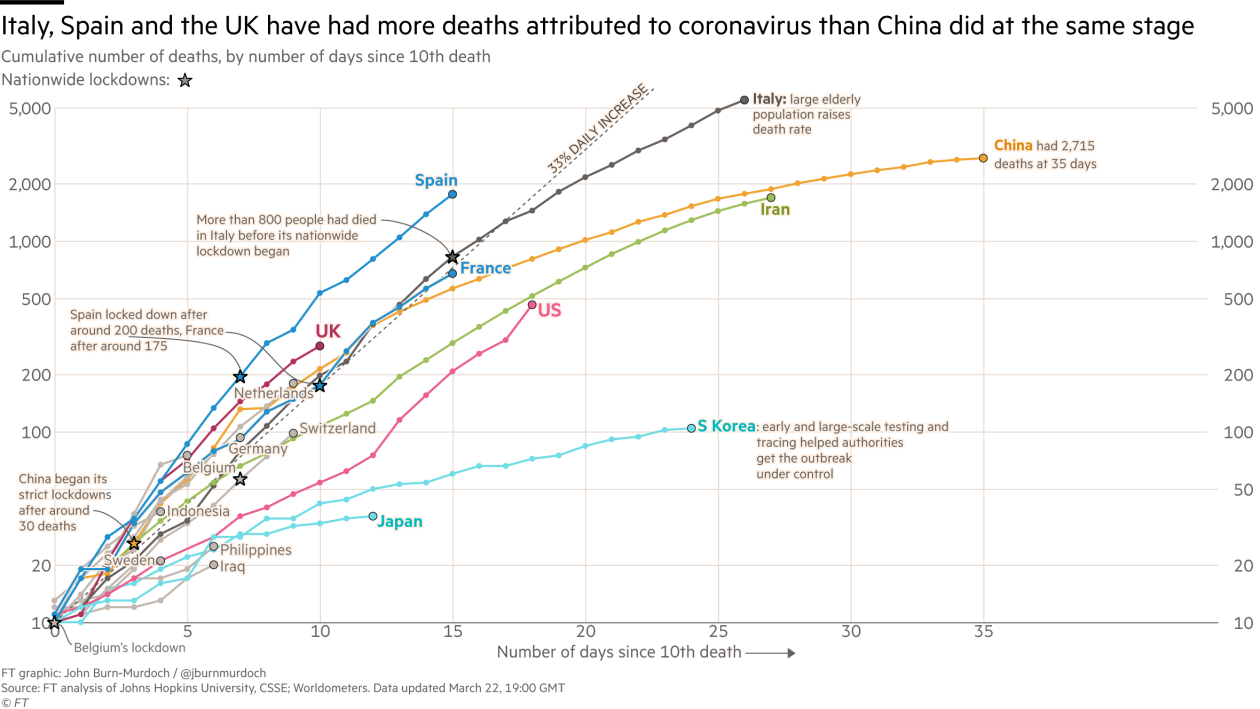
Writing on the wall:
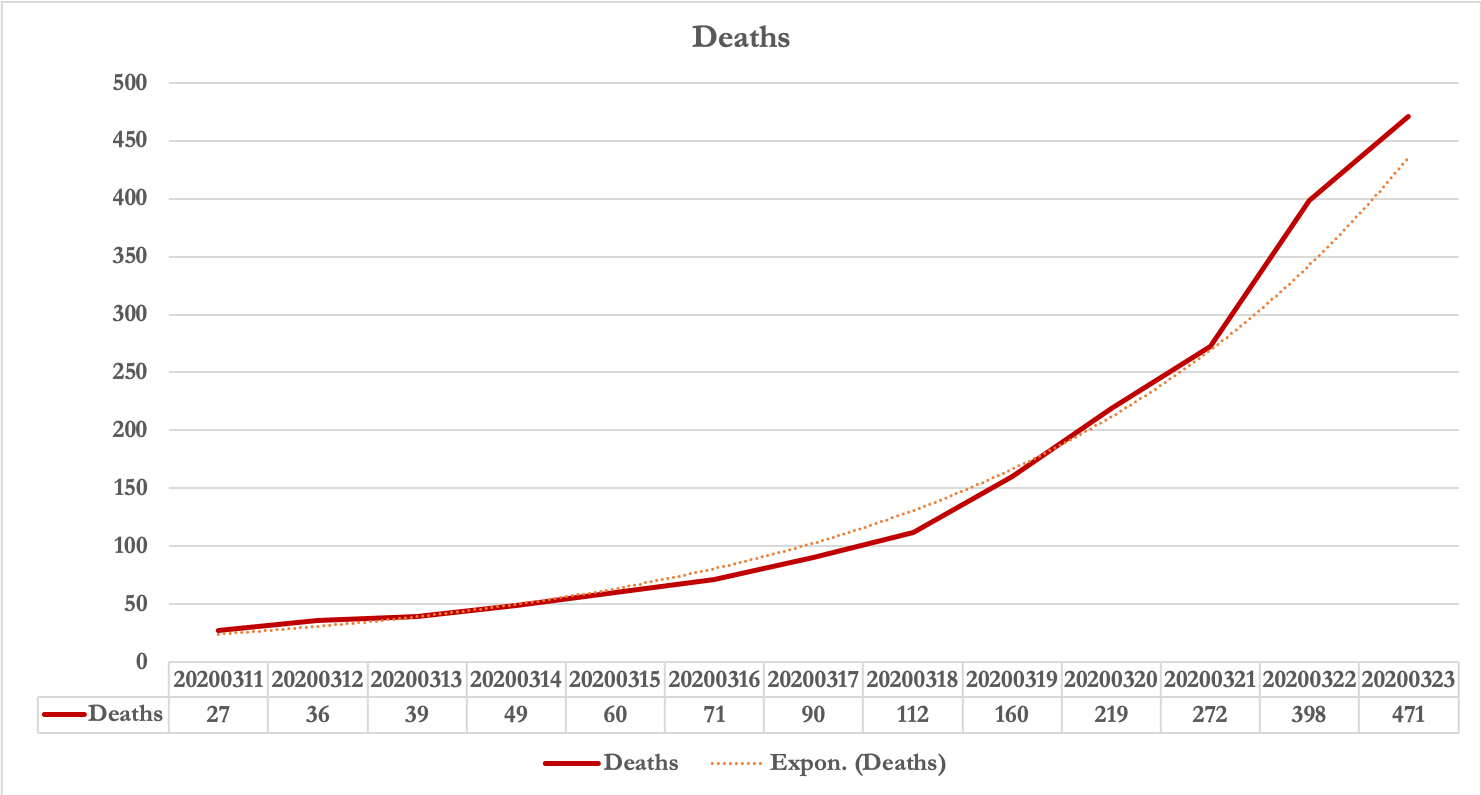
Within a week or so, we will be the most badly hit country even compared to China and Italy
Caveat:
Data are logged but trajectories are comparable!
Updates: New cases
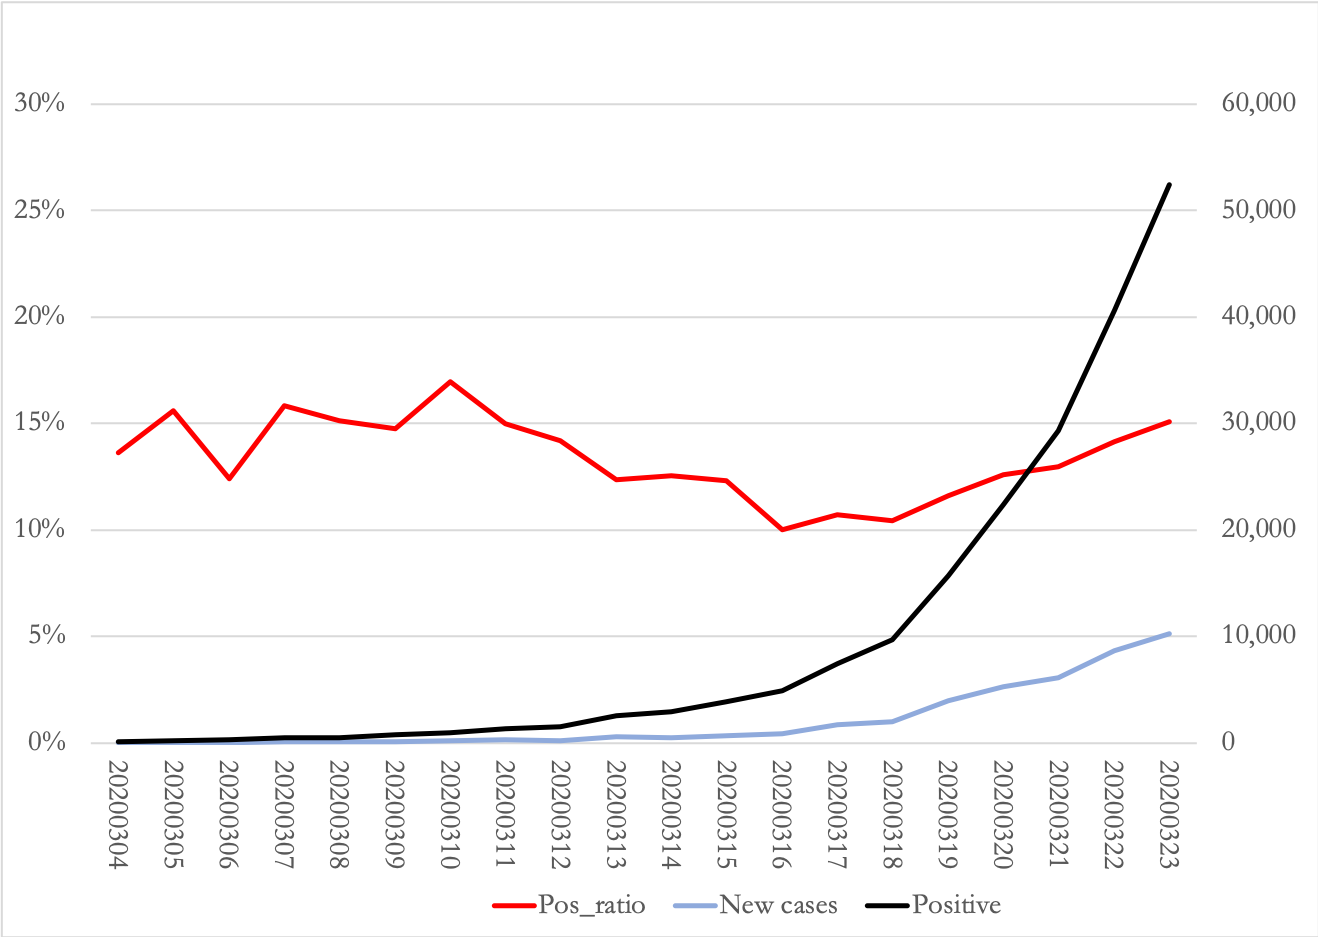
Updates: Death rate
What can be done?
https://twitter.com/karlho
-
Minimize death rate
-
Expedite medical supplies production
-
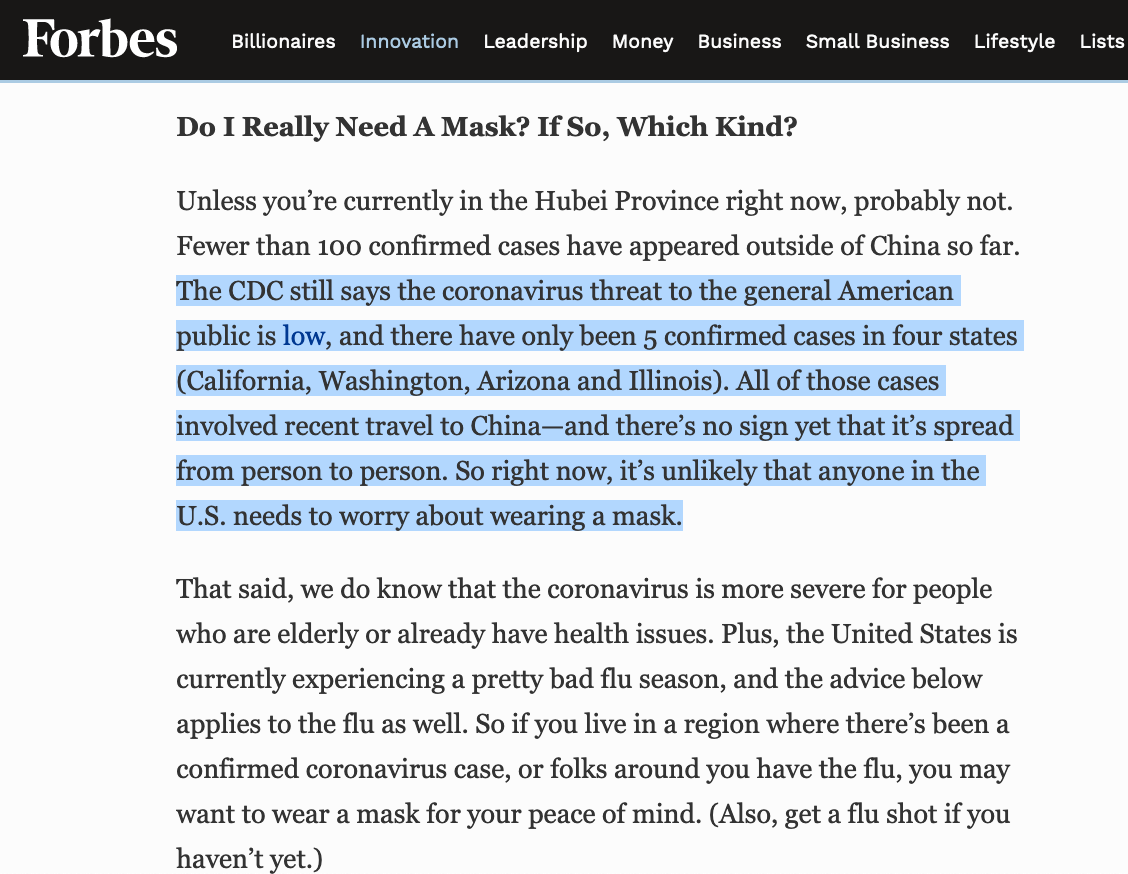
Face mask
-
Gloves and goggles
-
-
Bring our stock home (Protect American first)
-
Make everyone wear a mask and we can open our stores and schools!
Thank you!
Questions and Comments
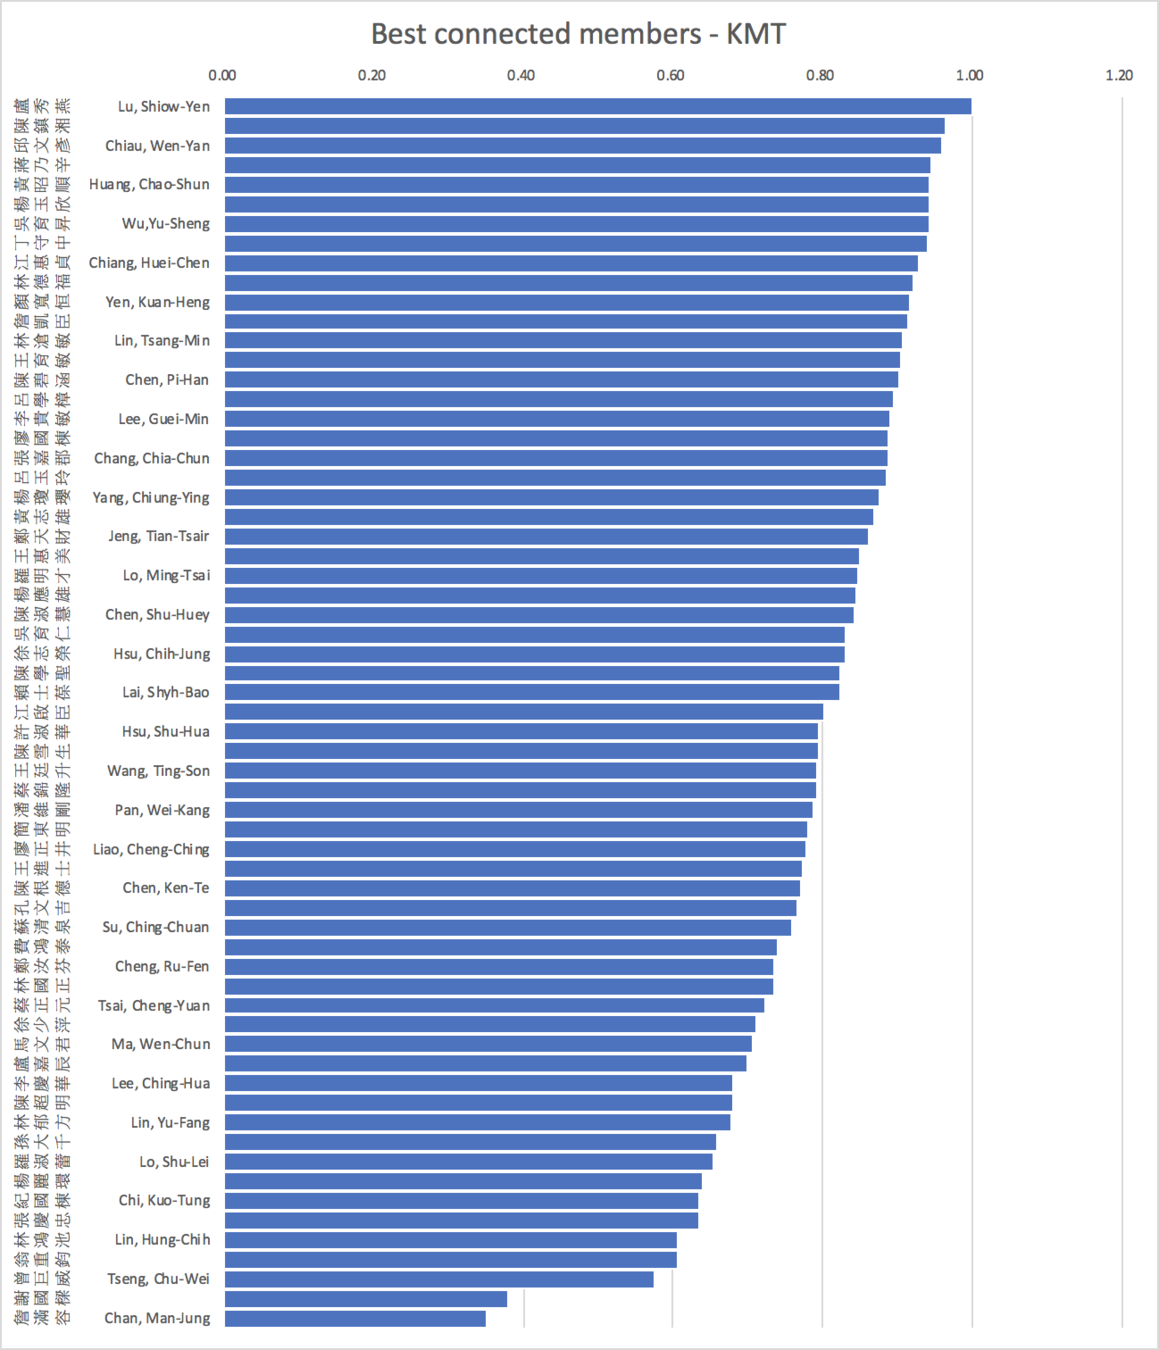
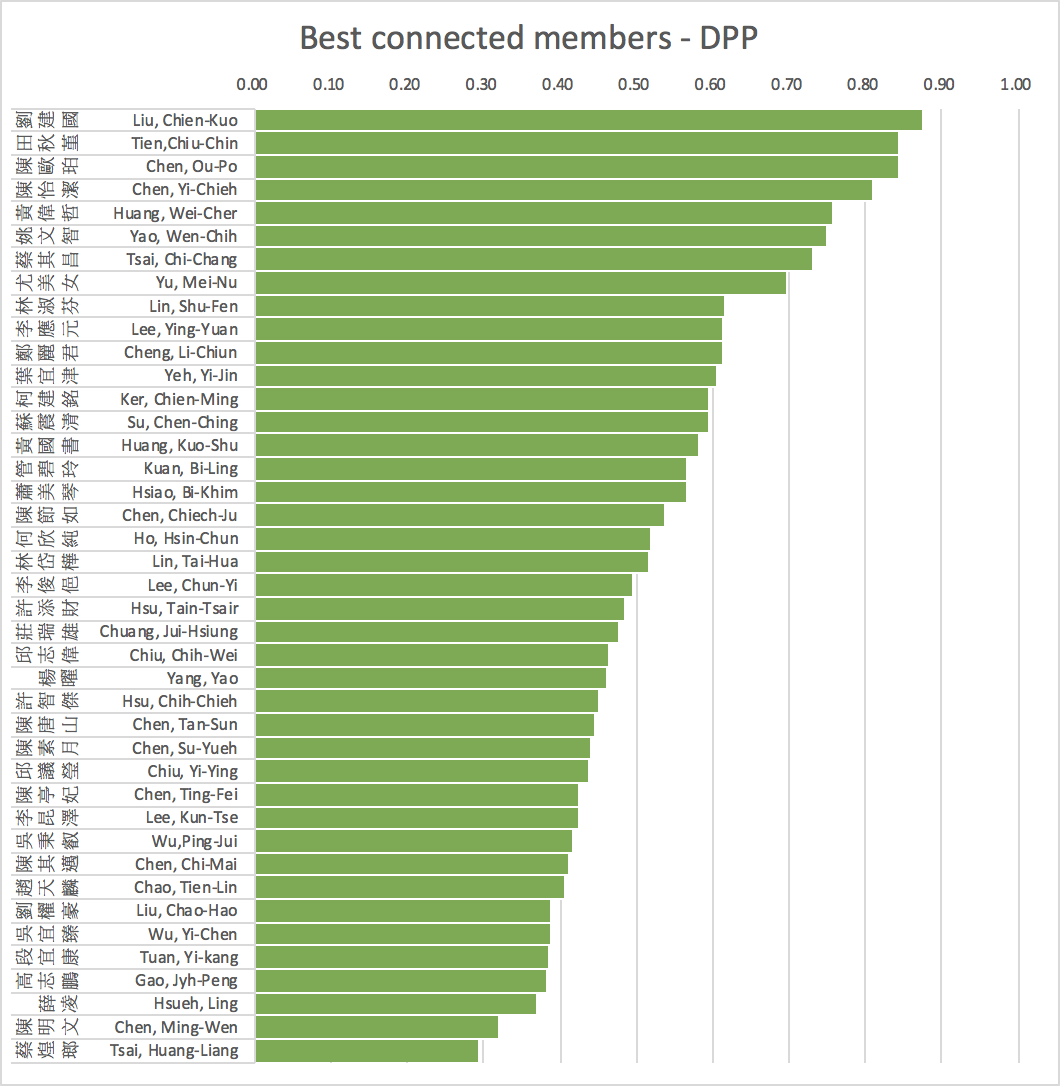
Network structure (Legislative Yuan)
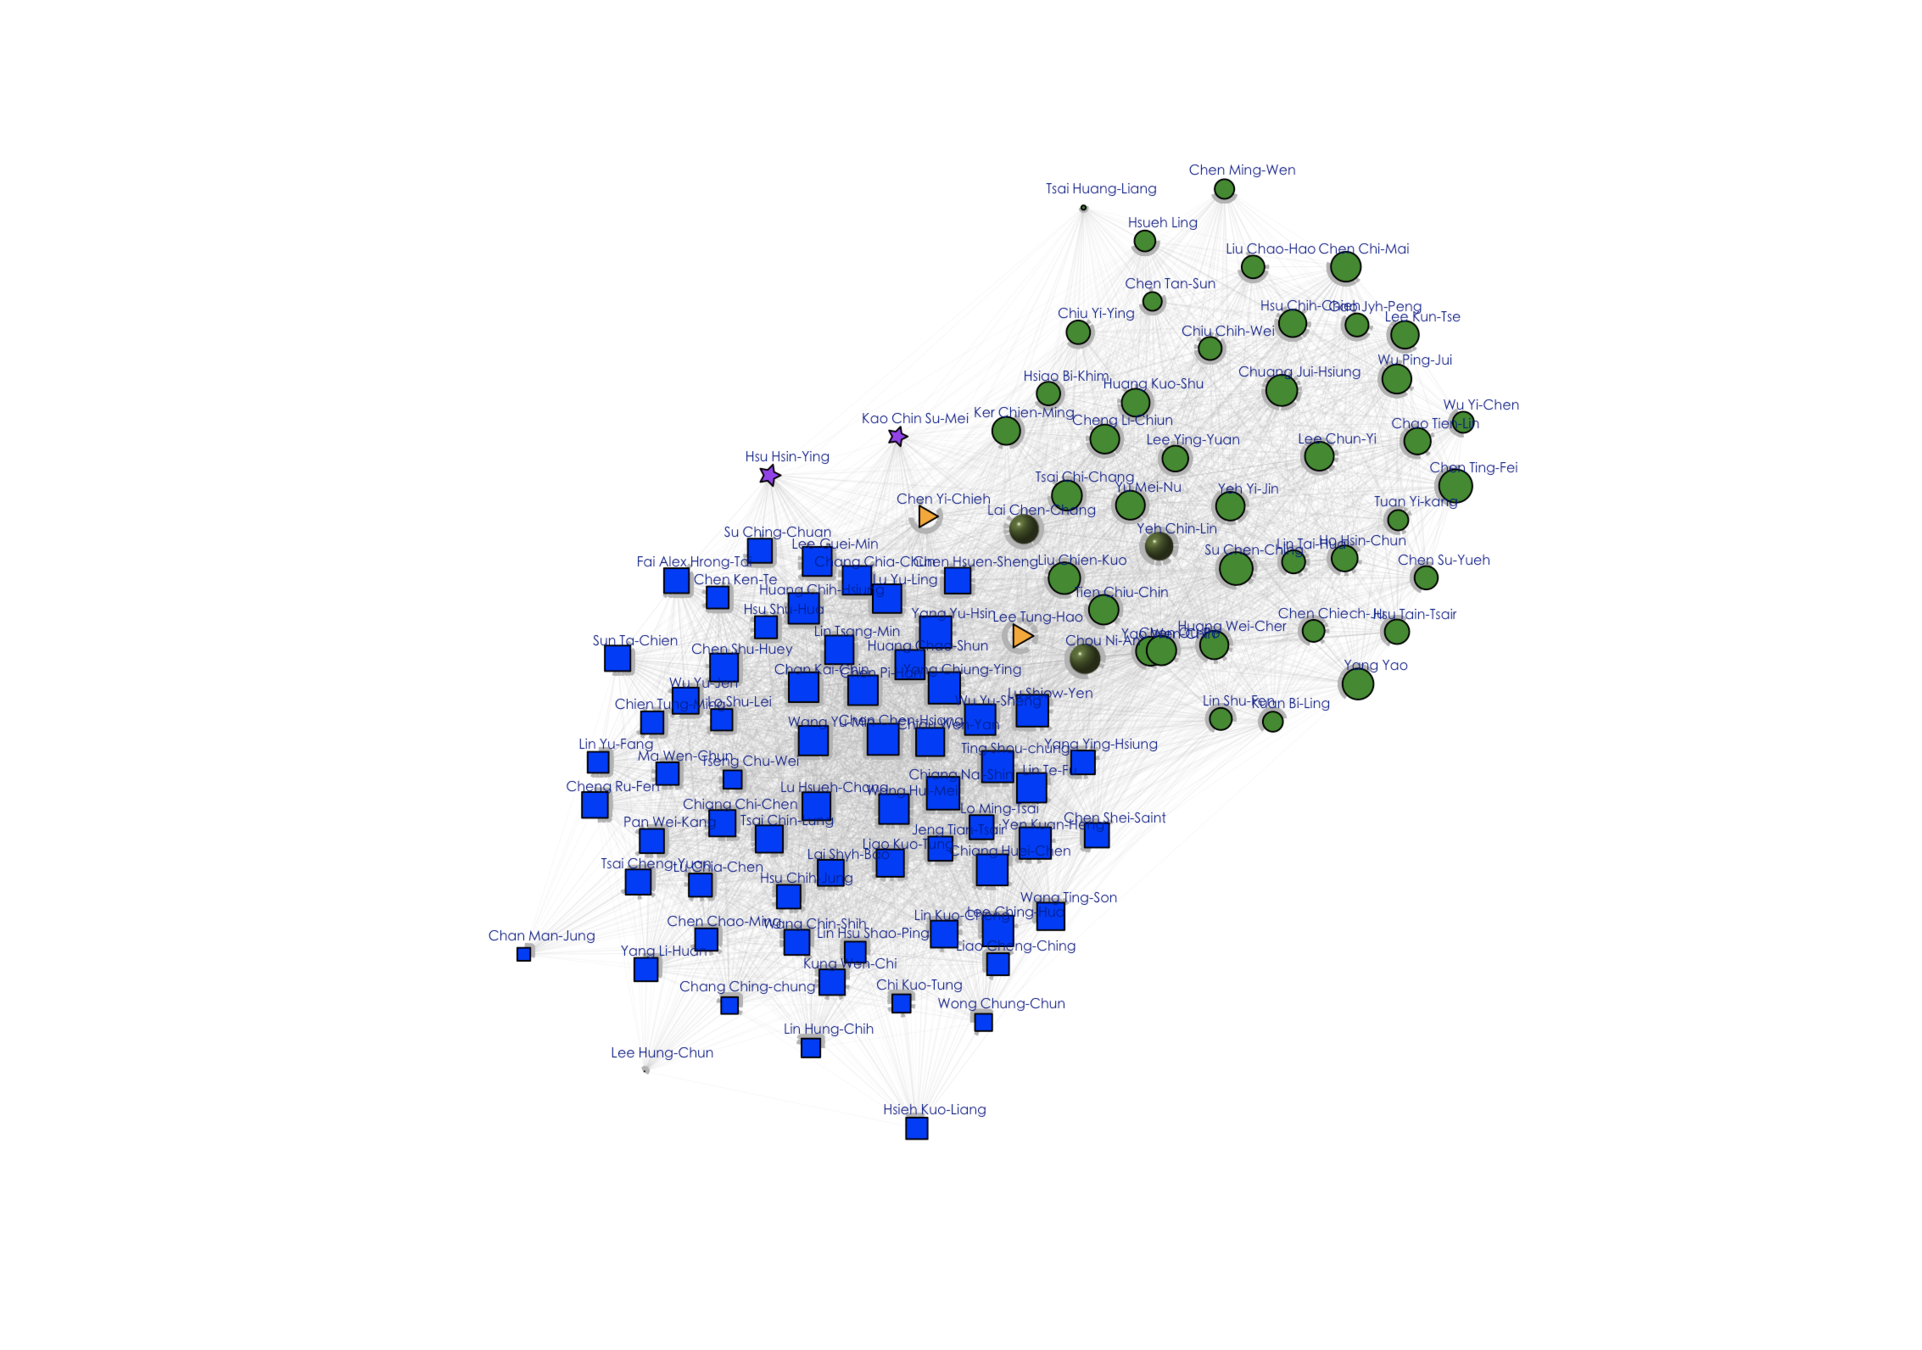
- Colors and shapes represent members of parties.
- Size indicates importance in terms of number of bills and mobilization of cosigners
- Positions indicate distances from other networks and within own network.
Network structure (Community)
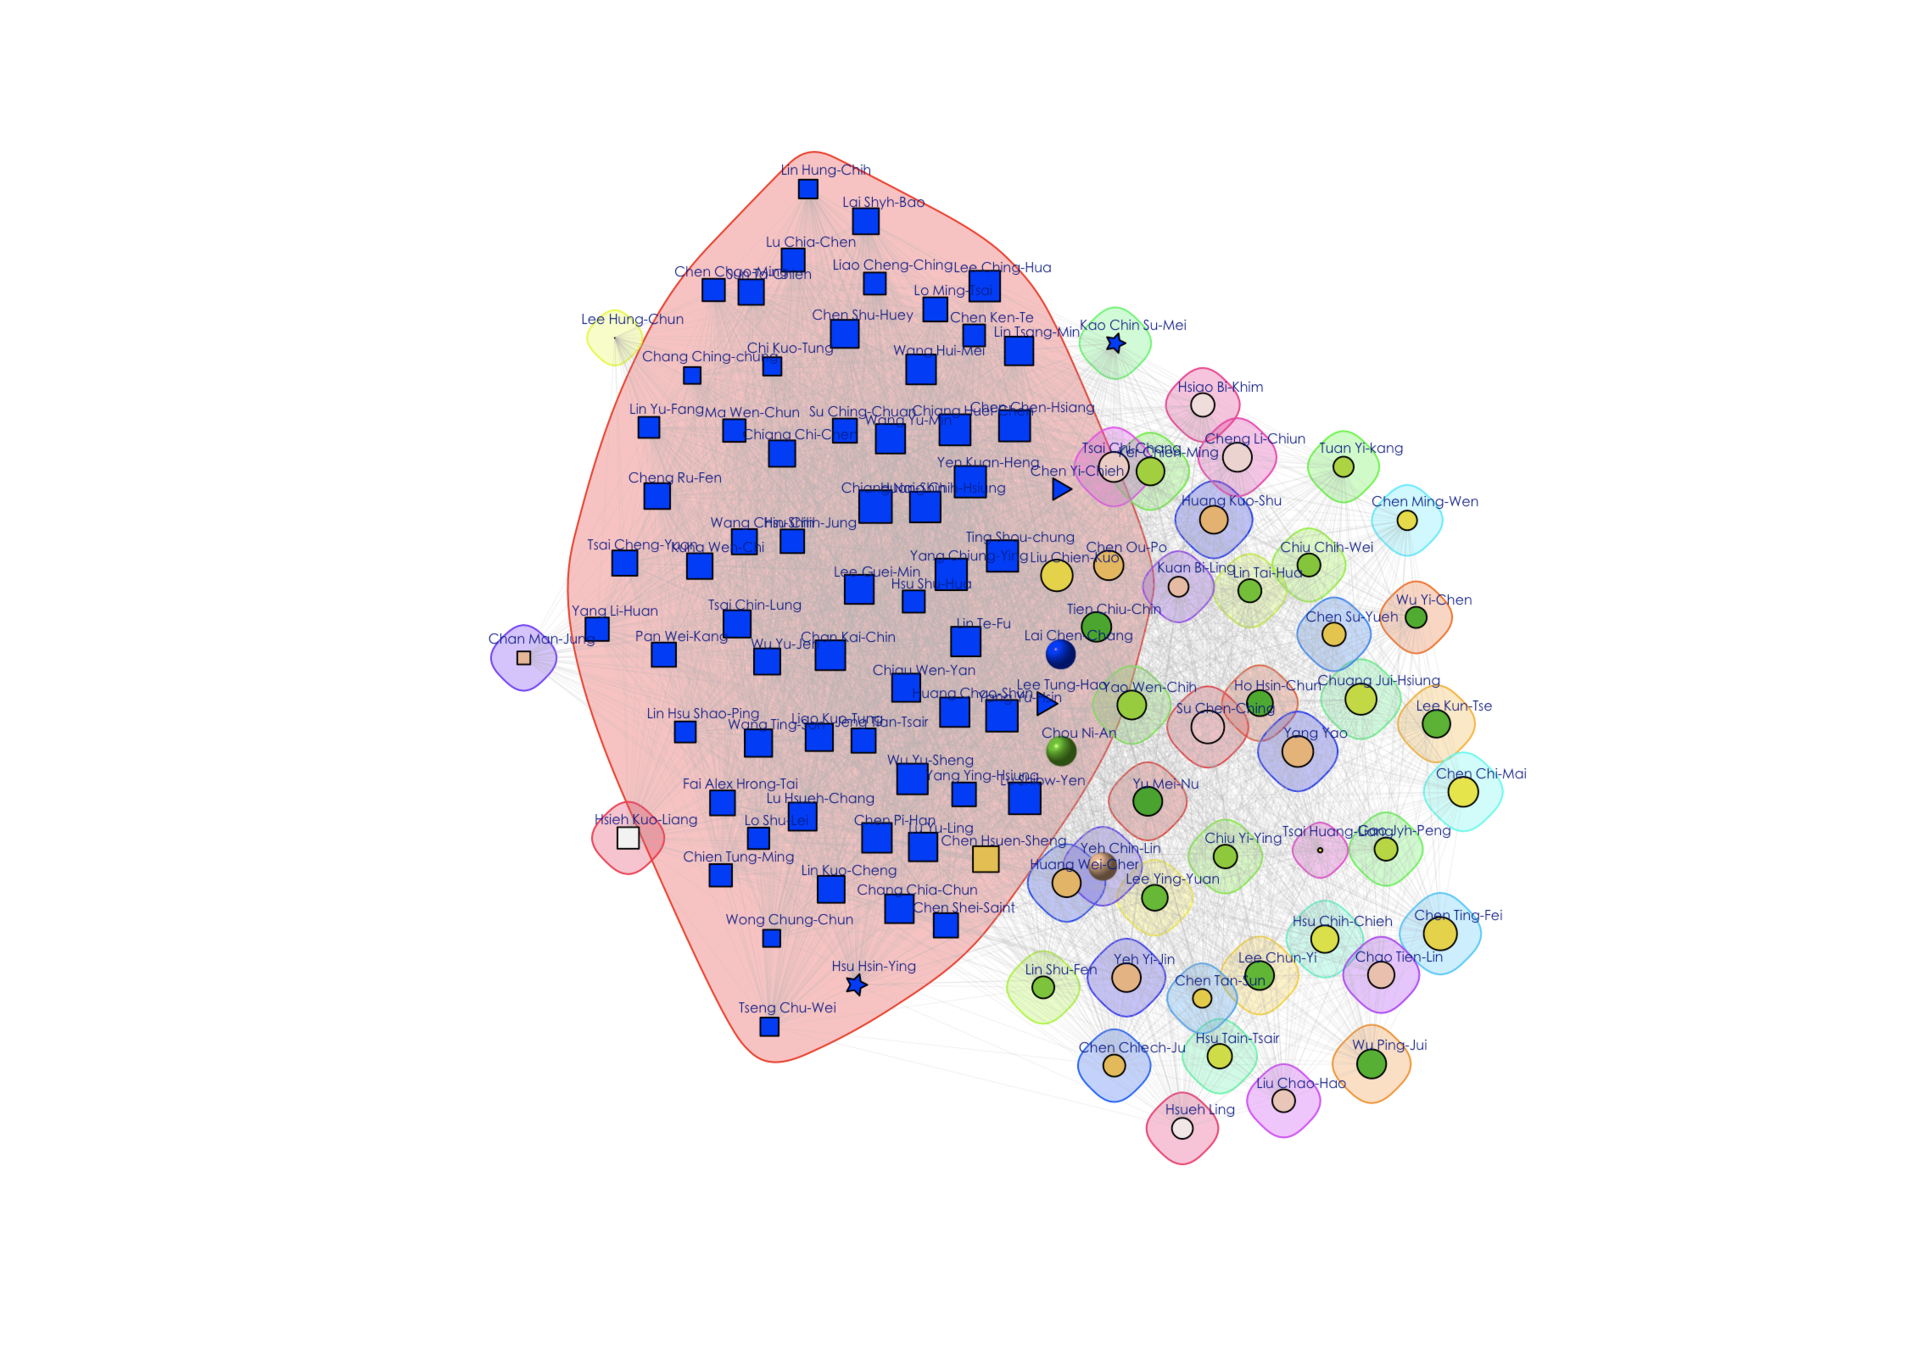
Network structure (Community)
average=0.79 s.d.=0.13 skewness= -1.12
average=0.54 s.d.=0.15 skewness=0.72
Retweet daily sums and counts
July 27, 2018-September 8, 2018