Introduction
Karl Ho
School of Economic, Political and Policy Sciences
University of Texas at Dallas
Data Programming with R
-
Karl Ho is:
- Professor of Instruction at University of Texas at Dallas (UTD) School of Economic, Political and Policy Sciences (EPPS)
- Co-founder of the UTD Social Data Analytics and Research program (SDAR)
- Founder of DataGeneration.org
- Author of Data Programming
- Co-Principal Investigator of the Hong Kong Election Study project
- Website: karlho.com (talks, lecture, publications)
Speaker bio.
Overview:
- What is programming?
-
Data Programming
-
Data Acquisition
-
Data Visualization
- Programming is a practice of using programming language to design, perform and evaluate tasks using a computer. These tasks include:
- Computation
- Data collection
- Data management
- Data visualization
- Data modeling
- In this course, we focus on data programming, which emphasizes programs dealing with and evolving with data.
What is programming?
Data programming
}
- Understand the differences between apparently similar constructs in different languages
- Be able to choose a suitable programming language for each application
- Enhance fluency in existing languages and ability to learn new languages
- Application development
Why learning programming Languages?
- Maribel Fernandez 2014
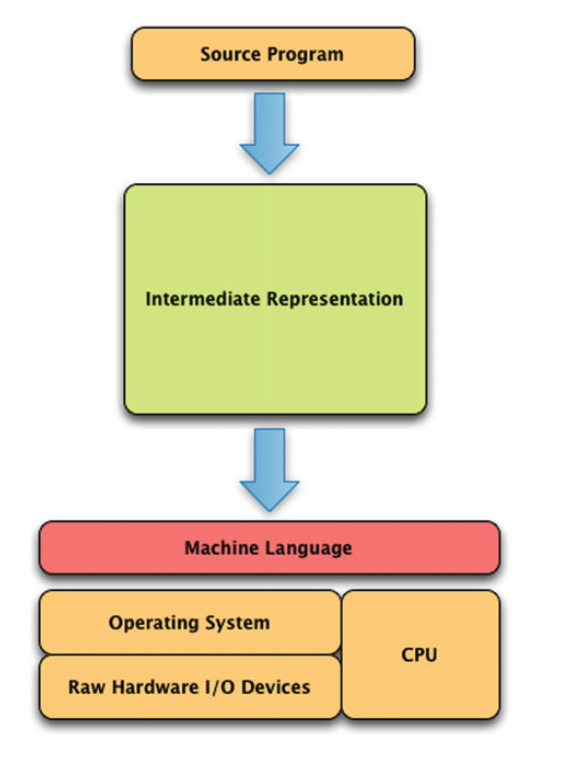
Language implementations
Compilation
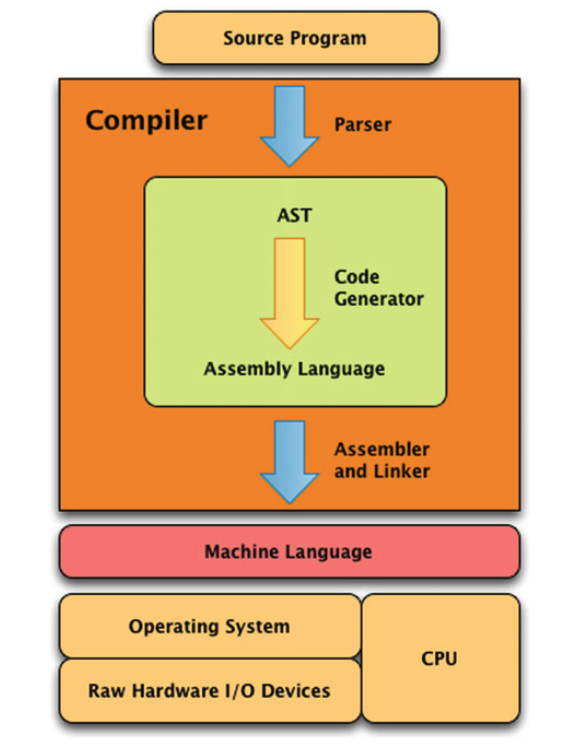
Interpretation

- Machine language
- Assembly language
- C
Low-level languages
- BASIC
- REALbasic
- Visual Basic
- C++
- Objective-C
- Mac
- C#
- Windows
- Java
Systems languages
- Perl
- Tcl
- JavaScript
- Python
Scripting languages
Ask me anything!

DRY – Don’t Repeat Yourself
Write a function!
Function example
# Create preload function
# Check if a package is installed.
# If yes, load the library
# If no, install package and load the library

preload<-function(x)
{
  x <- as.character(x)
  if (!require(x,character.only=TRUE))
  {
    install.packages(pkgs=x,  repos="http://cran.r-project.org")
    require(x,character.only=TRUE)
  }
}
Ask me anything!


- For social scientists, programming is more than just developing an application. It could introduce social injustice:
Why learning programming?
learning how to program can significantly enhance how social scientists can think about their studies, and especially those premised on the collection and analysis of digital data.
- Brooker 2019:
Chances are the language you learn today will quite likely not be the language you'll be using tomorrow.
What is R?
R is an integrated suite of software facilities for data manipulation, calculation and graphical display.
- Venables, Smith and the R Core team
- array
- interpreted
- impure
- interactive mode
- list-based
- object-oriented (prototype-based)
- scripting
R
What is R?
-
The R statistical programming language is a free, open source package based on the S language developed by John Chambers.
-
Some history of R and S
-
S was further developed into R by Robert Gentlemen (Canada) and Ross Ihaka (NZ)

Source: Nick Thieme. 2018. R Generation: 25 years of R https://rss.onlinelibrary.wiley.com/doi/10.1111/j.1740-9713.2018.01169.x
What is R?
-
Ihaka, Ross and Robert Gentleman. 1996. R: A language for data analysis and graphics. Journal of Computational and Graphical Statistics, 5(3):299–314
-
Roger Peng's 2015 video of R history
What is R?
It is:
-
Large, probably one of the largest based on the user-written add-ons/procedures
-
Object-oriented
-
Interactive
-
Multiplatform: Windows, Mac, Linux

What is R?
According to John Chambers (2009), six facets of R :
-
an interface to computational procedures of many kinds;
-
interactive, hands-on in real time;
-
functional in its model of programming;
-
object-oriented, “everything is an object”;
-
modular, built from standardized pieces; and,
-
collaborative, a world-wide, open-source effort.
Why R?
-
A programming platform environment
-
Allow development of software/packages by users
-
Currently, the CRAN package repository features 12,108 available packages (as of 1/31/2018).
-
Graphics!!!
-
Comparing R with other software?
Getting the software
-
R home: https://www.r-project.org
-
Downloads: https://cran.r-project.org
-
Select Download R for Windows or Mac or Linux
-
R 4.x
-
Caveat:
-
Frequent updates/upgrades
-
Packages/library
-
Recommended R resources
The R Journal (http://journal.r-project.org/)
Introduction to R by W. N. Venables, D. M. Smith and the R Core Team (http://cran.r-project.org/doc/manuals/R-intro.pdf)
Introduction to R Seminar at UCLA (http://www.ats.ucla.edu/stat/r/seminars/intro.htm)
RStudio
RStudio is a user interface for the statistical programming software R.
-
Object-based environment
-
Window system
-
Point and click operations
-
Coding recommended
-
Expansions and development
RStudio
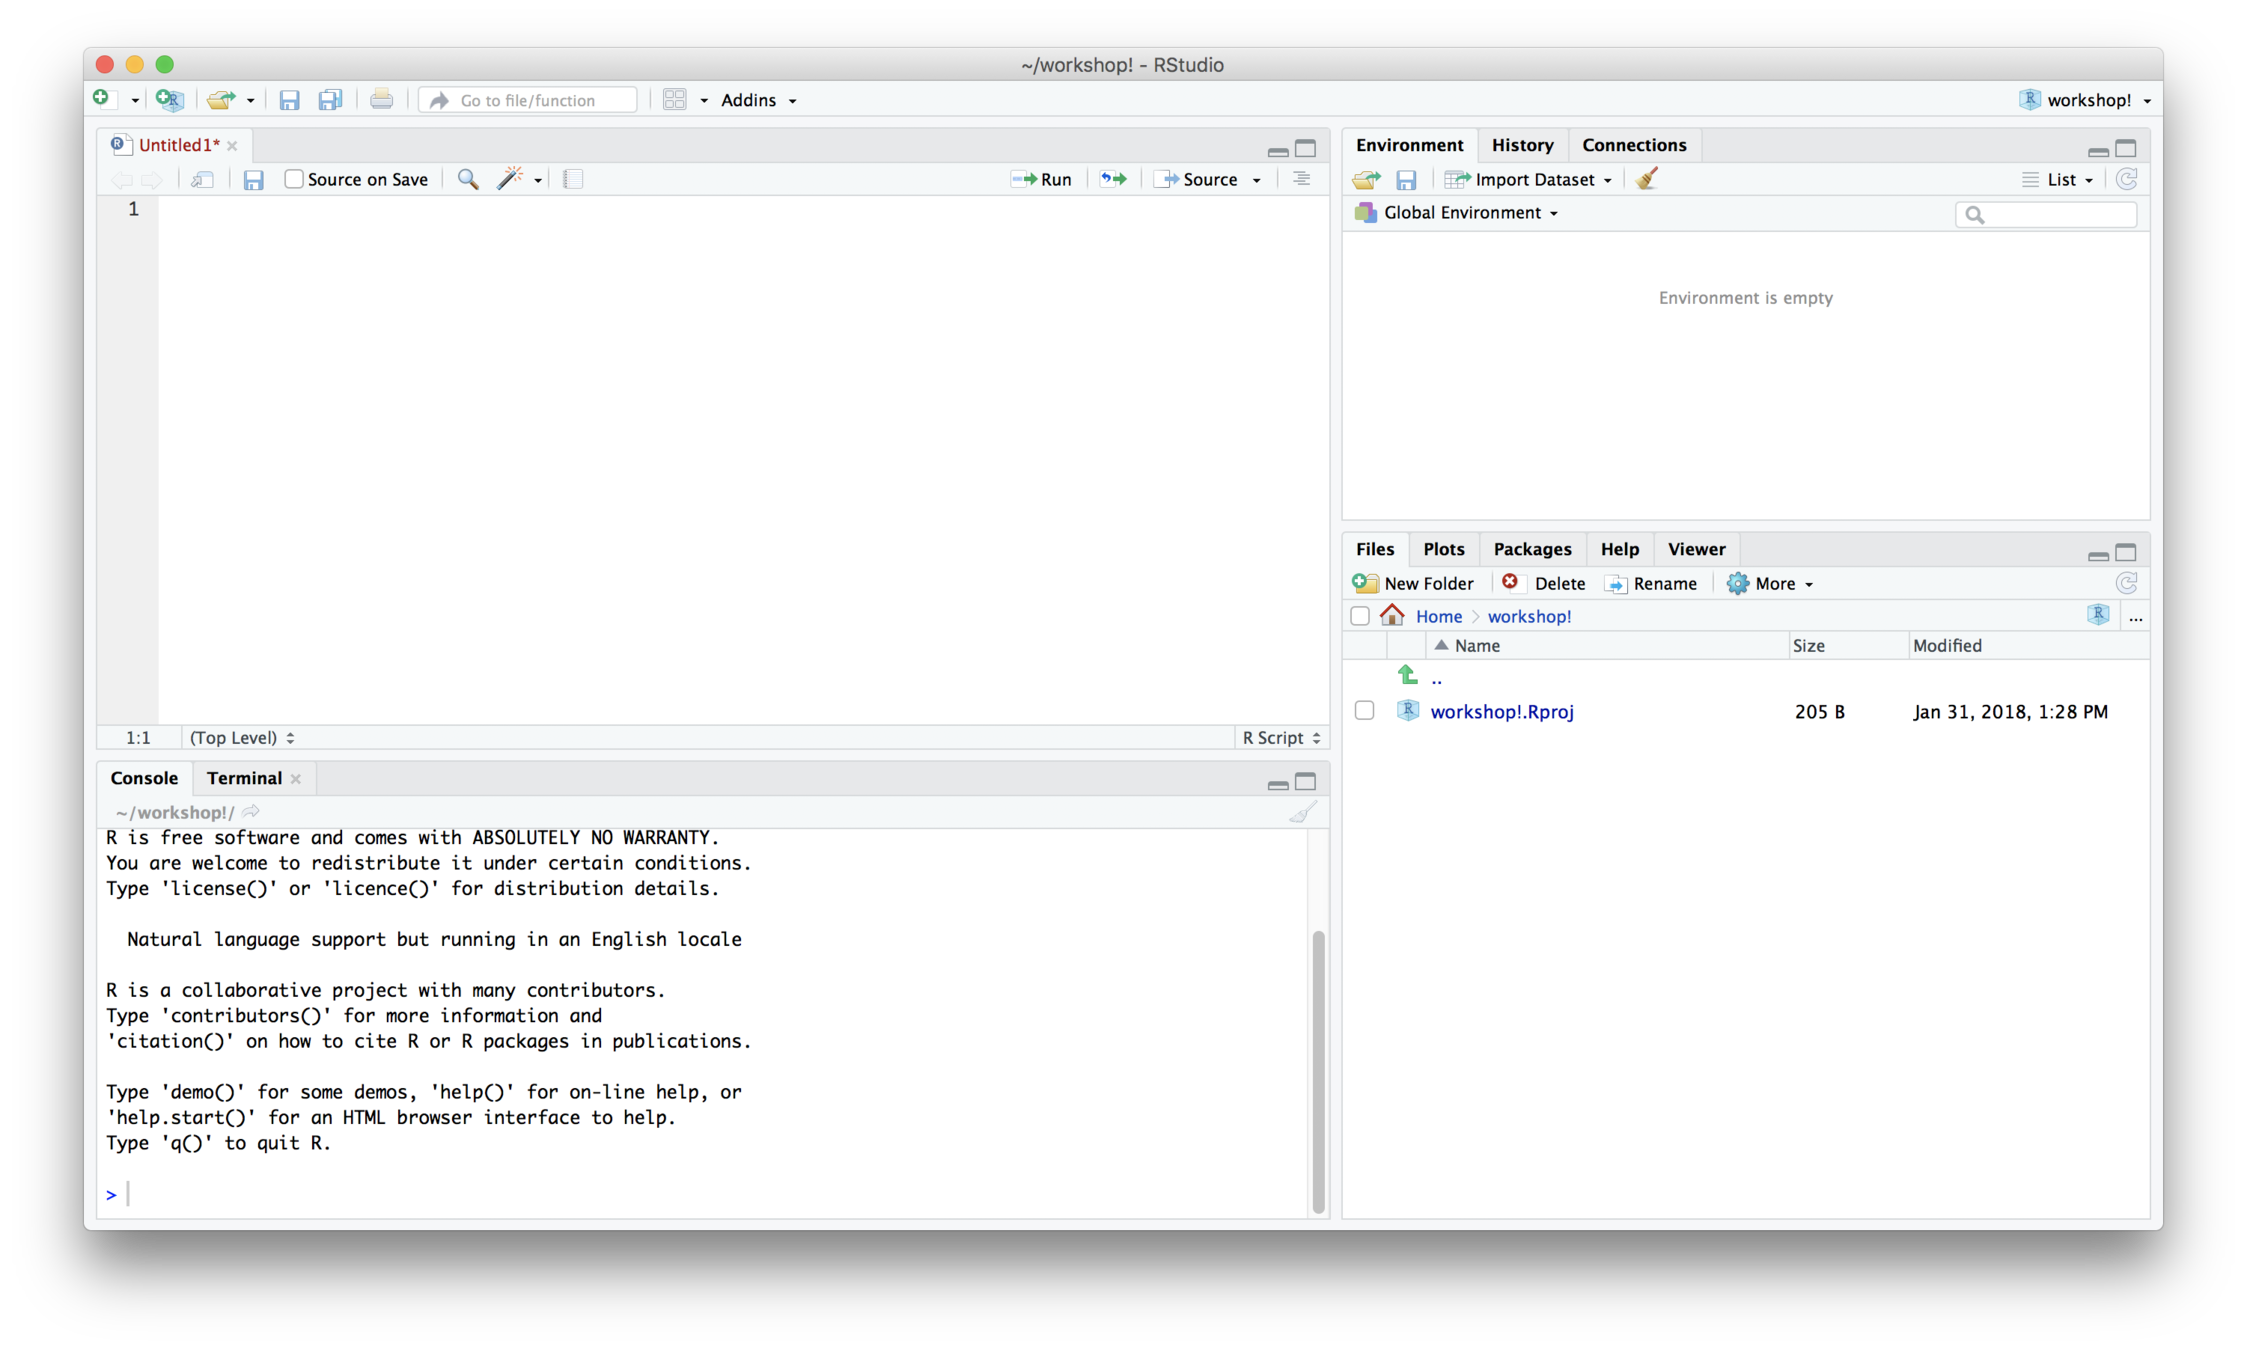
The script window:
You can store a document of commands you used in R to reference later or repeat analyses
Environment:
Lists all of the objects
Console:
Output appears here. The > sign means R is ready to accept commands.
Plot/Help:
Plots appear in this window. You can resize the window if plots appear too small or do not fit.
RStudio
The script window:
You can store a document of commands you used in R to reference later or repeat analyses
Environment:
Lists all of the objects
Console:
Output appears here. The > sign means R is ready to accept commands.
Plot/Help:
Plots appear in this window. You can resize the window if plots appear too small or do not fit.
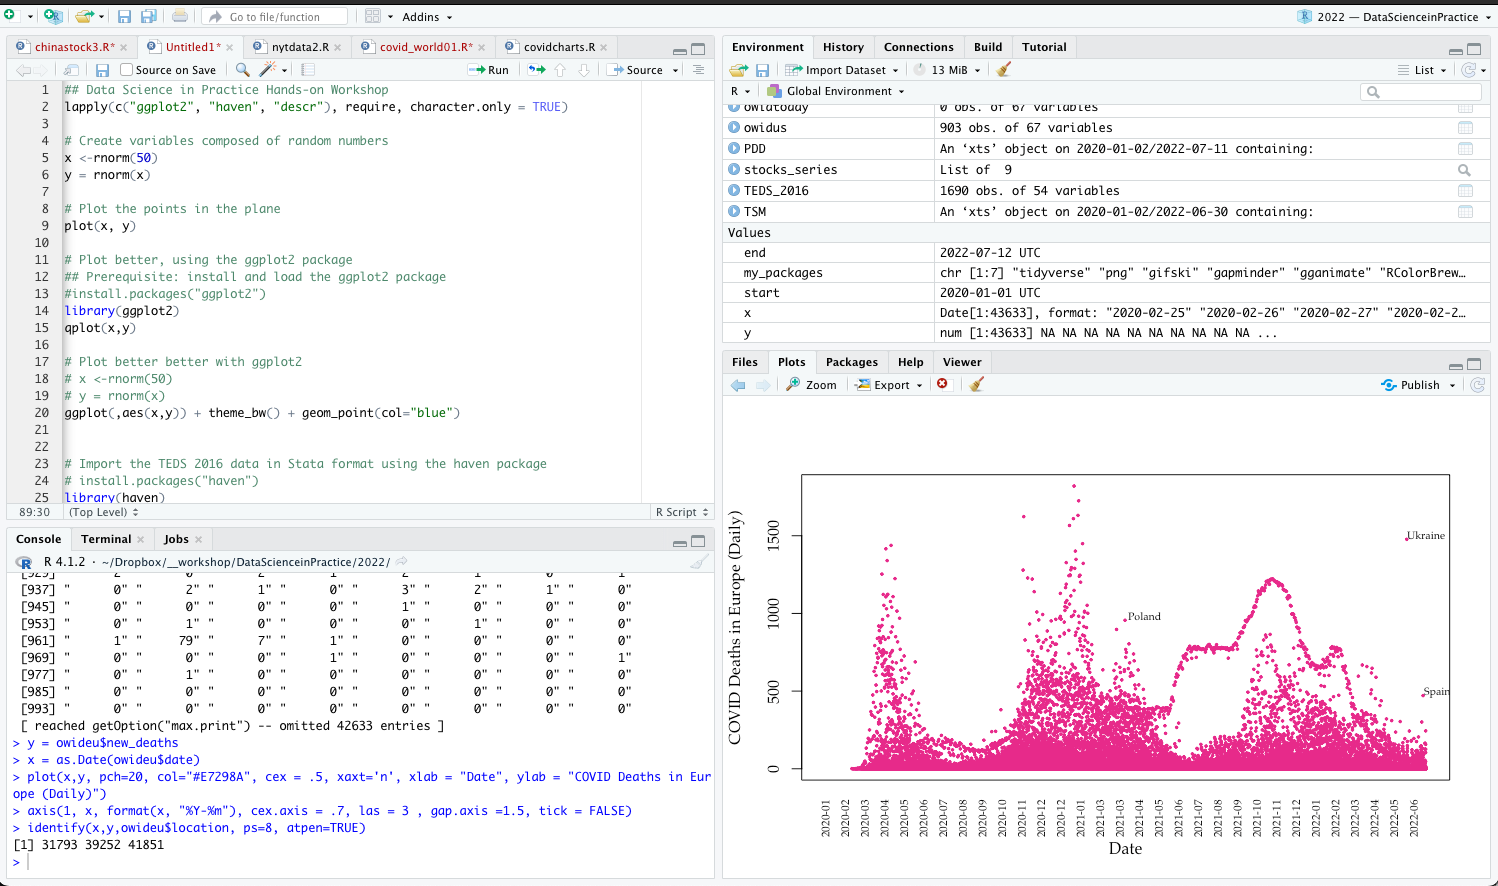
R Programming Basics
-
R code can be entered into the command line directly or saved to a script, which can be run as a script
-
Commands are separated either by a ; or by a newline.
-
R is case sensitive.
-
The # character at the beginning of a line signifies a comment, which is not executed.
-
Help can be accessed by preceding the name of the function with ? (e.g. ?plot).
Importing data
-
Can import from SPSS, Stata and text data file
Use a package called foreign:
First, install.packages(“foreign”), then you can use following codes to import data:
mydata <- read.csv(“path”,sep=“,”,header=TRUE)
mydata.spss <- read.spss(“path”,sep=“,”,header=TRUE)
mydata.dta <- read.dta(“path”,sep=“,”,header=TRUE)
Importing data
Note:
-
R is absolutely case-sensitive
-
R uses extra backslashes to recognize path
-
Read data directly from Github:
happy=read.csv("https://raw.githubusercontent.com/kho7/SPDS/master/R/happy.csv")
Accessing variables
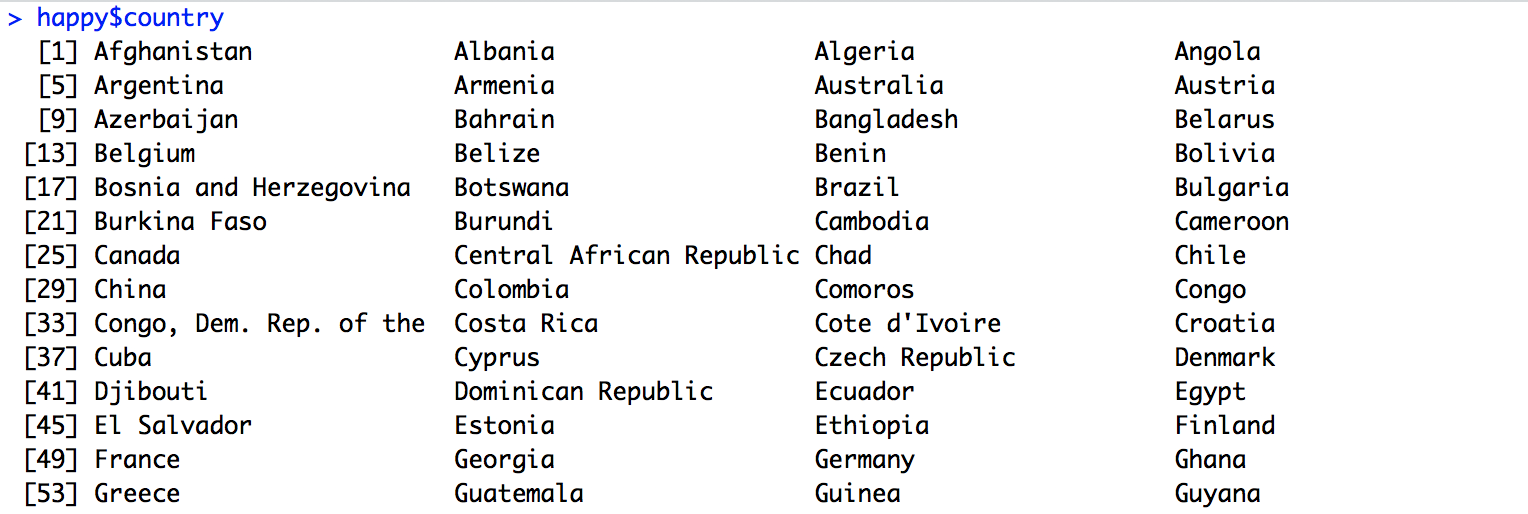
To select a column use:
mydata$column
For example:
Manipulating variables
Recoding variables
For example:
mydata$Age.rec<-recode(mydata$Age, "18:19='18to19'; 20:29='20to29';30:39='30to39'")
Getting started
Difference between c() and paste0()
-
c() cannot concatenate mixed elements
- e.g. vector + strings
- use past0() instead, which operates element-wise and should give a vector of the same length
Timer
-
Very often a procedure will take more time in processing, particularly when involving I/O and highly computational procedures (e.g. machine learning)
-
When starting the prototypical codes, it is important to note the time needed and revise codes or look for better software to cut time
Timer
-
Simple method
start.time <- Sys.time() # use base function
message("Start....")
.... # Procedure codes
message("Done!")
end.time <- Sys.time()
time.taken <- end.time - start.time
time.taken-
Use packages
- tictoc
library(tictoc)
tic("message")
.... # Procedure codes
toc("message")-
Use vectorization: Vectorization is a technique for performing operations on entire vectors or matrices at once, rather than looping through each element. This can significantly speed up R code.
Tips for optimizing R code for better performance
-
Use efficient data structures: R has several data structures, such as data frames and lists, that are optimized for different types of operations. Choosing the right data structure for a given task can improve performance.
Tips for optimizing R code for better performance
-
Avoid unnecessary copying: R creates copies of objects when they are modified, which can be slow for large objects. Using in-place modification or avoiding modification altogether can improve performance.
Tips for optimizing R code for better performance
-
Use parallel processing: R has several packages, such as parallel and foreach, that allow for parallel processing. This can speed up computations on multi-core machines.
Tips for optimizing R code for better performance
-
Use memoization: Memoization is a technique for caching the results of expensive computations so that they can be reused later. This can speed up computations that are repeated frequently.
Tips for optimizing R code for better performance
-
Use Rcpp: Rcpp is a package that allows for integration of C++ code with R. This can significantly improve performance for computationally intensive tasks.
Tips for optimizing R code for better performance
-
Core/processor
-
A core is a general term for either a single processor on your own computer (technically you only have one processor, but a modern processor like the i7 or M2 can have multiple cores - hence the term) or a single machine in a cluster network.
-
-
Cluster
-
A cluster is a collection of objecting capable of hosting cores, either a network or just the collection of cores
-
-
Process
-
A process is a single running version of R (or more generally any program). Each core runs a single process.
-
Terms
-
Node: A node refers to a physical box or server in a cluster. It typically consists of one or more CPUs, memory, storage, and other components. Nodes are connected to each other through a network and can communicate with each other to perform parallel computing tasks.
Terms
-
User time:
-
the amount of CPU time spent by the current process (i.e., the current R session) executing the expression. It measures the time spent executing user-level code, such as loops, conditionals, and function calls.
-
-
System time:
-
the amount of CPU time spent by the kernel (the operating system) on behalf of the current process executing the expression. It measures the time spent executing system-level code, such as opening files, doing input or output, starting other processes, and looking at the system clock.
-
-
Elapsed time:
-
the wall clock time taken to execute the expression. It measures the total time taken to execute the expression, including time spent waiting for input or output, time spent waiting for other processes to complete, and time spent waiting for the CPU to become available.
-
Terms
-
Socket
-
socket launches a new version of R on each core. Technically this connection is done via networking (e.g. the same as connecting to a remote server), but the connection is happening all on local computer.
-
works on all platforms including Windows and MacOS
-
Pro:
-
Each process on each node is unique so it can’t cross-contaminate.
-
-
Con:
-
Each process is unique so it will be slower
-
Package loading need to be done in each process separately. Variables defined on main version of R do not exist on each core unless explicitly placed there.
-
More complicated to implement.
-
-
Terms
- Forking
- Forking copies the entire current version of R and moves it to a new core.
- Only for MacOS and Linux
- Pro:
- Faster than sockets.
- Because it copies the existing version of R, your entire workspace exists in each process.
- Easy to implement.
- Con:
- Because processes are duplicates, it can cause issues specifically with random number generation (which should usually be handled by
parallelin the background) or when running in a GUI (such as RStudio).
- Because processes are duplicates, it can cause issues specifically with random number generation (which should usually be handled by
Terms
-
Parallel computing
-
parallel
-
parLapply
-
foreach
-
-
High-Performance Computing (HPC)
-
BatchJobs
-
doAzureParallel
-
future
-
-
Efficient Data Processing
-
sparklyr
-
R packages
Errickson, Josh. Parallel Processing in R
Jones Matt. 2017. Quick introduction to Parallel Computing in R
References
-
doSNOW has the advantage of working on both Windows and Mac OS X.
R packages: doSNOW
Beware of bugs in the above code; I have only proved it correct, not tried it."
- Donald Knuth, author of The Art of Computer Programming
Source: https://www.frontiersofknowledgeawards-fbbva.es/version/edition_2010/
