Messages in Data
Karl Ho
School of Economic, Political and Policy Sciences
University of Texas at Dallas
Data Visualization
Data Story:
Data
Message
Mechanical process
Data Messenger Message
> >
= =
Visualizing Numbers
-
Learn from Journalism
-
What can impress readers?
-
Data, very good data
-
Emotions
-
Art, entertaining, beautiful art
-
-
-
Learn from the best
-
Edward Tufte
-
William Cleveland
-
Leland Wilkinson
What to Visualize?
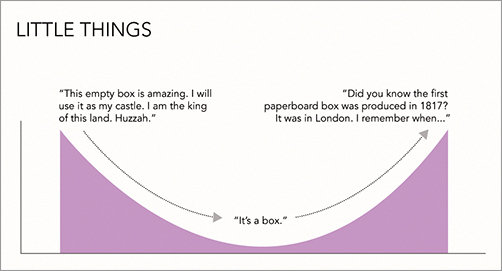
What do you read from this chart?
- Patterns
- Trends
- Questions (puzzling data)
Numbers
-
Numbers vs. ?
-
Zeros and ones
-
Integers (0, 1, 2, 100) vs.
Non-integers (2.5, 3.1416) -
Positive and negative numbers
Quantitative vs. Qualitative Data
-
Numbers vs. Labels
-
Quantity vs. Quality
-
Ordinal, Interval, Ratio vs. Nominal
-
e.g. Yes/No--> Qualitative
-
e.g. How much--> Quantitative
Quantitative vs. Qualitative Data
-
Higher quantity means higher quality?
-
Higher quality leads to higher quantity?
Basics of data organization
-
Variables and observations
-
Alternative terms: Attributes, Features, Fields and cases
-
-
Rows for observations , columns for variables
-
Names and labels
-
Table vs. query
What to visualize in data?
-
Data Generating Process
-
Property
-
Distribution
-
Pattern
-
Differences
-
Relationship
-
Dimensionality
Time series data
-
Nature
-
Temporal dependency: non-stationarity autocorrelation
-
Periodicity: seasonality, cycle
-
-
Zeros -> events?
-
Scale linearity
Event count data
-
Nature
-
Distribution
-
Bounds
-
No upper bounds
-
One lower bound: zero
-
-
Zeros
-
-
Continuous vs. discrete
-
Intervals vs. duration
Bertram M. Gross (1986)
"the world or my part of it is seen as an ongoing stream of events in time . . . Facts and process are separated into discrete elements only by human analysis . . . Change-whether rapid or slow, hidden or open-is continuous."
Anscombe example (1973)
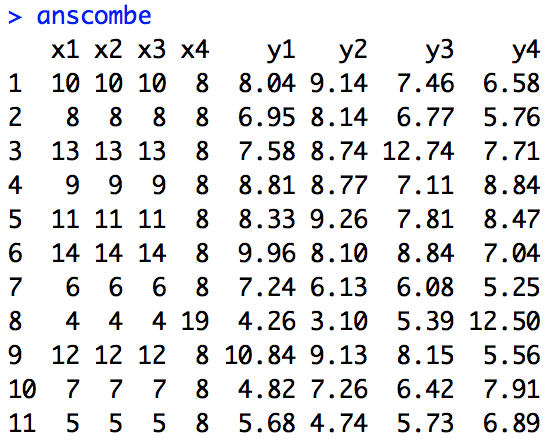
Anscombe example (1973)
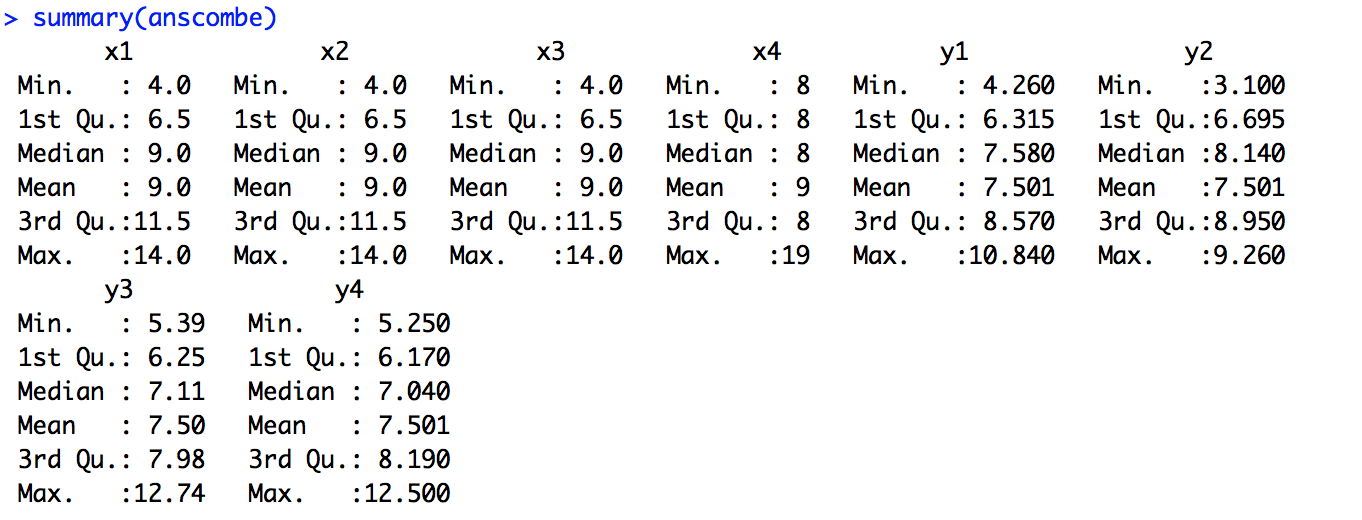
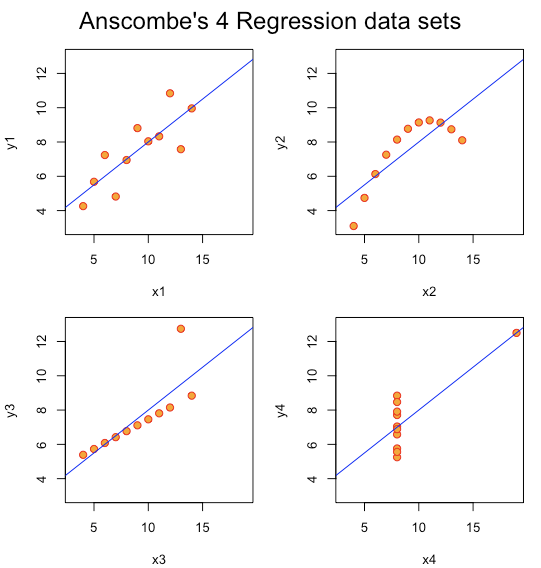
Anscombe example (1973)
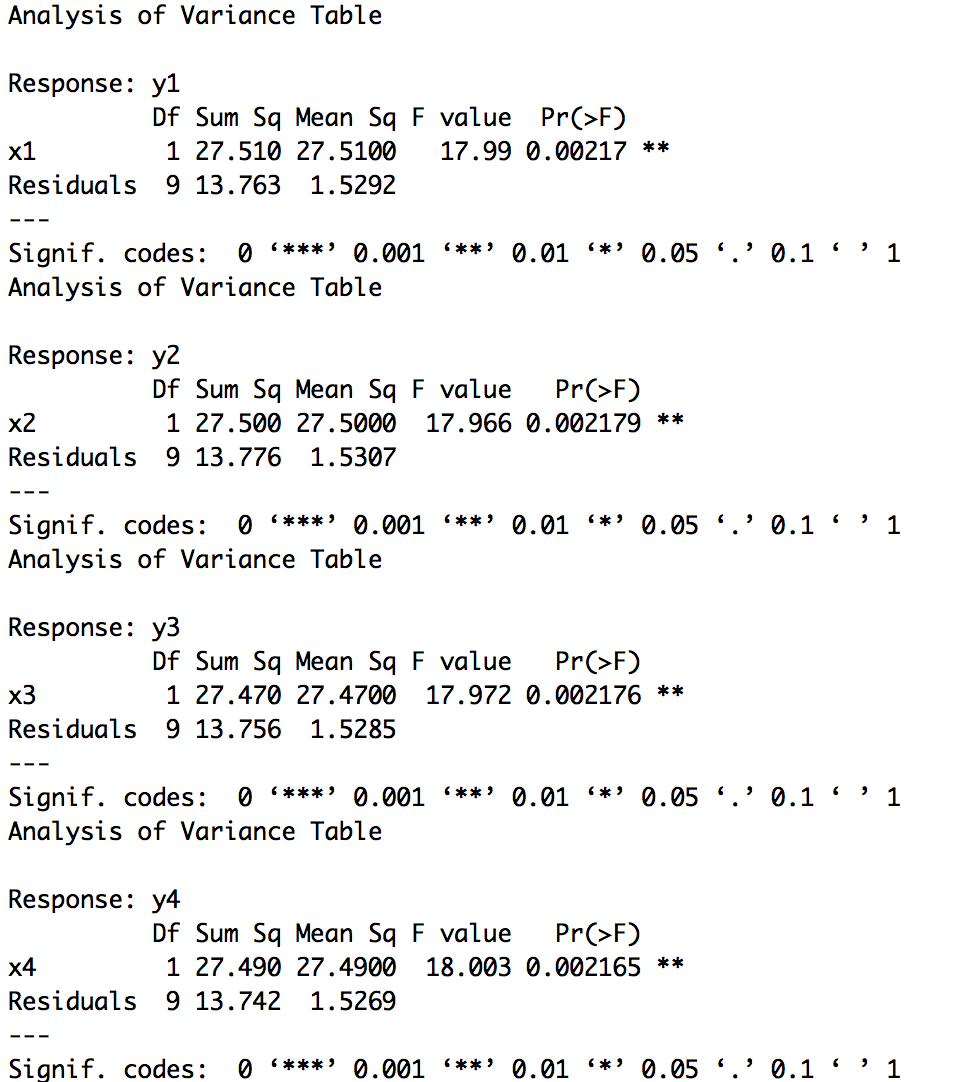
Anscombe example (1973)

Anscombe example (1973)
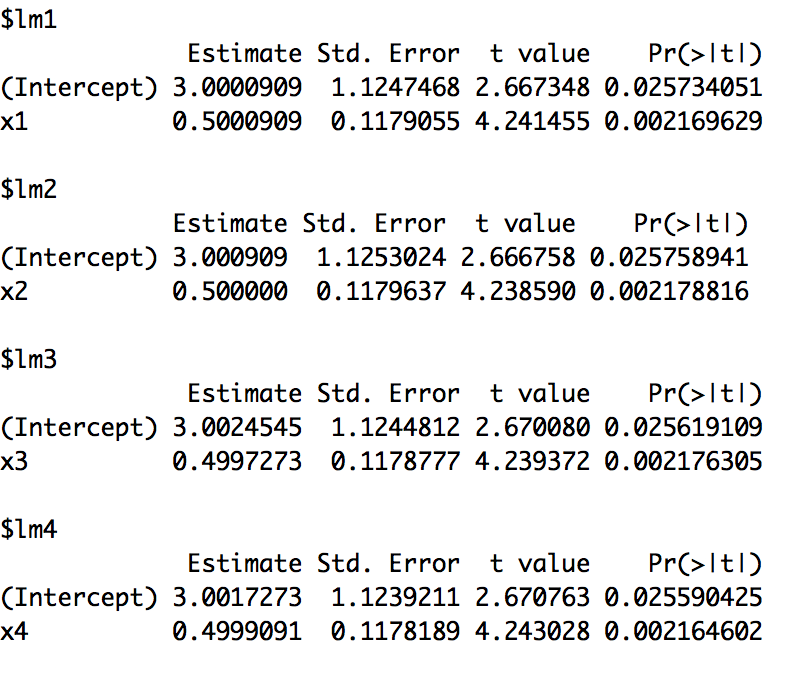
Tufte: Same relationship? (2001)
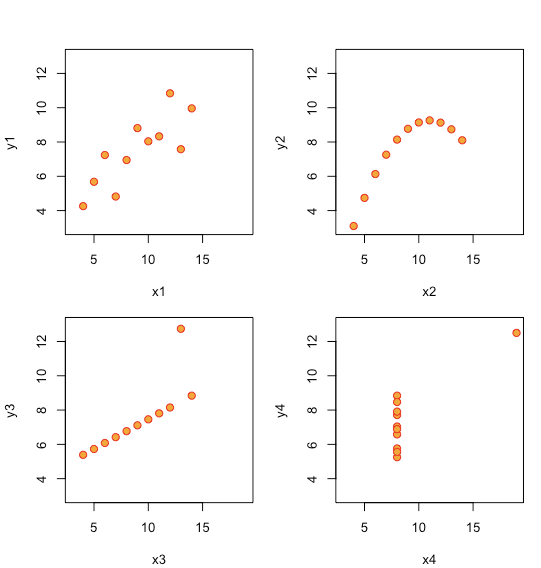
Tufte: Same relationship? (2001)
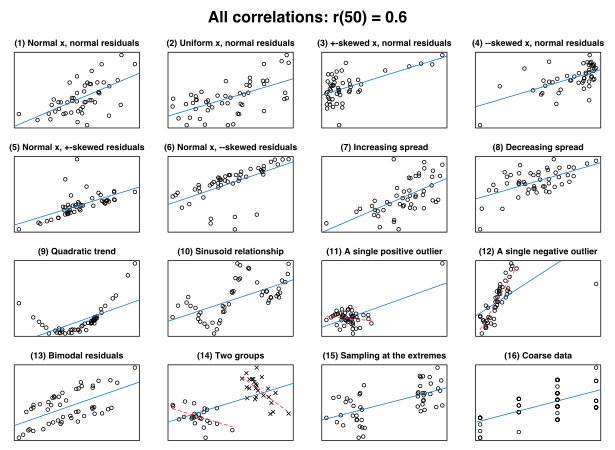
Jan Vanhove example (2016)
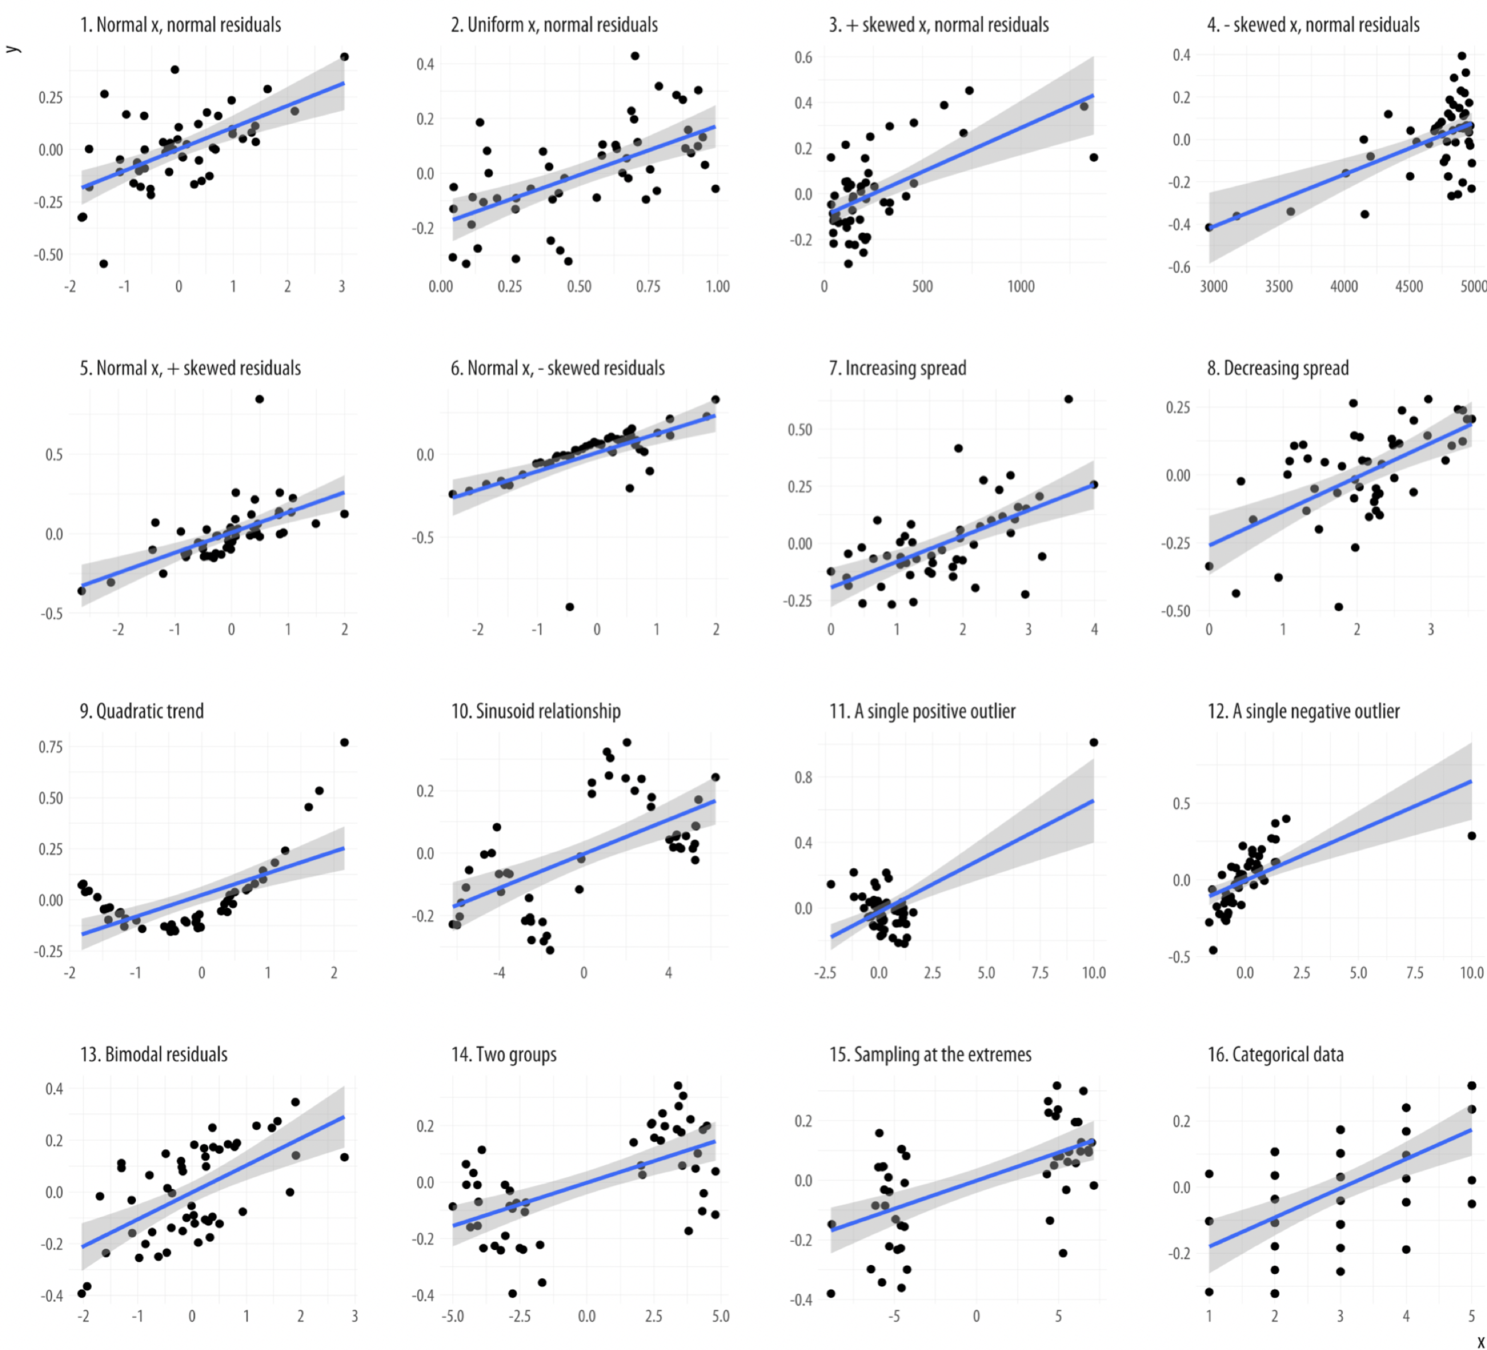
Jan Vanhove example (2016)
Elements of a Chart
-
Dimensionality
-
How many dimensions are there?
-
-
Relationships
-
Strength
-
Fit
-
Error bands
-
Panels
-