Knowledge Mining
Karl Ho
School of Economic, Political and Policy Sciences
University of Texas at Dallas
caret
- The `caret` package (short for Classification And REgression Training) is a comprehensive library authored by Max Kuhn to implement machine learning models.
- It organizes the process of creating, training, and evaluating machine learning models in R under one package.
- The caret package provides a unified interface to numerous machine learning algorithms, simplifying the process of building, training, and evaluating models.
- It streamlines data preprocessing, feature selection, model training, hyperparameter tuning, and performance evaluation.
- The package includes functions for data splitting, pre-processing, feature selection, model tuning using resampling, and variable importance estimation.
What is caret?
- Kuhn, Max and Kjell Johnson. 2013. Applied Predictive Modeling. New York, NY: Springer.
- Kuhn, M. 2008. Building Predictive Models in R Using the caret Package. Journal of Statistical Software, 28(5), 1-26. URL: http://www.jstatsoft.org/v28/i05/.
- Kuhn, Max, Jed Wing, Steve Weston, Andre Williams, Chris Keefer, Allan Engelhardt, Tony Cooper, Zachary Mayer, Brenton Kenkel, and R. Core Team. 2020. "Package ‘caret’." The R Journal 223, no. 7 . https://cran.radicaldevelop.com/web/packages/caret/caret.pdf (2023)
- Official GitHub: https://topepo.github.io/caret/.
What is caret?
Cohen's Kappa adjusts for the possibility of agreement occurring by chance. It ranges from -1 to 1:
- A Kappa of 1 indicates perfect agreement between the model's predictions and the actual labels.
- A Kappa of 0 signifies that the agreement is no better than what would be expected by chance alone.
- A Kappa of -1 indicates complete disagreement between the predictions and actual labels.
Kappa
Kappa is one of the metrics to evaluate the model's performance. The Kappa value, along with other metrics like Accuracy, Sensitivity, and Specificity, can help you better understand the strengths and weaknesses of your model.
- It is important to note that Kappa should be interpreted in the context of the specific problem and dataset you are working with.
- A Kappa value closer to 1 is generally considered good, but it depends on the domain and the problem you are trying to solve.
- In some applications, a Kappa value above 0.6 might be considered satisfactory, while in others, a value above 0.8 might be required.
Kappa
Mean Absolute Error (MAE)
$$ \text{MAE} = \frac{1}{n} \sum_{i=1}^{n} |y_i - \hat{y}_i| $$
Mean Absolute Error is a metric evaluating the performance of regression models. It measures the average of the absolute differences between the predicted values and the actual (ground truth) values. It is a clear, interpretable value representing the average magnitude of the prediction errors, without considering the direction of the error.
where:
- \(n\) is the number of observations in the dataset
- \(y_i\) is the actual value for observation \(i\)
- \(\hat{y}_i\) is the predicted value for observation i
- \(|y_i - \hat{y}_i|\) is the absolute difference between the actual and predicted values
Mean Absolute Error (MAE)
- Lower MAE values indicate better model performance, as the average error between the predicted and actual values is smaller. However, it's essential to interpret the MAE value in the context of the specific problem, as the range of acceptable values may vary depending on the domain and the scale of the target variable.
- When comparing models, the one with the lowest MAE is generally considered to have better predictive performance, assuming the same dataset and target variable.
- However, it's a good idea to consider multiple evaluation metrics, such as RMSE (Root Mean Squared Error) and R-squared, to get a comprehensive understanding of a model's performance.
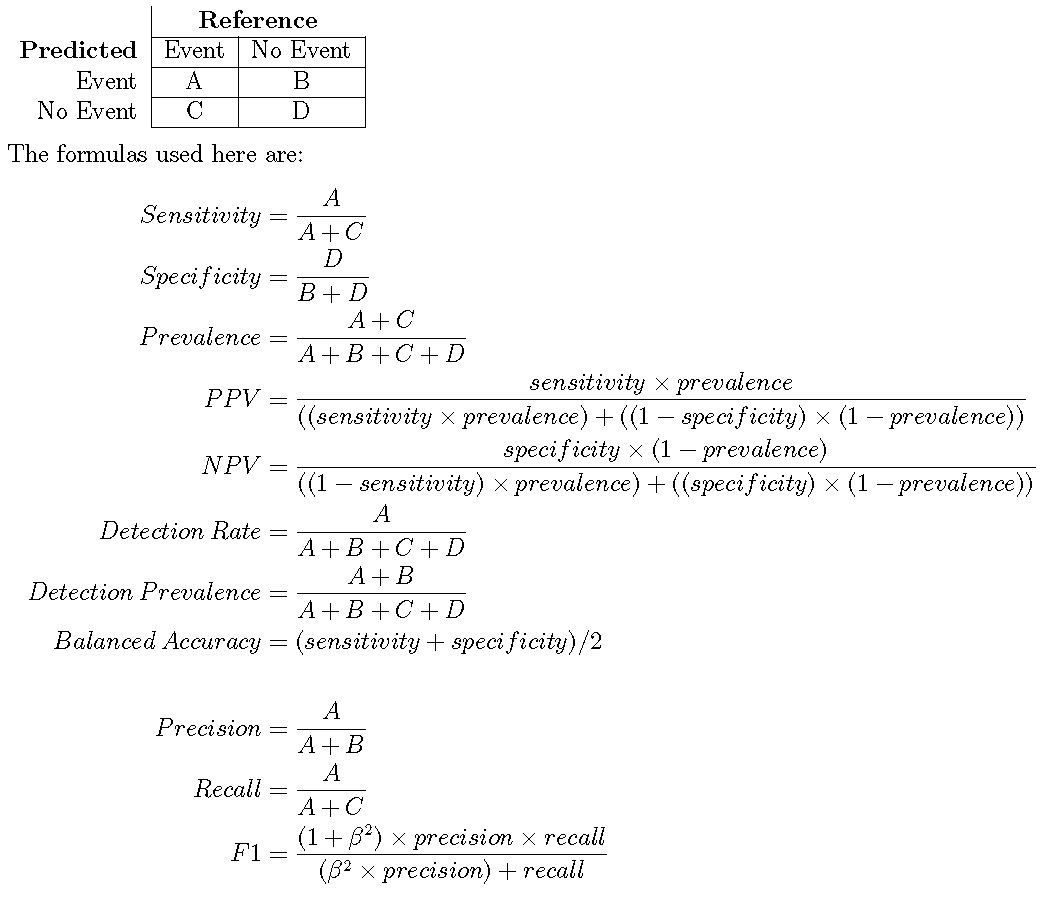
Sensitivity & Specificity

Max Kuhn: The caret package
Sensitivity & Specificity

Max Kuhn: The caret package
A and D are correct predictions