Colors and images
(MMG640 / MVE080)
Overview
- Brief history of color models
- Color models: RGB, HSV, HSL, CMYK
- Color images on the computer
- Loading images in Python (exercise)
- Gray scale images
- 'meshgrid' command
- Creating and saving images in Python (exercise)
- Color maps (gradients)
- Contour plots
slides.com/kmodin/mmg640-colors-images/live#
Pioneers of color models
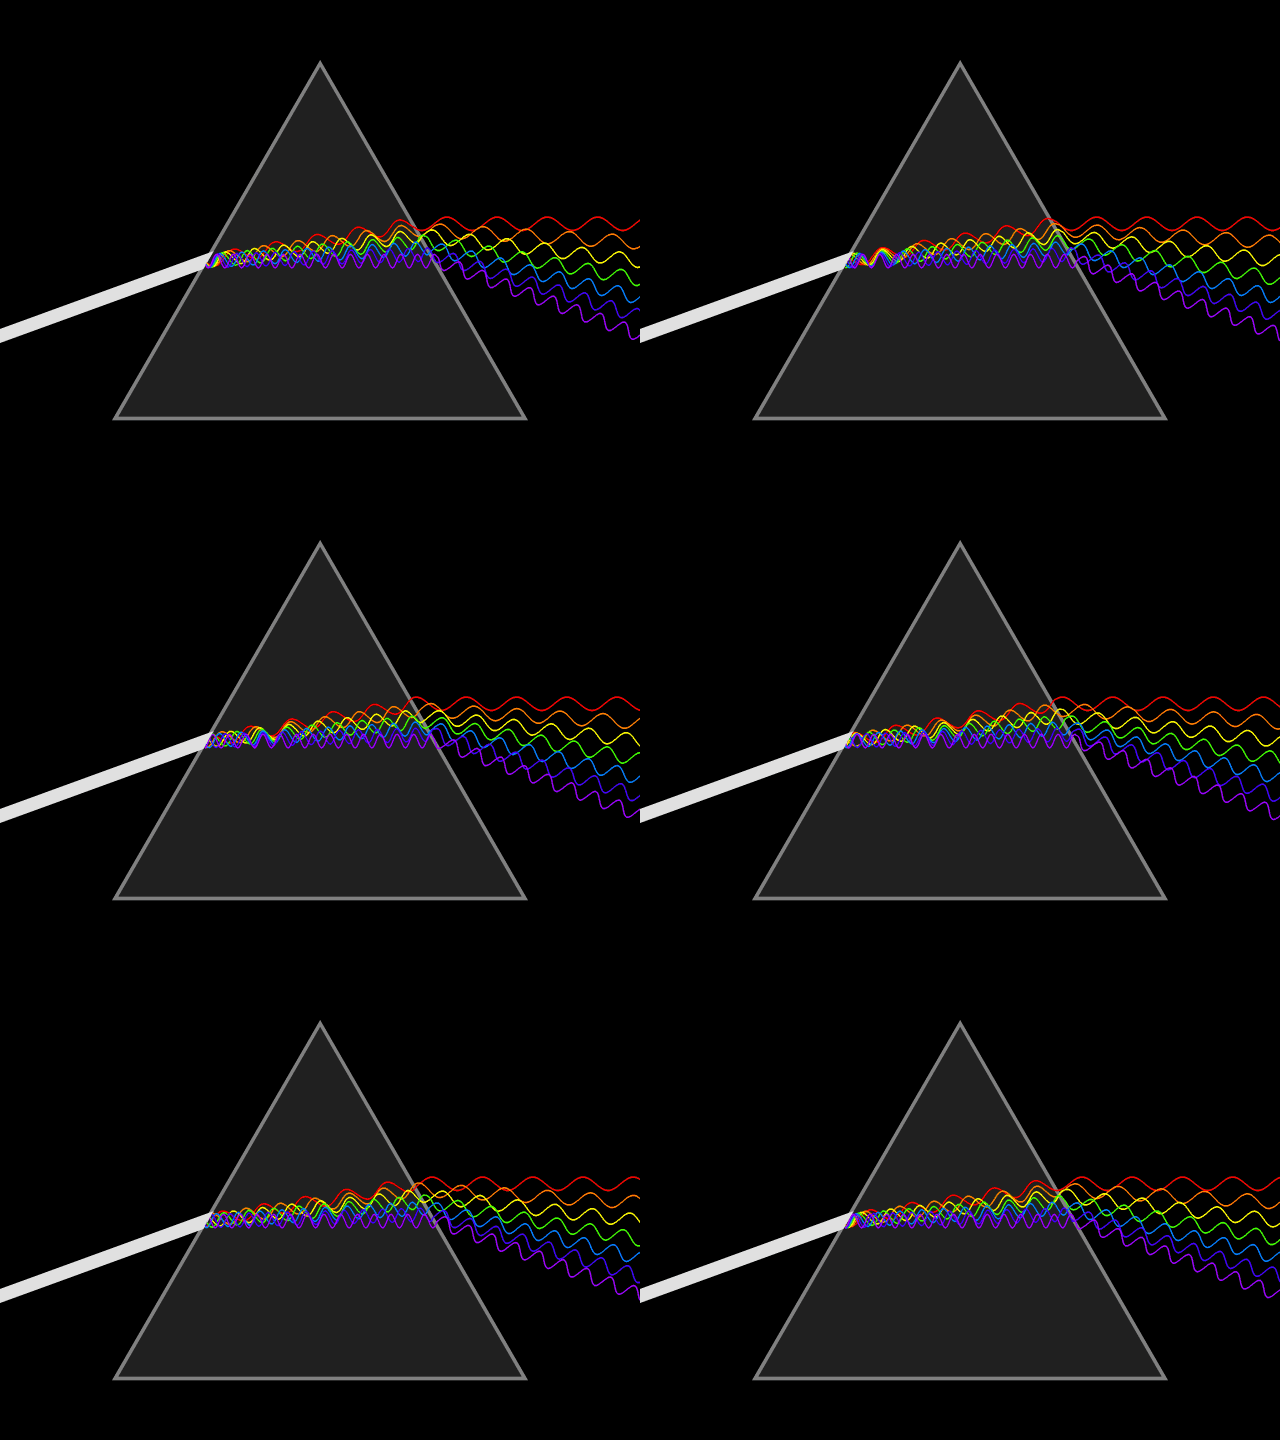
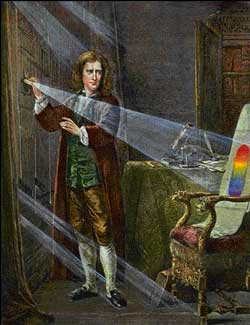
Isaac Newton's prism and color wheel


Other early contributors:
Thomas Young, Hermann von Helmholtz, James Clerk Maxwell
Standard color model: Red Green Blue (RGB)
- Color specified by 3-tuple [R, G, B]
- Each value integer between 0 and 255
- Black is [0, 0, 0]
- White is [255, 255, 255]
- Additive model (large means bright)
Quick quiz:
How many colors can be represented in the RBG model?
Think and discuss with your neighbor
RGB color codes
Typically three different ways
- Decimal, integer [0,255]
Example: [125, 13, 67]
- Decimal, floating-point [0,1] (used in Matplotlib)
Example: [0.5, 0.24353, 0.8983]
- Hexa-decimal (often used in HTML)
Example: #0F3ABC
Quick quiz:
Find web-page for converting between RGB color codes
Quick quiz:
What is the decimal value of #B3 ?
Other color models
HSV (Hue, Saturation, Value)
Resembles the way colors mix spectrally
HSL (Hue, Saturation, Lightness)
Resembles perceptual color models such as the Natural Color System (NCS)


Relation between RGB, HSV, and HSL
Quick quiz:
Explore the Matplotlib commands, 'hsv_to_rgb', and 'rgb_to_hsv'
Color pickers
Color bitmap images
- Array of dimension height*width*3
- Think of it as matrix of 'pixels'
- Each pixel is an RGB tuple
- Sometimes a fourth 'alpha-channel' representing opacity (cf. RGBA)
0 % = fully transparent pixel
100 % = fully opaque pixel
Image file formats
- For storage efficiency, bitmap image arrays are compressed
- Commonly used image file formats:
JPEG (Joint Photographic Experts Group), *.jpg
Lossy compression
Good for photos
GIF (Graphics Interchange Format), *.gif
Lossless compression
Good for few color images: shapes, logos, cartoons
PNG (Portable Network Graphics), *.png
Lossless compression
Modern replacement of GIF, also handles photos
Gray scale images
- Image with only one channel = matrix
- Scalar functions \(f: [a,b]\times[c,d] \to \mathbb{R}\) are usually approximated by gray scale images
-
meshgrid command in Numpy is useful

Example: \(f(x,y) = \sin(x y)\) as gray scale image in Numpy
x = np.arange(-3,4); y = np.arange(-3,3)
xx,yy = np.meshgrid(x,y); ff = np.sin(xx*yy)
xx
yy
Quick quiz:
Modify the example to a much higher resolution
Color maps (gradients)
- Matplotlib function imshow can display gray images
Example (cont.):
>> plt.imshow(ff)

Why is it not in gray scale?
Answer: color map used to assign color to each gray value


A colormap is \(n\times 3\) matrix where \(n\) is number of 'gray levels'
Convert to RGB image
- Matplotlib function imsave can convert gray images to RGB using a specific color map
Example: (with ff as before)
>> imsave('mycolorfunction.jpg', ff, cmap='viridis')
or
>> imsave('mygrayfunction.jpg', ff, cmap='gray')
Contour plots
- Level-set of \(f:[a,b]\times[c,d] \to \mathbb{R}\) is \(S_v = \{ (x,y)\mid f(x,y) = v \}\)
- Each level set gives a curve
- Matplotlib functions contour plots level set curves
Example: (with x,y,ff as before)
>> plt.contour(x,y,ff)
>> plt.colorbar()
