Scientific Visualization (MMG640 / MVE080)
Teacher: Klas Modin
Schedule (normally):
Mon 13:15–15:00
Wed 08:00–11:45
Where: MV:F24-25
Why?
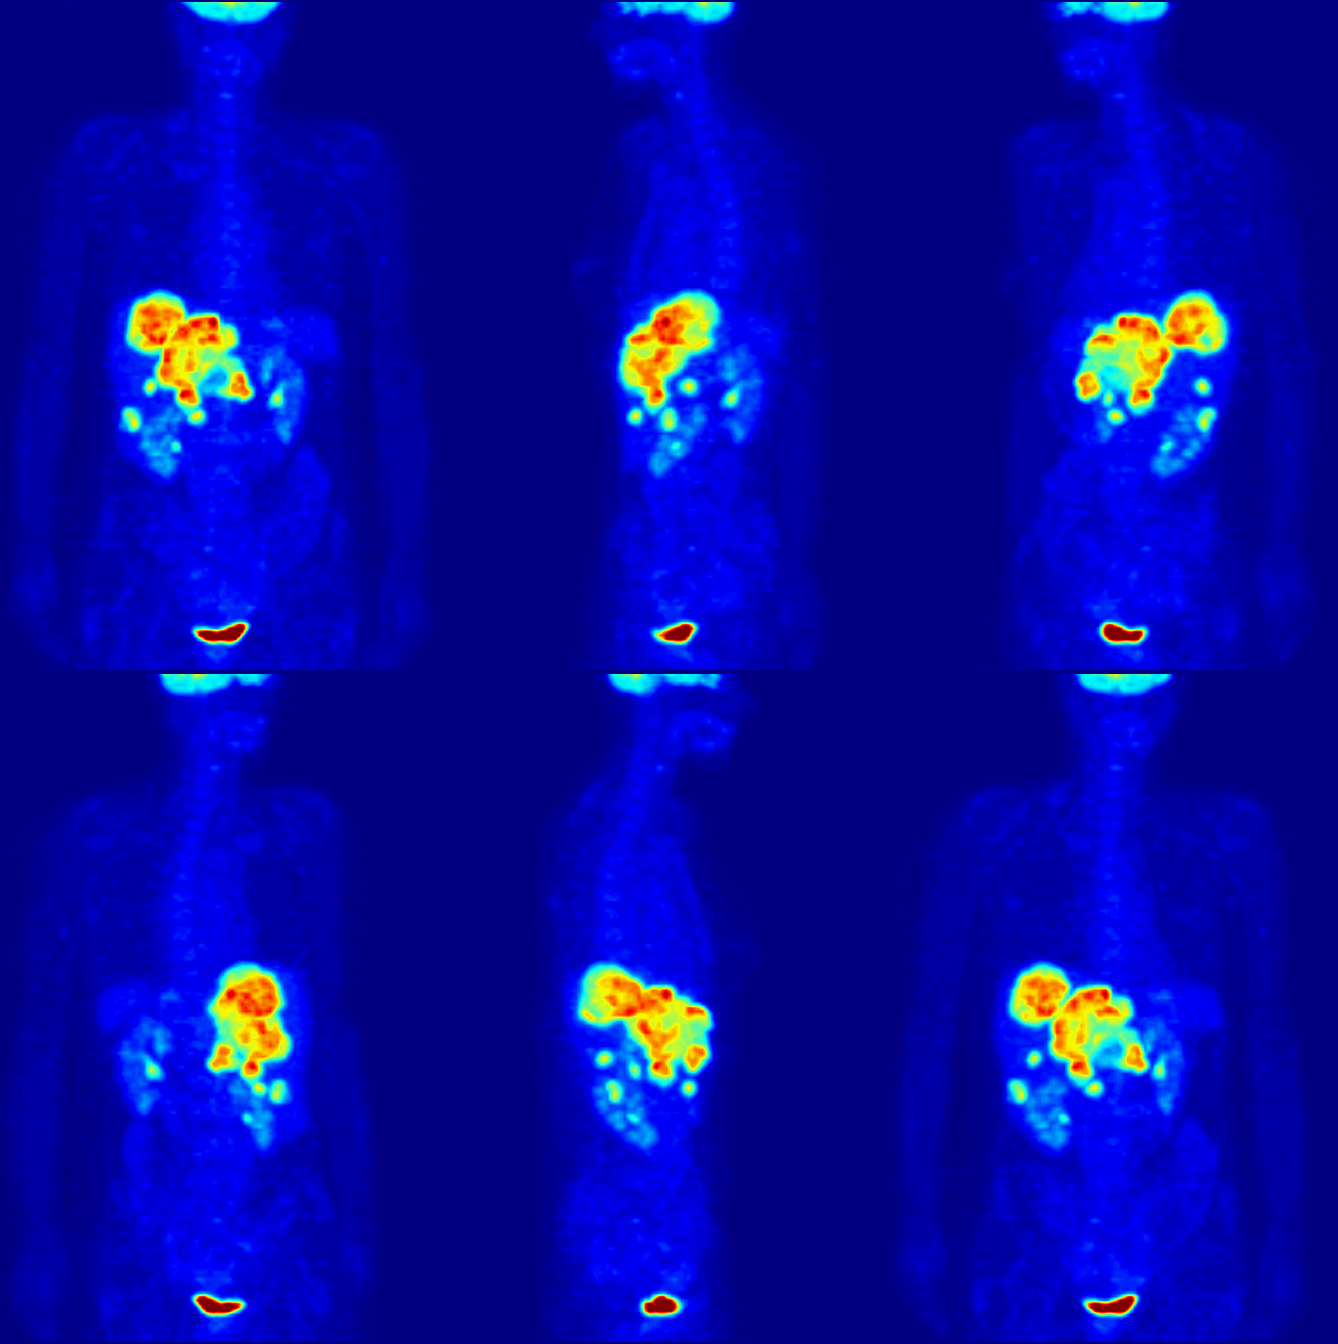
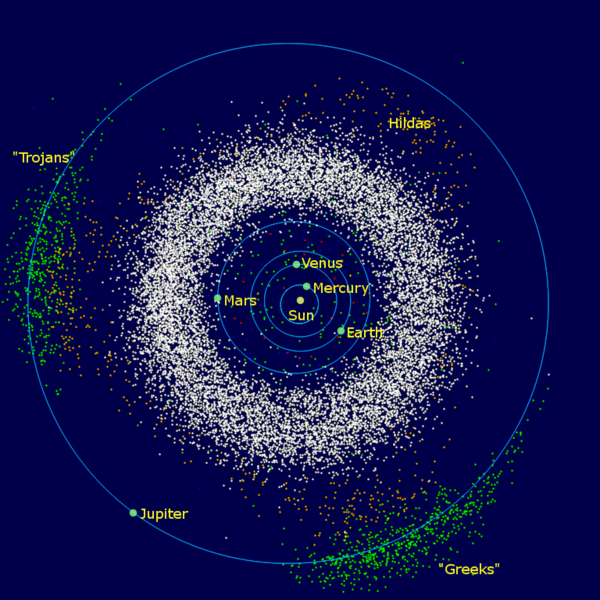
A picture is worth a thousand GB


Examples


Source: Fundamentals of Data Visualization by C. Wilke
Examples

Examples

Examples

Examples

Examples
Examples
Extreme example
Philosophy of the course
-
Hands-on: always have a computer in front of you
-
Use internet to find information
-
Tools and trends change rapidly: learn to learn new tools
-
Use online tutorials and books
-
Concepts remain: understand visualization concepts
- Use open-source when possible
What's in the course?
PART 1: 2D VISUALIZATIONS
(based on-line book by C. Wilke and Matplotlib tutorials)
- Visualizing data: Mapping data onto aesthetics
- Colors and color spaces: theory and application
- Various types of plots: images, velocity and streamline plots, contour plots
PART 2: 3D GRAPHICS AND ANIMATION
(based on Blender 3D tutorials and tailored assignments)
- 3D plotting: mesh types, ray-tracing, surface rendering, velocity and streamline plots, volume rendering
- Basic animation of time-dependent data
- Basic shading of 3D objects
- Rotations in 3D: quaternions and their use
- Visualization of moving particles (if time permits)
Tools we use
How we learn
- Hands-on (80% lab, 20% lectures)
- Weakly work-sheets
- Learn from each other (peer learning)
Philosophy of learning
Learning platforms
- We use it for hand-ins, general course information, final exam

- We use it for announcements, Q&A, discussions, chat, etc.
Preliminary outline
| Week | Contents | Platform |
|---|---|---|
| 1-3 PART 1 |
Course introduction 2D Visualization: various types of plots Colors and images |
Jupyter Python |
| 4-6 PART 2 |
Mesh data and surface plots in 3D Velocity fields and streamlines in 3D Animating time-dependent data Python scripting |
Blender Python |
| 7 | Take-home exam | |
| 7-8 | Course project | Blender Python |
Course project examples
Max Blom, HT-2019
Course project examples
Johan Ramne, HT-2019
Course project examples
Jiaxin Sun, HT-2019
Course project examples
Erik von Brömssen, HT-2019
Work flow
- Compulsory work-sheets, one per week
- Short "theory" lectures and discussions during class/lab
- One course project
-
Take home exam
Getting started with Python/Jupyter
On Linux: open a terminal and run command
>> source /chalmers/groups/anaconda/anaconda3/bin/activate
Then run command
>> jupyter notebook
