Workshop on Update of metadata, data availability and application needs for a CCLME Eco-GIS viewer

THE PROJECT
Enhancing oceanography capacities on CCLME Western Africa countries Phase II


THE PROJECT
It will be based on three main pillars: (i) Data recovery, (ii) Development of a CCLME Data Analytic viewer, and (iii) Technical workshops.
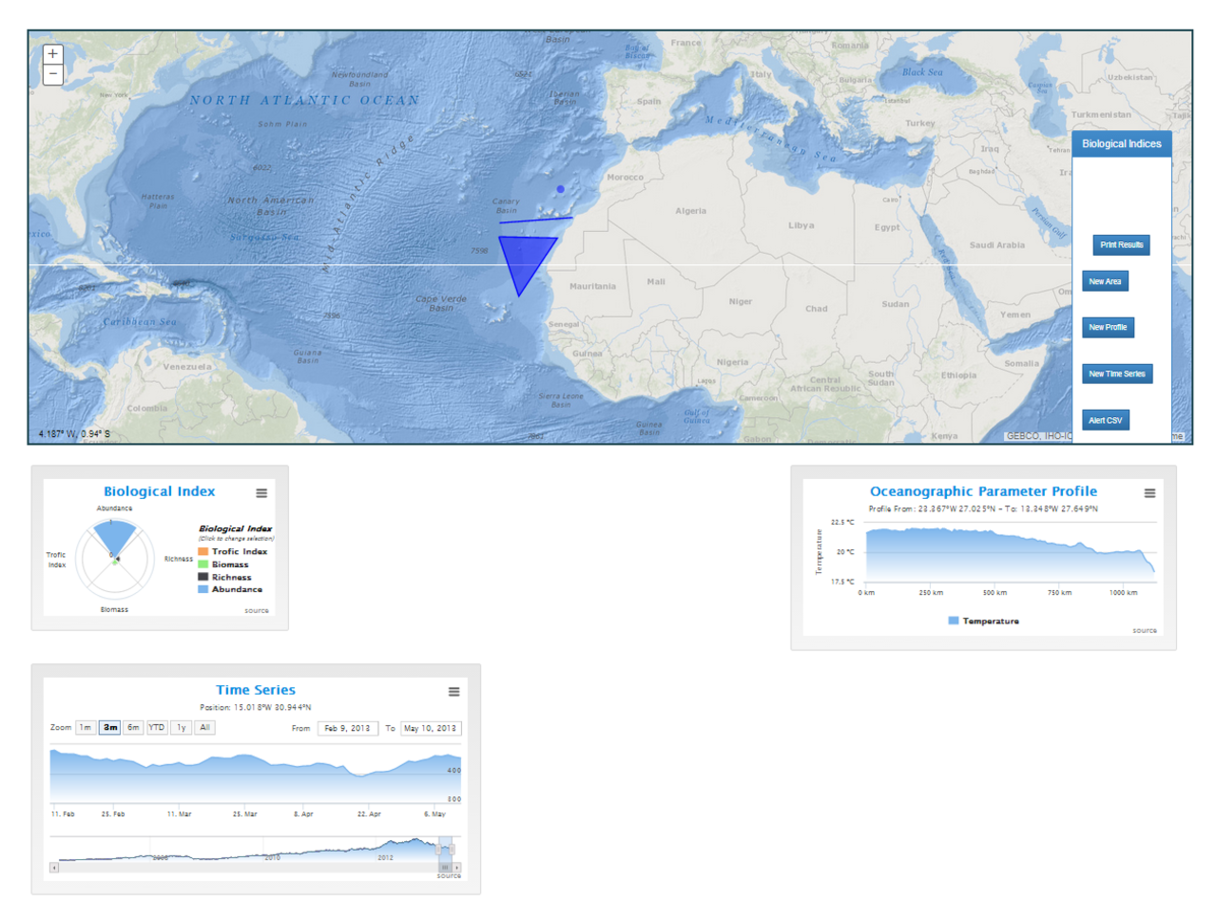
This workshop focuses on sharing ideas about analytic tools to be included in the the web app "CCLME Eco-GIS viewer".


THE PROJECT
- Key expected output:
Developing a GIS dynamic analytic tool aimed to create meaningful data products at regional scale, adding value to raw data and producing new scientific knowledge on the ocean and coastal areas of the CCLME countries.
Deliver a dynamic GIS tool to explore, analyse and compare data.


CCLME REGION
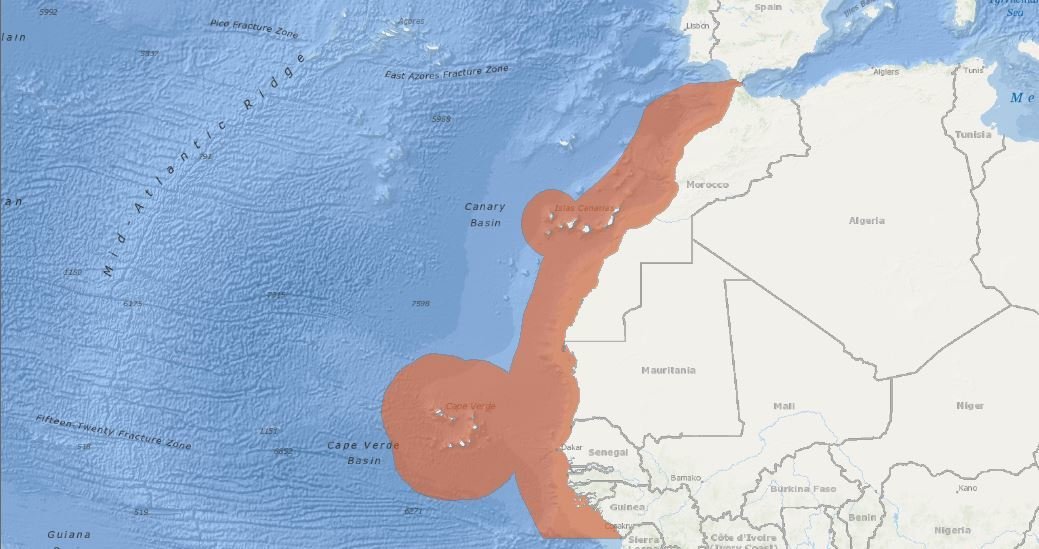
The area covered by the Canary Current LME has been intensely sampled with different purposes during the last 30 years (fish stock assessment, time series, ecological studies, etc).
One pillar of this project is the data recovery to gather regional data according to an agreed-upon scope of topics, geographic limits and temporal considerations, with the aim to make metadata accessible and to improve data flows into the national oceanographic data and information centres in the region.


DATA AVAILABLE
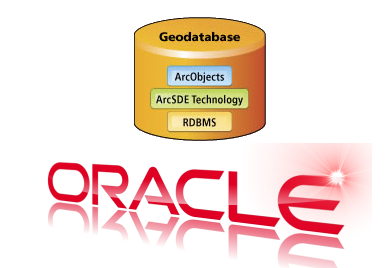
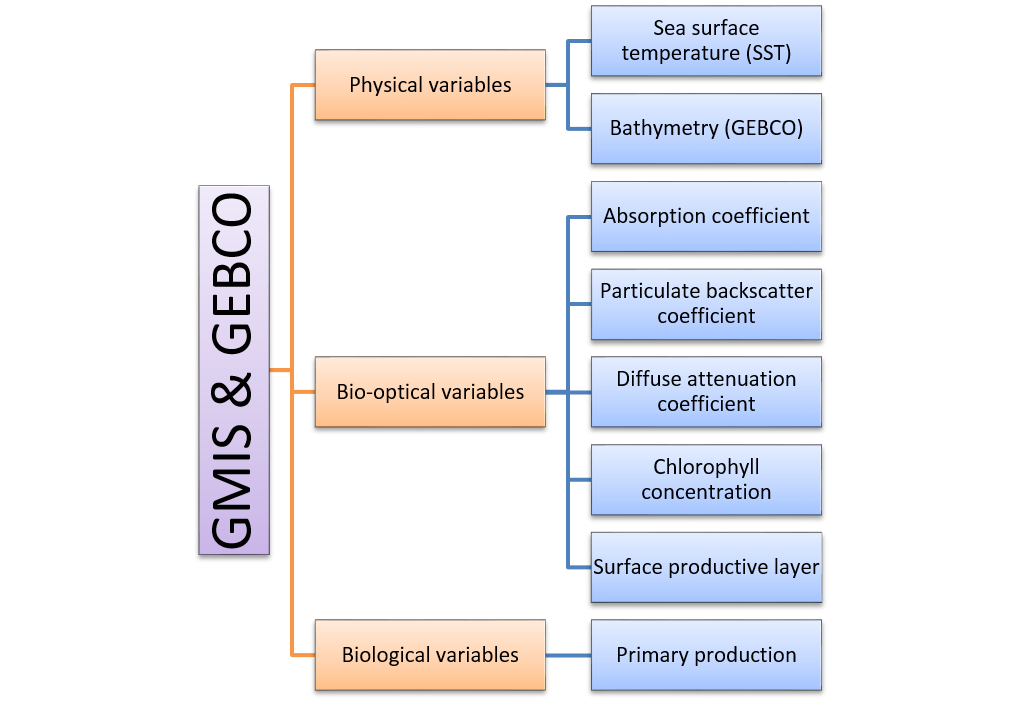
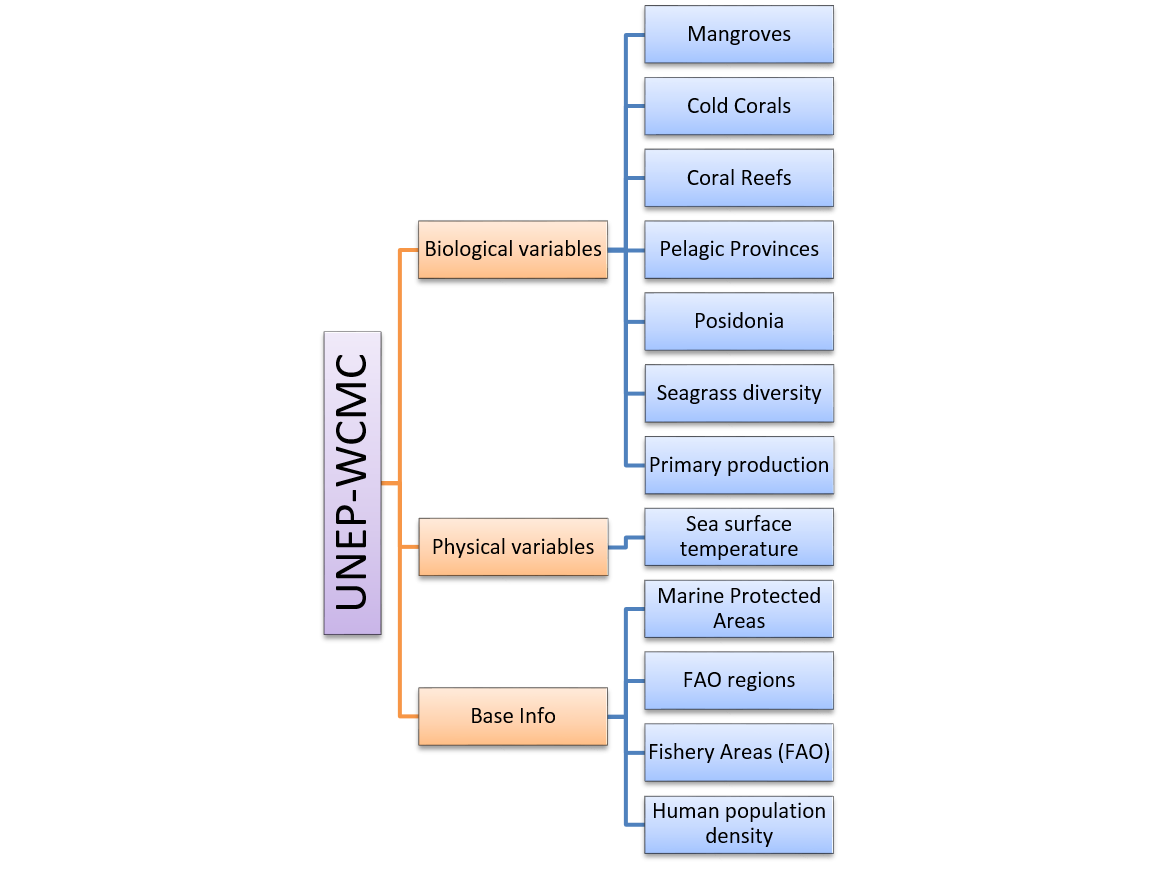
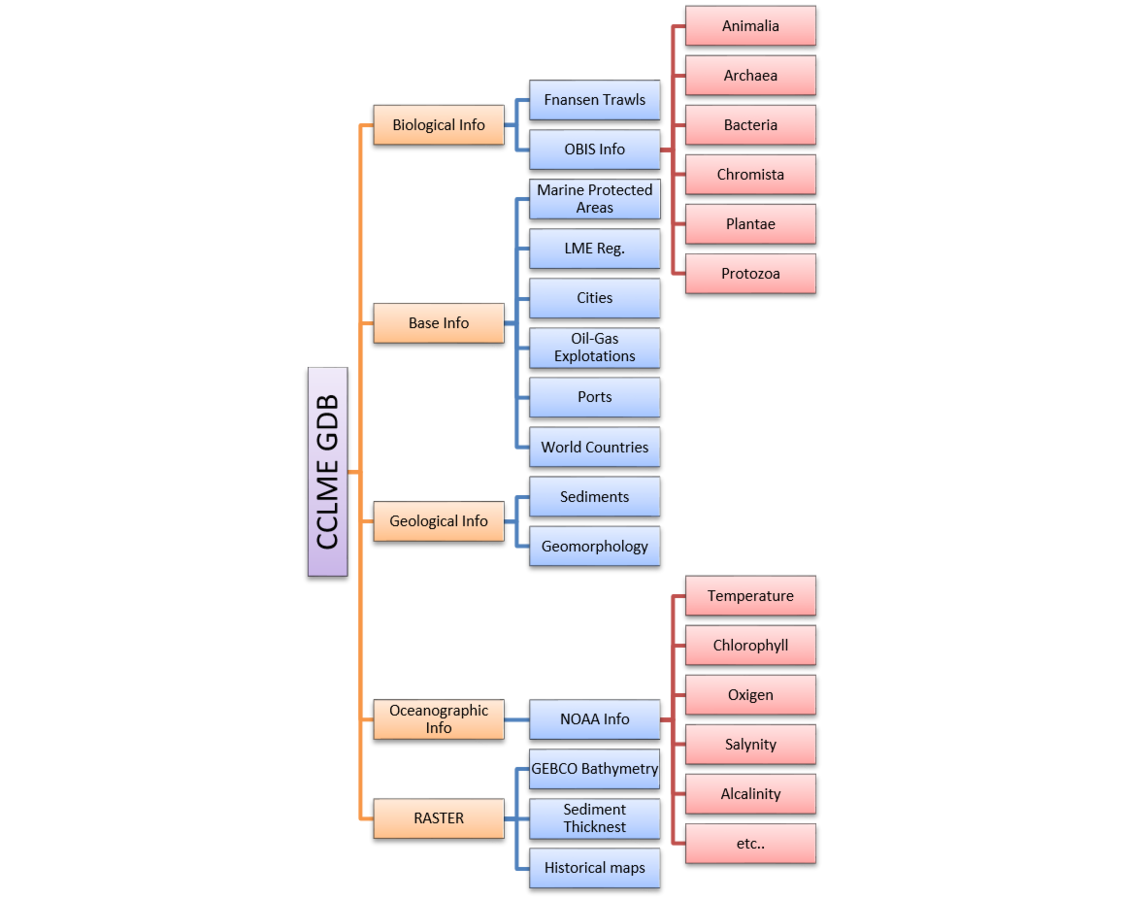
In the previous project "Enhancing oceanography capacities on Western Africa countries" a big amount of oceanographic datasets from the CCLME were collected and stored in a geodatabase. You can download the publication "Directory of Atmospheric, Hydrographic and biological datasets for the Canary Current Large Marine Ecosystem", which includes the metadata collection, in the next link:


IEO Historical Campaings from 1980
-
More than 40 Oceanographic Campaigns in the CCLME
-
During the previos project 17 IEO fisheries surveys were rescued and recovered. This information was stored in the SIRENO Database (IEO project). This information is now available to be used in the CCLME Eco-Viewer web app.
Some data available from these campaings are:
- ABUNDANCE
- BIOMASS
- RICHNESS
- TROFIC INDEX


TECHNOLOGY
We need to know how do you solve your problems:
Scripting for analysis (Python, R, etc.), web development, sharing data & tools, API Rest services, preparing metadata...








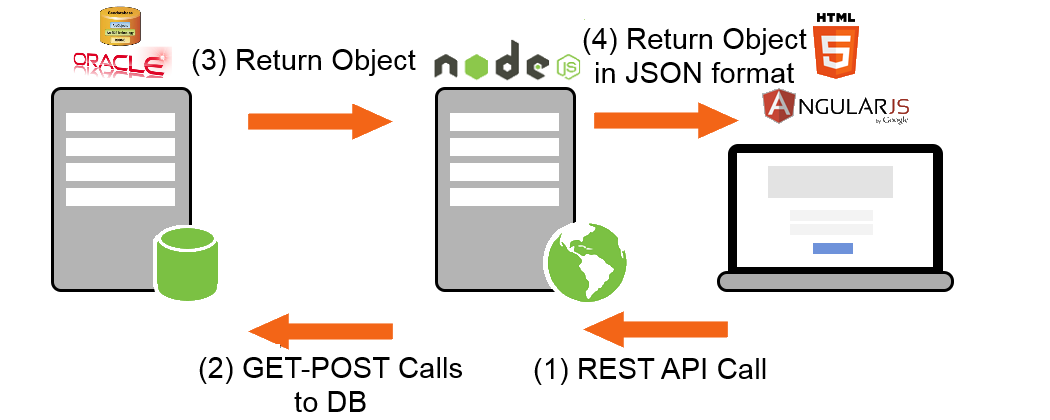
Marine web apps: https://shanehudson.net/2014/02/23/opec-data-visualisation-portal/, http://www.indiseas.org/, http://oceanviewer.org/
R in the Server: http://shiny.rstudio.com/, goo.gl/17oM2Q
Python: http://oceanpython.org/,
Node for ArcGis online & ArcGis Server: https://github.com/esri-es/ArcNode
Javascript graphs libraries: http://d3js.org/, http://c3js.org/,
http://www.highcharts.com/, http://www.amcharts.com
Model View Controller pattern: http://www.asp.net/mvc/mvc5
Real Time Monitoring (Socket.io): goo.gl/9GJhGr, goo.gl/qfwDKJ
SOME EXAMPLES
SHARING THE CODE
We will prepare a repository to share the code developed including the ideas discussed during the workshop.


function initMap()
{
    console.log("Init Map");

    map = new ol.Map({
        target: 'map',
        layers: [
          new ol.layer.Tile({
              source: new ol.source.MapQuest({ layer: 'sat' })
          })
        ],
        view: new ol.View({
            center: ol.proj.transform([-3.5, 40.5], 'EPSG:4326', 'EPSG:3857'),
            zoom: 6
        })
    });
}

function addProjectSelector()
{


    getLogedUser(function (data)
    {
        user = data;

        getProjectListFromUser(user);
    });


}

function getLogedUser(callback)
{
    var url = '/Usr/getLogedUser.ashx"'
    $.ajax({
        url: url,
        //context: document.body
    }).done(function (data) {

        callback(data);

    });

}

WHAT DO WE SPECT FROM YOU

SHORT PRESENTATION
-
A short presentation (15-20 minutes) with your work about development of tools for the analysis of the oceanographic and fisheries data.


YOUR ACTIVE PARTICIPATION
We will open forums to share ideas about what web tools can be developed under the frame of the project with the data collected.



SEE YOU IN CABO VERDE
Contact for any question about your contribution:
Luis Miguel Agudo
lmagudo@gmail.com
