Masterclass creating business value with big data
Datavisualisation
Maarten Lambrechts
Vlerick Business School
Brussels - February 20 2015
After this session you'll know
how
numbers
can talk more
efficiently
to
your & others
brains
Maarten Lambrechts?
Data & Multimedia journalist @Mediafin (De Tijd & L'Echo)
Bio-Engineer (KULEUVEN 2003)
Datavisualisation trainer & consultant
"As knowledge increases amongst mankind, and transactions multiply, it becomes more and more desirable to abbreviate and facilitate the modes of conveying information from one person to another, and from one individual to the many."
William Playfair, 1786
"Everything that can be expressed in numbers can be represented by lines."
John Playfair
East
West
North
South
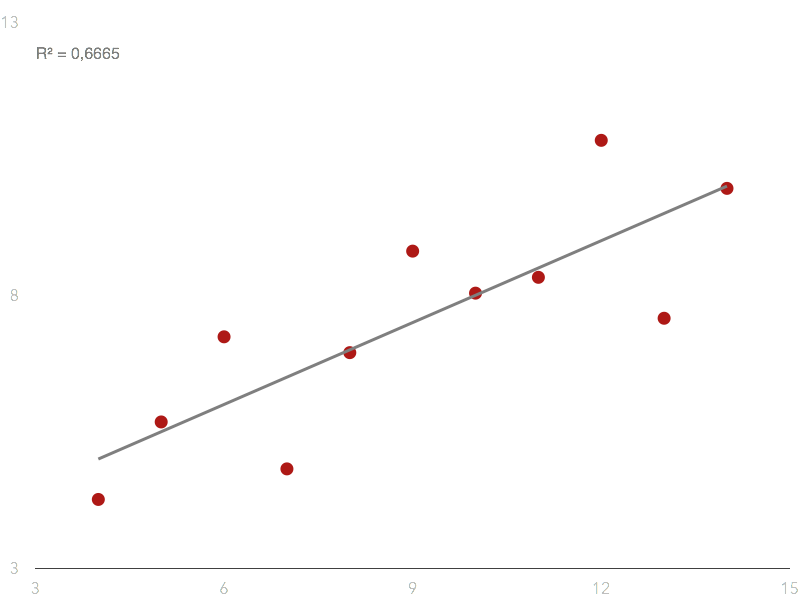
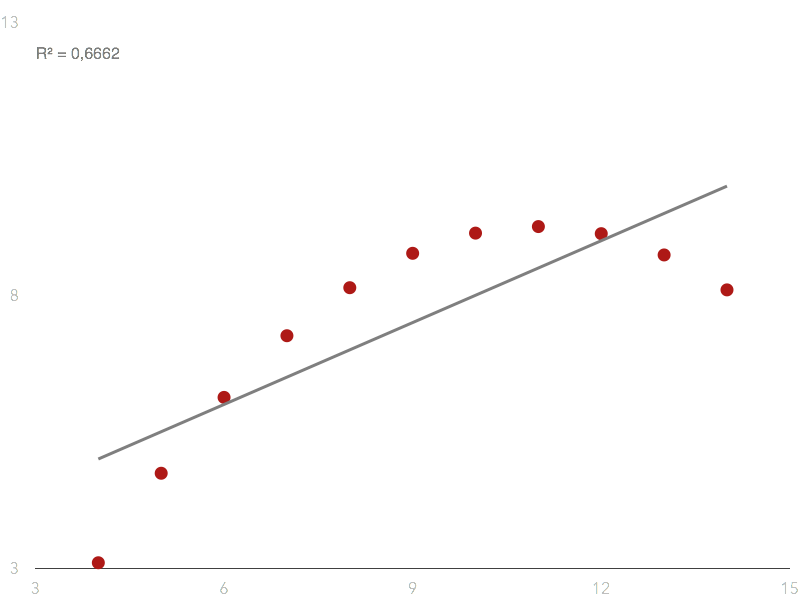
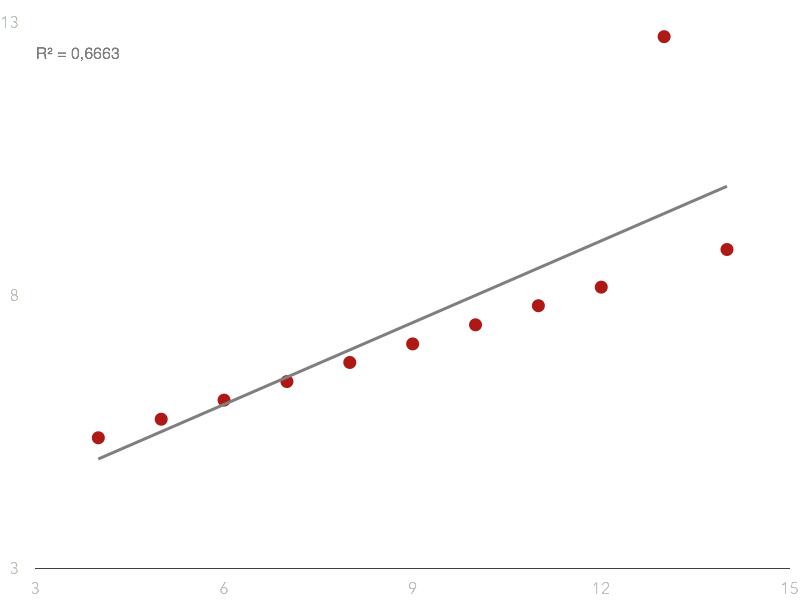
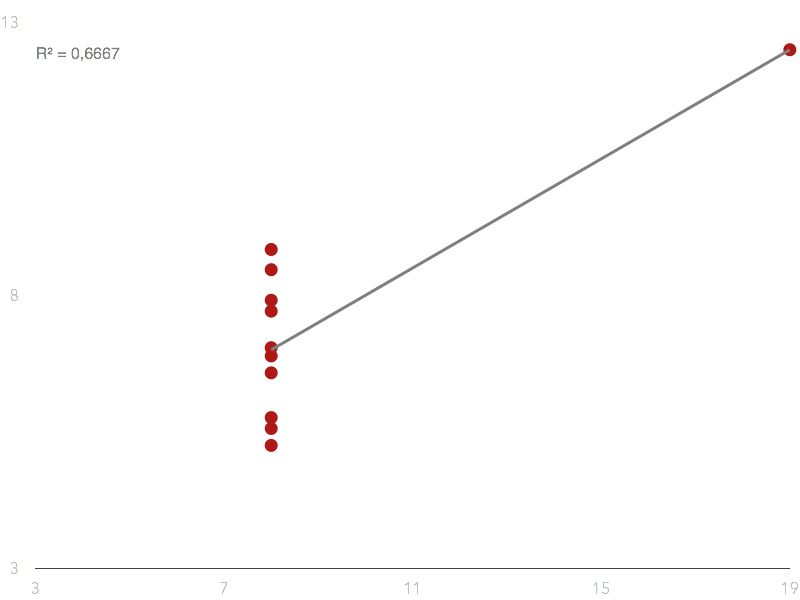
Visualisations
answer questions
go beyond descriptive statistics
show things otherwise hidden
The secret?
preattentive processing
868888609462834719714449648
122286651978794222484779908
939340243123007392183390116
351684124962334339709749742
Attentative Processing
868888609462834719714449648
122286651978794222484779908
939340243123007392183390116
351684124962334339709749742
preAttentive Processing
Good visualisations use
Color
size
position
rotation
shape
enclosure
deliberately
Subtle
smart
Another Secret
Gestalt laws
Use the laws of
proximity
connectedness
similarity
enclosure
The basics
Ground rules for efficient visualizations
Evaluation
some simple datavisualisation
EXAMPLES we can learn from
Evaluate on
-
Correctness
-
Readability
-
Efficiency
-
Use of text and numbers
-
Use of color
-
use of preattentive and gestalt features
Re-evaluation with checklist
Which one is officialy the worst visualisation?
For more bad visualisations: viz.wtf
Datavisualization*
communicates Numbers
Faster
More efficient
More complete
aesthetically more pleasing
with More fun
*When done right
webcharts
USE
Tooltips
Filter
extra context
Switch view
Drill down
Sort
Animation
Deliberately
SUBTLE
smart
Tool:
Tableau
tableau
-
respects ground rules
-
Drag 'n drop
-
Many data connections
-
Sharing is easy
Demo
Where to move if you want to meet a rich and single Flemish woman?
tableau is not
-
a data management platform
-
a spreadsheet editor
-
Statistical modelling tool
Dashboards and macroscopes
why dashboards?
Question:
Monitoring
Anwser specific questions
- Everything ok?
- Processes ended?
- Cause of problem?
- Where to invest resources?
Exploration
Gain insights
- Who are our customers?
- How are people using our webshop?
- What are the patterns in our sales?
Monitoring
Anwser specific questions
- Only show relevant data
- User is most important
- Should lead to action
- Tool = dashboard
Exploration
Gain insights
- Show all the data
- Data is most important
- Should lead to insight
- Tool = macroscope
10 design principles
for dashboards
8 also apply to macroscopes
user centric
NOT DATA CENTRIC
NOT DASHBOARD CENTRIC
Use the grid
Left top to bottom right
Gradual reveal
tooltips
Pop ups
drilldowns
1. overview
Dataviz mantra
2. zoom
3. details on demand
respect datastructure
Time series
Categories
Flows
Hierarchies
respect dataviz groundrules
Guide attention
Color
Type
Sizes
Grid
Grouping
show context
Targets
Past time periods
Averages
Other statistics
avoid unnecessary precision
1.4k vs 1.458,54
USE labels, but limit them
Guide action
Actions to perform
People to contact
Evaluation
Let's Apply these principles to real life examples
ING Luxembourg's complaints dashboard
User centric
Use the grid
Gradual reveal
Dataviz mantra
Respect datastructure
RESPECT DATAVIZ GROUND RULES
GUIDE ATTENTION
SHOW CONTEXT
AVOID TOO MUCH PRECISION
GUIDE ACTION
Macroscopes
Belgian Car Fleet
Bibliography
This presentation: slides.com/maartenzam/bigdata
Presenting Data Effectively | Stephanie Evergreen
The Functional Art | Alberto Cairo
Data Fluency | Zach & Chris Gemignani
Information Dashboard Design | Stephen Few
On dashboards and dataviz 1 2 3 | Jerome Cukier
Datascopes: Worlds, not stories | Moritz Stefaner