An intro to D3.js
Maarten Lambrechts
PART 1
CIMAT
INEGI
8 October 2021
Course outline
Webdev 101
D3.js?
A bubble chart with D3, part 1
Next week
A bubble chart with D3, part 2
Examples of D3 charts
References for learning D3
These slides
/live
Webdev 101
HTML
HyperText Markup Language
Structure and content of a webpage, rendered by a browser
Hierarchy of elements/tags
.html
<h1>Hello class!</h1>
<p>Today we are going to make awesome graphics <span>with D3!</span></p>
<img src="https://media.giphy.com/media/QHE5gWI0QjqF2/giphy.gif">
SVG
Scalable Vector Graphics
Scalable images for the web
Part of html
Text based
Animatable
<svg width="100"height="100">
  <circle
    cx="50"
    cy="50"
    r="40"
    stroke="green"
    stroke-width="4"
    fill="yellow"/>
</svg>
CSS
Cascading Style Sheets
How html elements should be displayed
In separate .css file, or inline in html
body {
  font-family: Arial;
}

h1 {
  font-size: 52px;
}

p {
  font-size: 24px;
}

span {
  background-color: #910000;
  padding-left: 4px;
  padding-right: 4px;
  color: white;
}
JavaScript
Language to make webpages dynamic
React to user actions, update content
Animations
Control multimedia
.js files
const circle = document.querySelector("circle");

circle.addEventListener("click", function(){
    circle.setAttribute("fill", "blue")
  }
);
Servers and clients
Files (.html, .css, .js, images, ...) are served to the client by a server
To develop a web visualization, you need a (local) server
But we'll use JS Bin instead

Exercise
Open a web page
View source: click right => View page source
Inspect element: click right => Inspect element
In Developer tools:
- Inspector
- Console
- Other tools
Exercise
Open jsbin.com/copokiv/1/edit and play around a little bit
Add
to the javascript, and open the console tab
console.log("Logging to the console"); Add
to the javascript, and open the console tab
var sum = 4 + 12;
console.log(sum);
D3.js
D3.js
Data Driven Documents
Bind data to html elements
"A JavaScript library for manipulating documents based on data. D3 helps you bring data to life using HTML, SVG, and CSS"

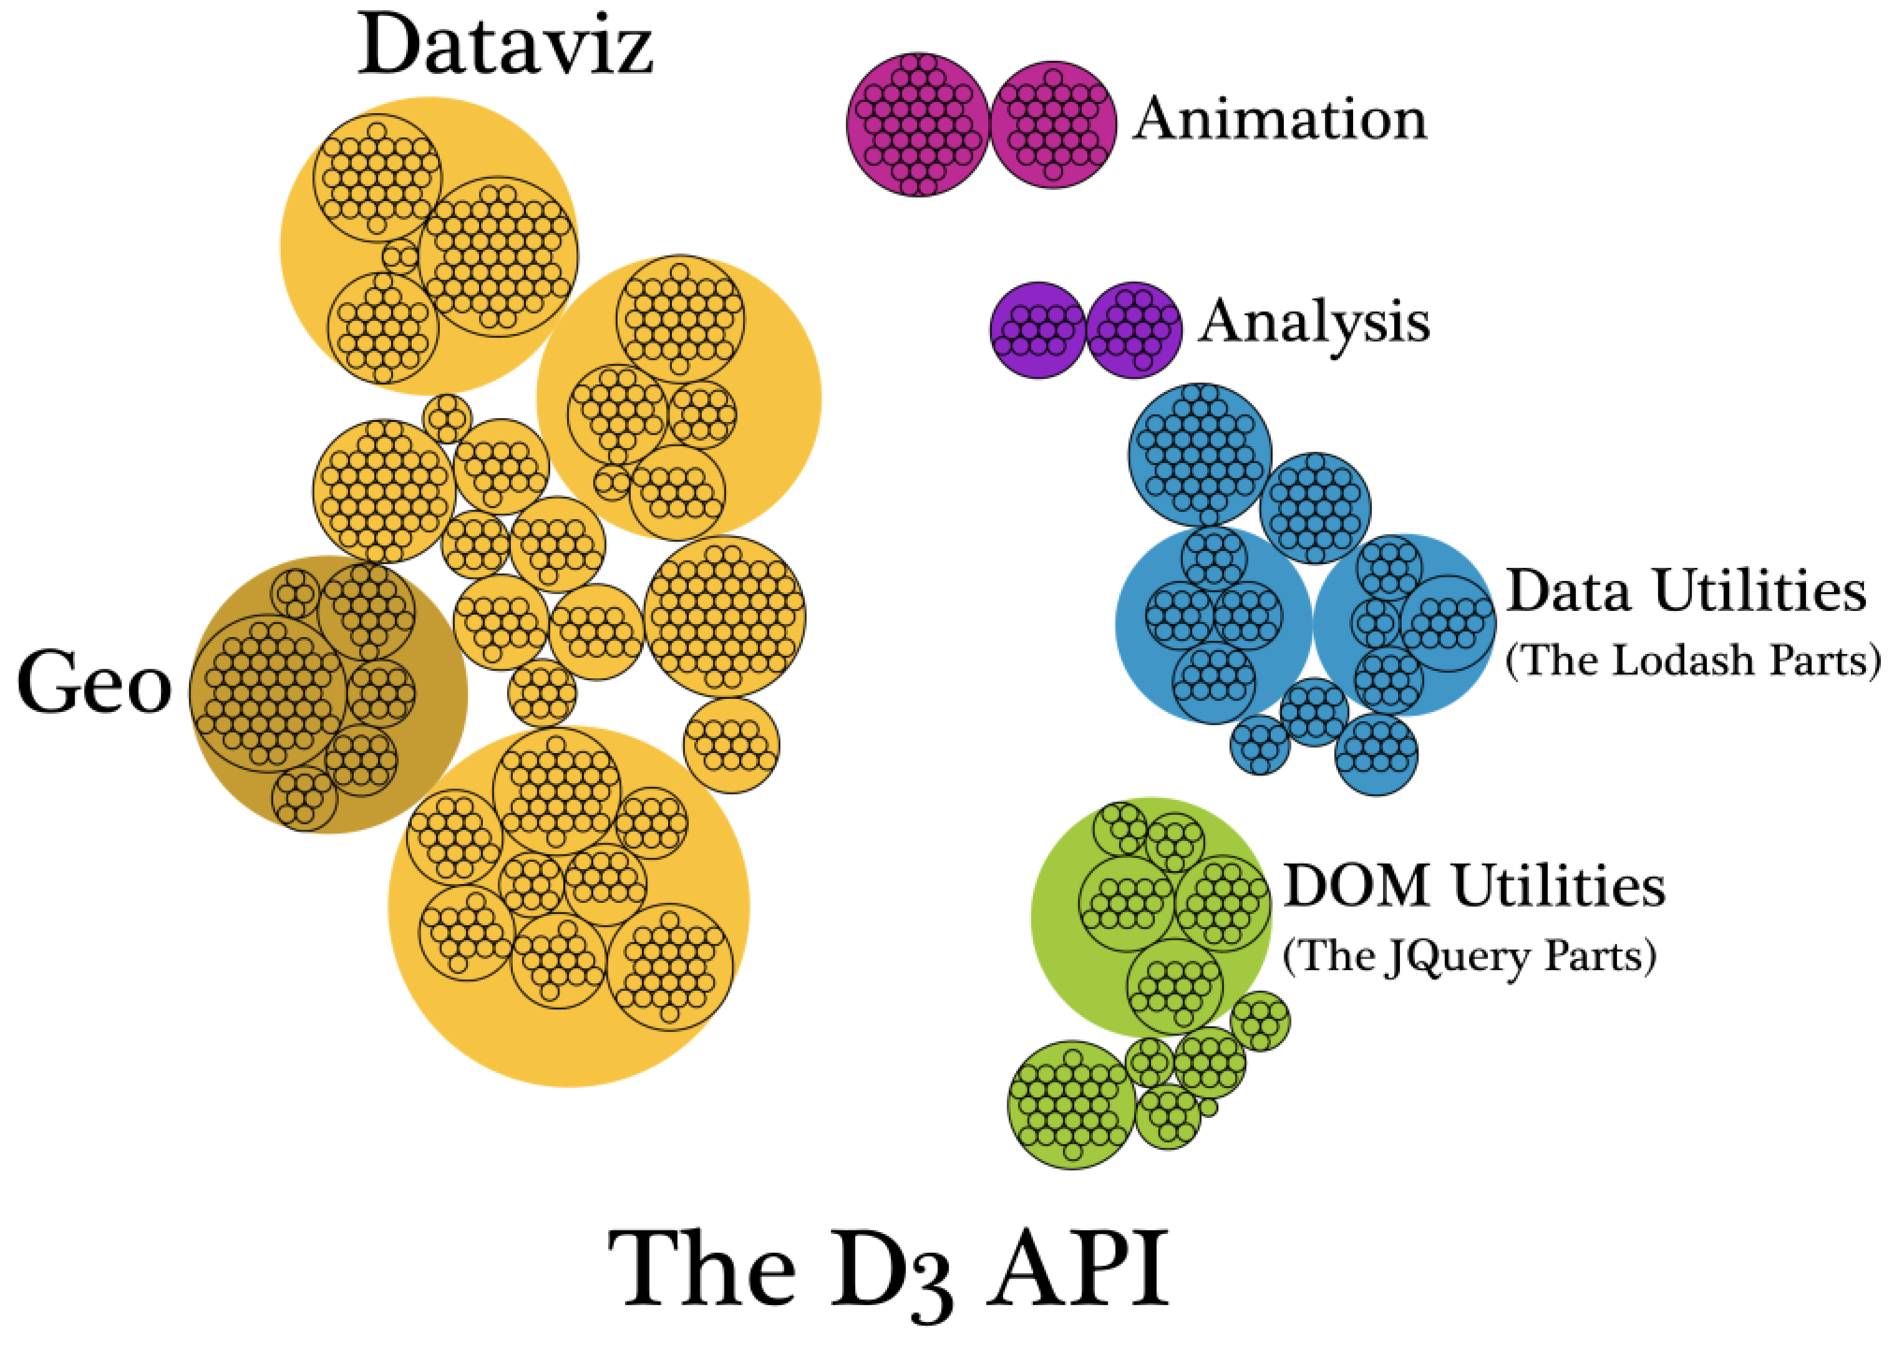
D3 functions
Selecting elements
Creating elements
Data loading
Data transformations
Scales
Colors
Chart layouts
Maps
Number and date/time formatting
Animations
D3 is not...

... a charting library, it has no ready made charts
... very easy to learn
... a data analytics tool
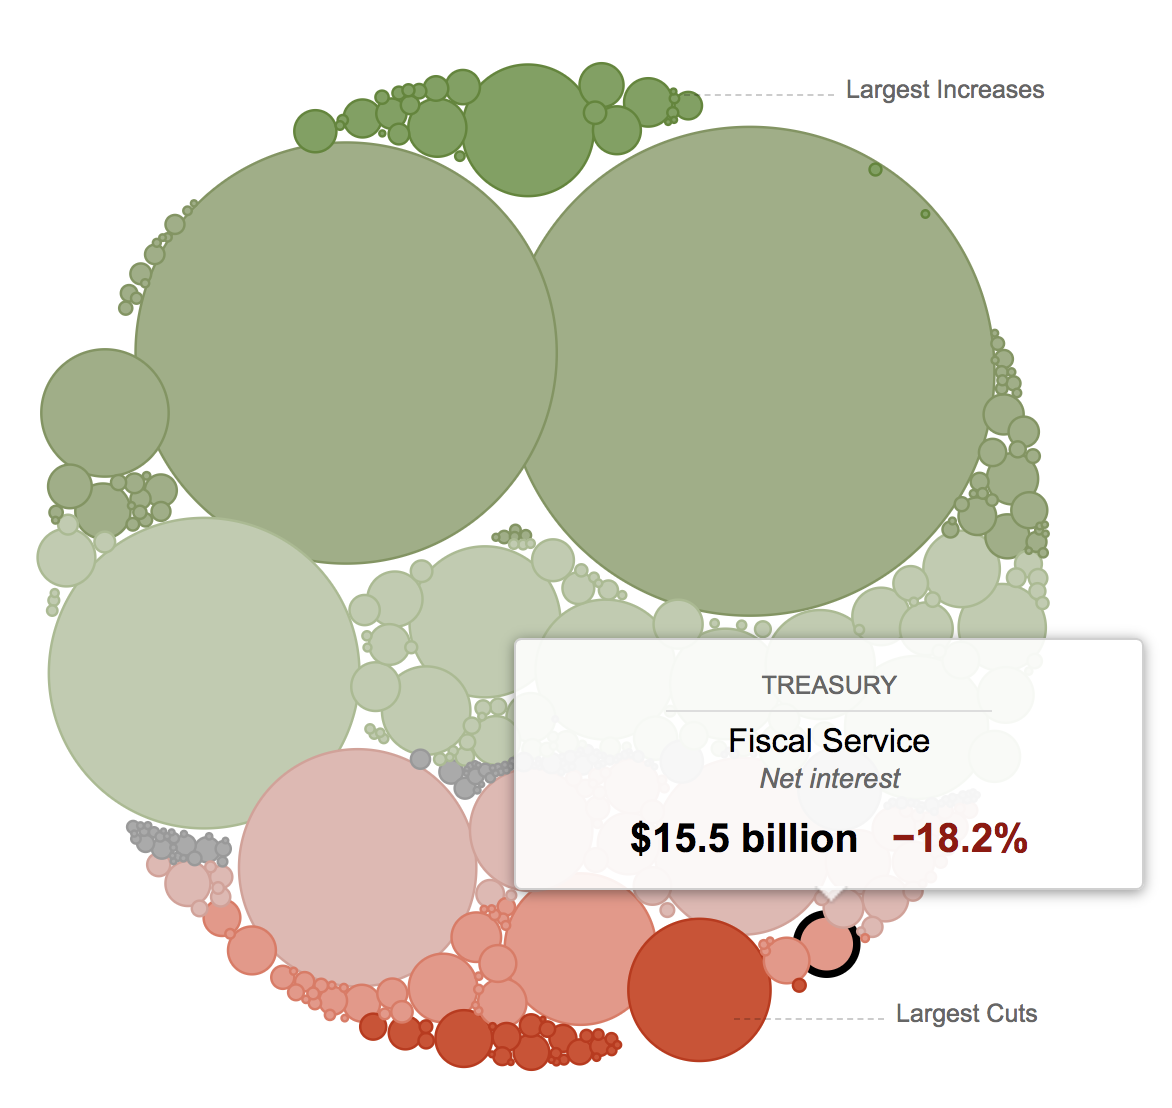
D3 examples
Basic example: basic pie
More examples:
Advanced:

When to use D3
Animated charts
Dynamic charts
Custom chart types
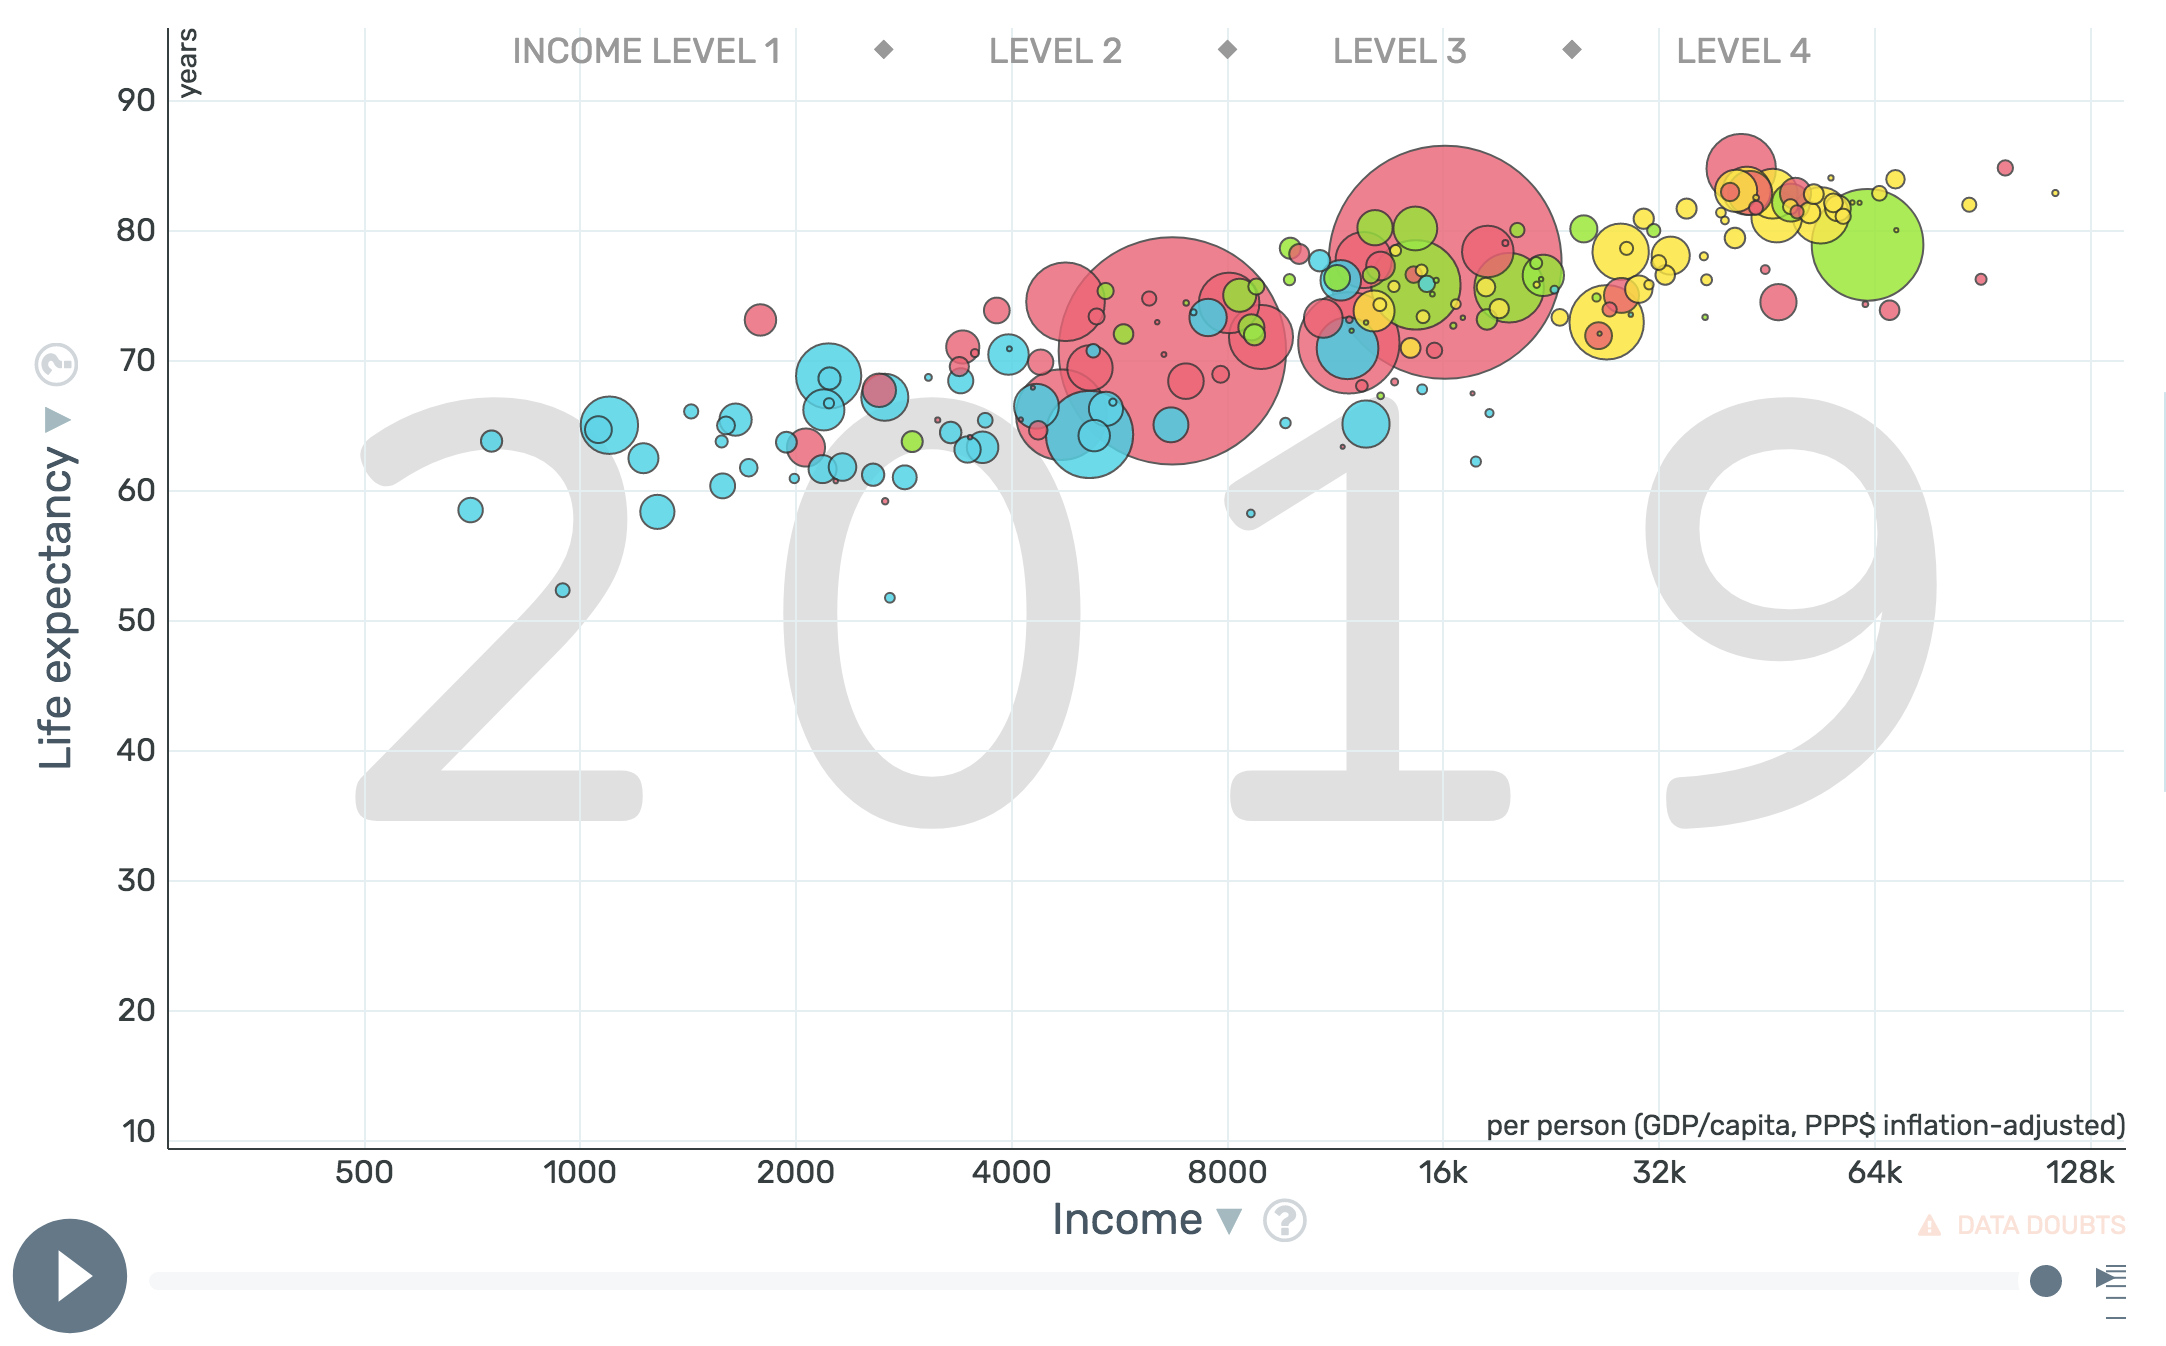
Visualizing data on the web
A bubble chart with D3.js
What we are going to make
Exercise: setup
Go to jsbin.com
Keep 1 jsbin tab open, and try to follow me. Use the solutions if you get stuck
Load version 7 of D3 in the html (see D3js.org homepage)
Set up svg, 800 pixels wide and 600 pixels high
Solution: jsbin.com/coxefax/1/edit
Append a circle to the svg with D3
Solution: jsbin.com/coxefax/2/edit
Add data
Inline data
Load csv file with d3.csv
Log the data
const data = [
  {"name": "datapoint1", "value": 20},
  {"name": "datapoint2", "value": 33}
]
d3.csv("my-data-file.csv";).then(data => {
  console.log(data)
});
Draw elements with data
Select elements
(even when they are not existing yet!)
Bind data with data()
Append elements with join()
svg.selectAll("circle")
  .data(circledata)
  .join("circle")
  .attr("cx", (d) => d.x)
  .attr("cy", (d) => d.y)
  .attr("r", (d) => d.radius)
Exercise: draw some circles
Draw 2 or more circles from data with D3
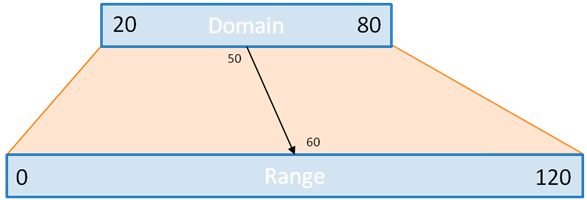
Scales
Map data to visual properties of elements
From input domain to output range
Exercise: load data, set up scales
Load the data with d3.csv(), and convert to numbers
Define a linear X scale
Define a linear Y scale (from bottom to top)
Scales
d3.scaleSqrt() for radius
d3.scaleOrdinal() for colors
stroke & fill attributes
2 ways of adding color: as a style attribute, or through css with classes
d3.scaleLog()
Exercise: scale and fill circles, logarithmic scale
Scale circles with d3.scaleSqrt()
Convert X scale to a logarithmic scale with d3.scaleLog()
Add a color scale to fill by continent with d3.scaleOrdinal()
Sort data
Sort data to show small bubbles on top
No D3, just "vanilla" javascript
data.sort(function(a,b){
  return b.population - a.population;
})
Exercise: sort data
Sort the data (also try to revert the sorting)
Plot margins
Add a <g> element
Transform
Adjust scales
d3.axisBottom()
d3.axisLeft()

Exercise: margins convention, x and y axes
Refactor to implement the margins convention
Add axes
Exercise: tick format and tick size
Add grid with negative inner tick size + css for colors
Text annotation for the year
Next week
A bubble chart with D3, part 2
Tooltips
Animation