An intro to D3.js
Maarten Lambrechts
PART 2
INEGI
CIMAT
15 October 2021
Course outline
Last week
Webdev 101
D3.js?
A bubble chart with D3, part 1
Today
A bubble chart with D3, part 2
Examples of D3 charts
References for learning D3
These slides
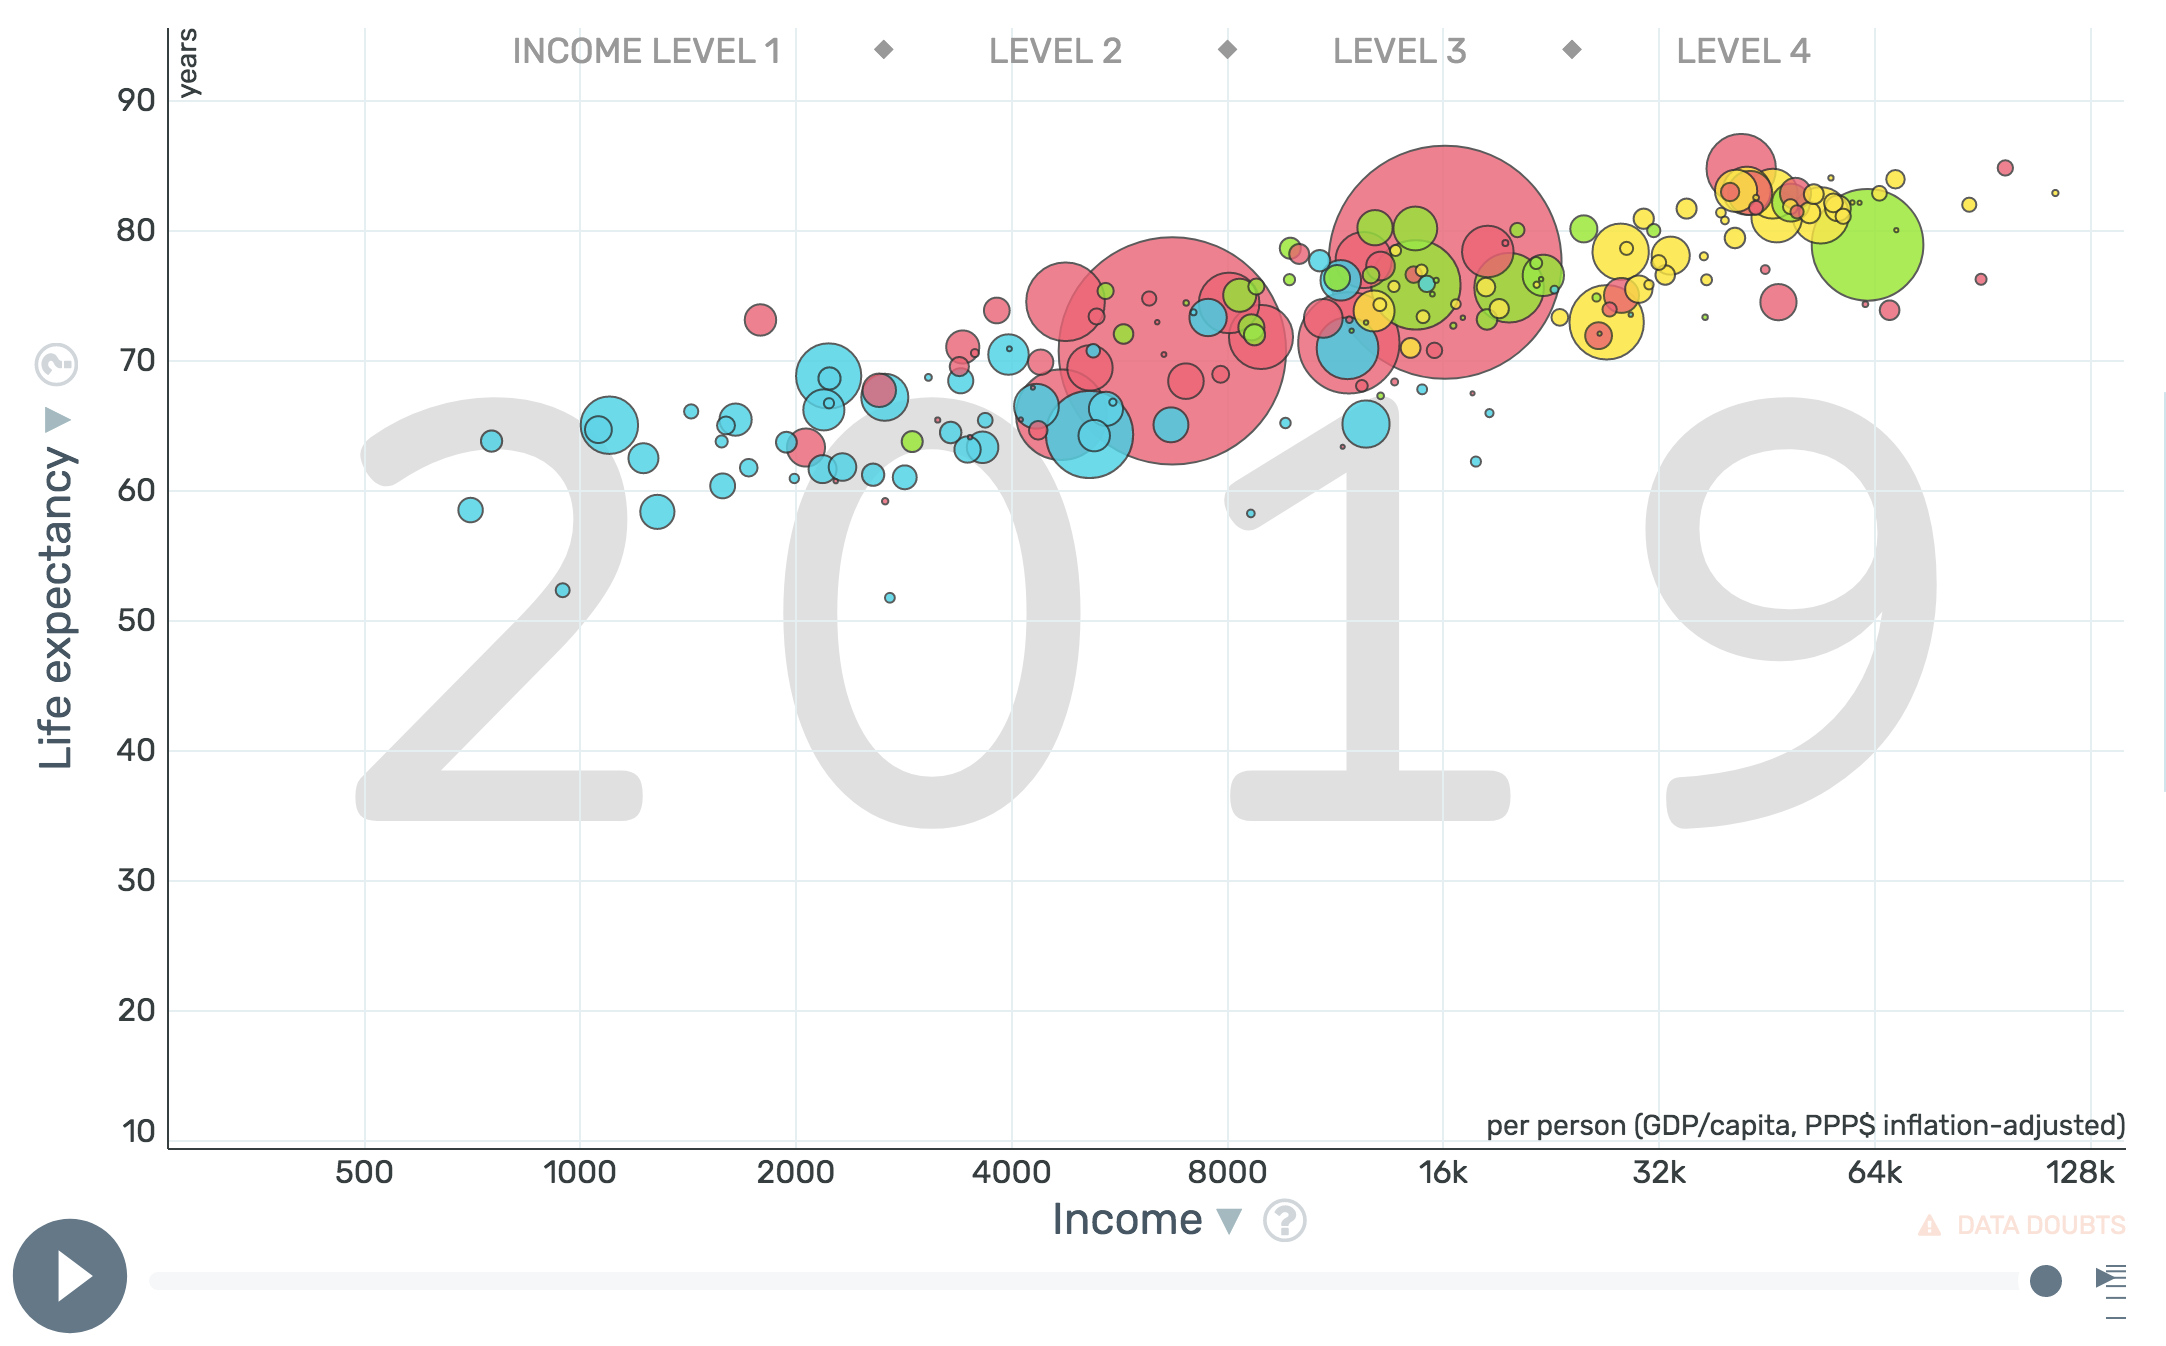
A bubble chart with D3.js, part 2
What we are making
Exercise: scale and fill circles, logarithmic scale
Scale circles with d3.scaleSqrt()
Convert X scale to a logarithmic scale with d3.scaleLog()
Add a color scale to fill by continent with d3.scaleOrdinal()
Sort data
Sort data to show small bubbles on top
No D3, just "vanilla" javascript
data.sort(function(a,b){
  return b.population - a.population;
})
Exercise: sort data
Sort the data (also try to revert the sorting)
Plot margins
Add a <g> element
Transform
Adjust scales
d3.axisBottom()
d3.axisLeft()

Exercise: margins convention, x and y axes
Refactor to implement the margins convention
Add axes
Customise axis
Custom tick values
Use ticks to make a grid
const xAxis = d3.axisBottom(xScale)
    .tickValues([500, 1000, 2000, 4000, 8000, 16000, 32000, 64000])
    .tickFormat(d3.format(".1s"))
    .tickSizeInner(-height);
Exercise: grid and text annotation
Add grid with negative inner tick size and css for colors, add tick values for the xAxis
Text annotation for the year
Tooltips
css for styling
div.tooltip {
    position: absolute;
    text-align: center;
    height: 24px;
    padding: 5px;
    font: 18px sans-serif;
    background: white;
    border: 2px solid black;
    border-radius: 8px;
    pointer-events: none;
}
const tooltip = d3.select("body")
.append("div")
.attr("class", "tooltip")
.style("opacity", 0);Add a div for the tooltip
Hide it by setting its opacity to 0
Tooltips
Add event listeners on the bubbles with .on()
Show the tooltip and set its content on mouseover, hide the tooltip on mouseout
.on("mouseover", (event,d) => {
  tooltip.style("opacity", 1)
    .text(d.country)
    .style("left", (d3.pointer(event)[0] + 10) + "px")
    .style("top", (d3.pointer(event)[1]+50) + "px");
   })
.on("mouseout", (d) => {
  tooltip.style("opacity", 0);
});
Exercise: tooltips
Add a div, css and event listeners for the tooltip
Exercise: 1960 data
Add data for 1960
Toggle
Add event listener to detect changes
d3.selectAll('input').on('change', function() {
      console.log('selection changed to ' + this.value);
    });
<form>
<input type="radio" name="year" value="1960"> 1960<br>
<input type="radio" name="year" value="2018" checked> 2018<br>
</form>Html input elements
Exercise: data toggle
Add radio buttons to toggle the data
Transitions
d3.selectAll("circle").transition()
  .duration(1500)
  .attr("cx", (d) => xScale(d.income60))
  .attr("cy", (d) => yScale(d.lifeexp60))
  .attr("r", (d) => rScale(d.population60))
}
Update attributes and use .transition() to animate
Exercise: transition
Add the transitions
Exercise: change the year annotation
Change the content of the year annotation when the toggle is clicked
D3 in modern web development
Modules and packages
Import and export javascript modules
import { axisLeft, axisRight } from 'd3-axis'
import { scaleLinear, scaleLog, scaleSqrt } from 'd3-scale'
npm
Node package manager
npm install d3-scale d3-axis --saveBundling

Frontend frameworks
Take control of the DOM, decide what is rendered => d3.select(), d3.selectAll()
Manage state
Boiler plates to get started
<svg width={width} height={height}>
    <g className="bubbles-g">
        {countries.map((d) => {
            return (
                <circle
                  key={"bubble-" + d.Country}
                  cx={xScale(d.coosshare)}
                  cy={yScale(d.bmpshare)}
                  r={sizeScale(d.total)}
                  fill={colorScale(d.Region)}
                  stroke={
                    activeCountry === ""
                      ? highlightcountries.length === 0
                        ? "white"
                        : highlightcountries.includes(d.Country)
                        ? "black"
                        : "white"
                      : d.Country === activeCountry
                      ? "black"
                      : "white"
                  }
                  strokeWidth={...}
                  style={{ cursor: "pointer" }}
                  opacity={...}
                  onMouseOver={() => {//Show tooltip}}
                  onMouseLeave={() => {//Hide tooltip}}
                ></circle>
    </g>
</svg>
React & svg
Examples of D3 charts
References for learning D3
Learn D3, by Mike Bostock
Introduction to SVG and D3.js, by Shirley Wu
observablehq.com/@d3
How to learn D3.js, by Amelia Wattenberger
Full stack D3 and data visualization
React + D3.js