Statistical pitfalls in news
@maartenzam
Dataharvest | EIJC
Mechelen
May 26 2018
Percentages & points
That's not normal
The mean median
Regression to the mean
Distribute distributions
Correlation is not causation
Ecological fallacy
Margins of error
Small and big chances
Percentages and points
"Last year, 30% of Data Harvest attendees were women. This year it is 40%. The share of women has increased 10%!"
That's a 10 percentage point increase
Or:
(40 - 30)/30 = 1/3 = 33.3% increase
% - % = percentage point
(new - old)/old = % change
That's not normal
Top 5 EU energy consumers
-
Germany: 317.261
-
France: 248.746
-
UK: 189.439
-
Italy: 154.748
-
Spain: 122.176
Congratulations, you've made a population ranking
Now divide by the population, please
Especially true for maps

Make things comparable (=normalise):
per capita, per area, ...
The mean median
Bill Gates walks into a bar...
The median?
Rank the data: the median is in the middle

What does it mean when the median and the mean are (more or less) the same?
The median is less sensitive to outliers than the average. Use it!
Regression to the mean

Traffic deaths in your municipality: 8 this year, compared to only 2 last year and 1 the year before
Has your municipality become more dangerous? What do you think will happen next year?
Extreme values will be followed by 'normal' values
Things will even out over the longer term
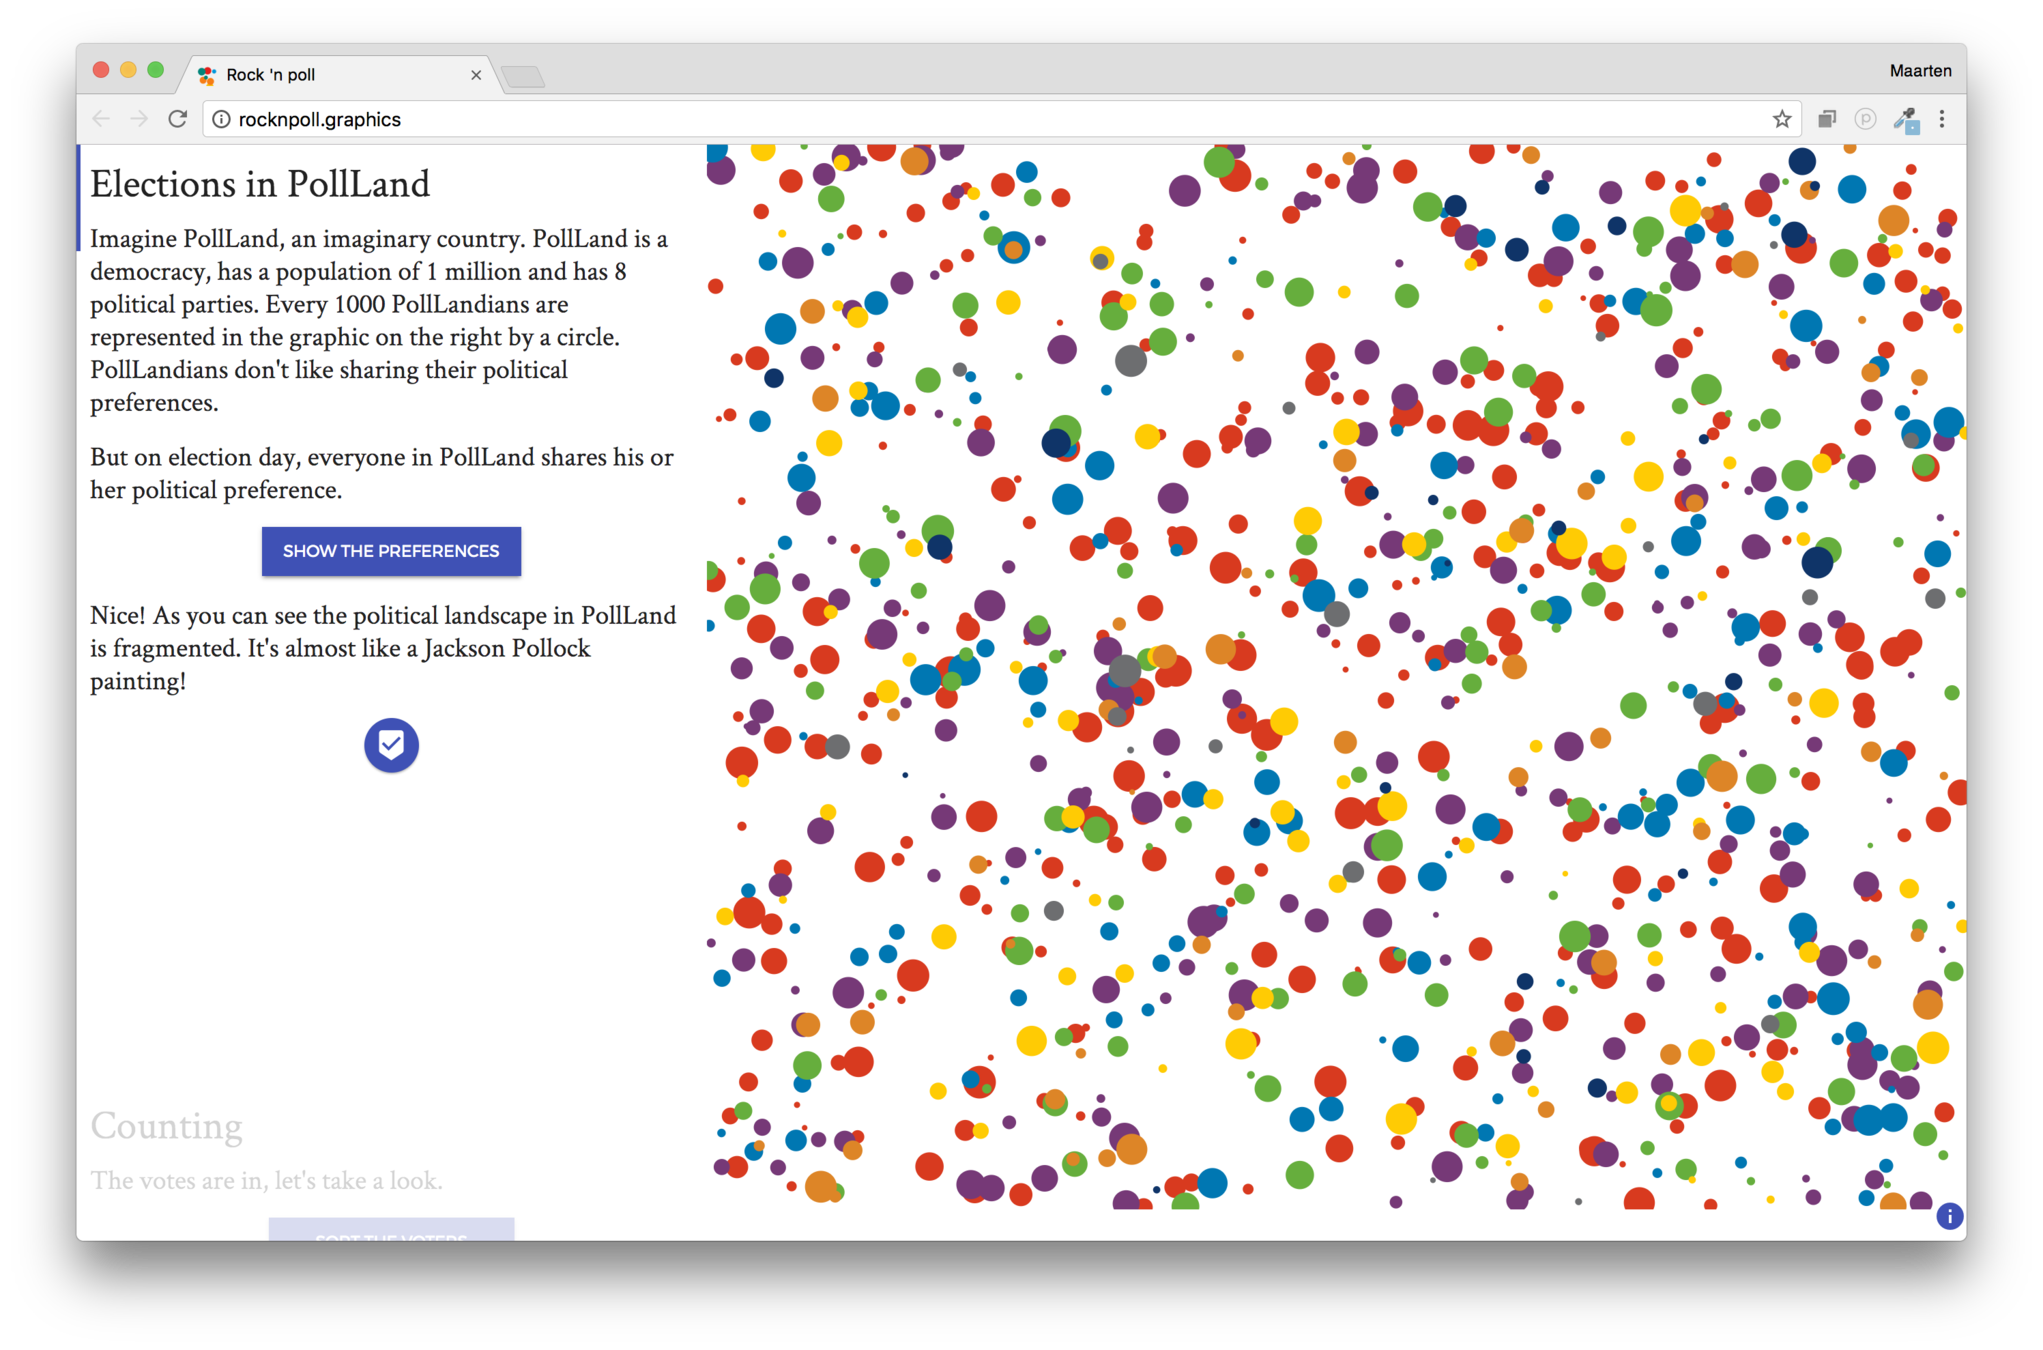
Distribute distributions
Summary statistics rarely describe somebody's lived experience and never ring true for the whole population
Show the full distribution wherever possible, as this demonstrates the full range of circumstances experienced by different people.


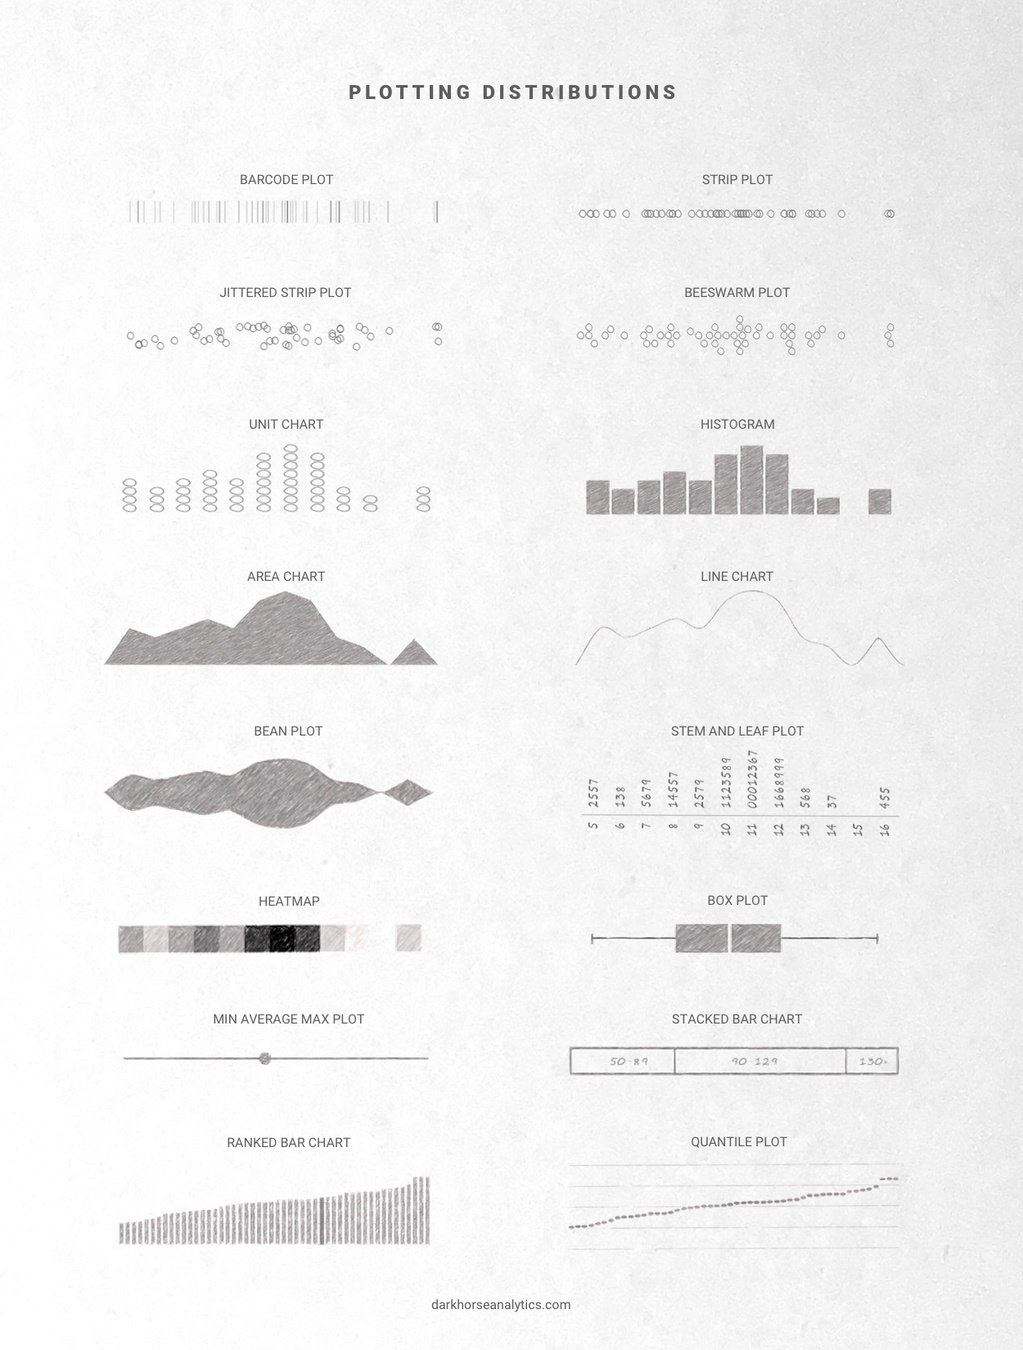
Your data is so much more then the average
Show the distributions when you can
Correlation is not causation

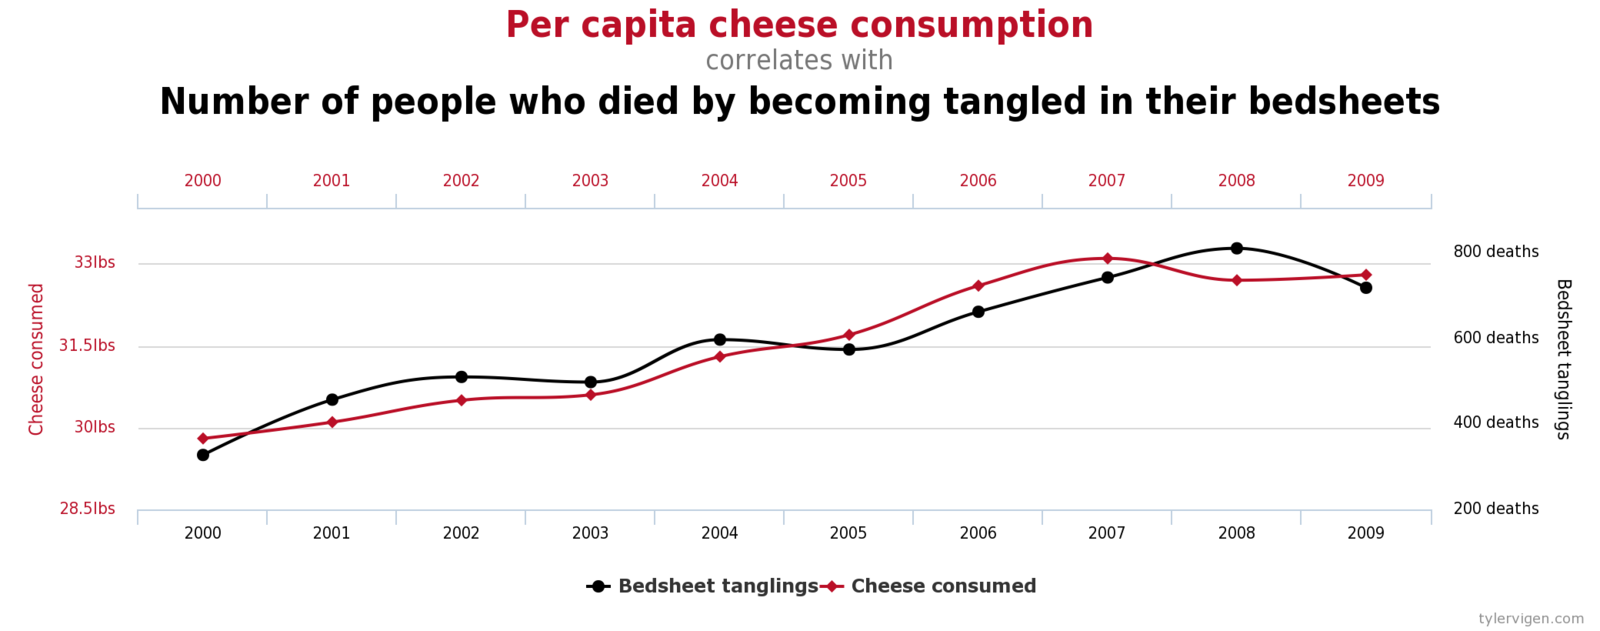

Correlation. Is. Not. Causation.
The ecological fallacy
The average IQ in this room is higher than the average at Dataharvest.
What can we deduce from this about a randomly picked person in this room?
An ecological fallacy is the interpretation of statistical data where inferences about individuals are made from data about a group to which those individuals belong.
Electoral districts with a lot of elderly people tended to vote more 'Leave'. So older people voted more 'Leave'?
Don't infer things about individuals when you only have group statistics
Margins of error
In polls, changes < 3% are probably not worth your attention
Big and small chances
Eating bacon every day doubles the chance of getting bowel cancer
+ 100%!
0,0002 % chance to 0,0004 %
(+ 0,0002 percentage points)