Journalistic techniques for storytelling with official statistics
June 7
2019
Statistics NARRATED
Eurostat
Luxembourg
Maarten
Lambrechts
Maarten Lambrechts?
Today
Storytelling and journalism
Storytelling and Stats Explained
Lunch
Telling stories with data visualisation
Makeover of a Statistics Explained article
9:30-10:45
11:00-12:30
12:30-14:00
14:00-15:30
15:30-17:00
Storytelling
I
Once upon a time...


I told you a story
Once upon a time,
somewhere
there was someone
or something
who did something or something happened to him/her/it
which resulted in him/her/it/someone
doing or being something else
Context
Character
Cause
Effect
Actually, I told you another story...
...and I told the readers a story
Stories are everywhere
Paintings, newspapers, games, novels, papers, fairytales, television, sports, religion, advertisement, theater, politics, science, poetry, manuals, ...
Through stories, we
Learn
Understand
Remember
Convey ideas
Literary stories
Evoke emotions
through empathy
Have a story arc:
problem, resolution, climax, ...
Teach you something (morale, society, ...)
Some narrative patterns
Narrator
Cause and effect
Sensory language
Crosslinking: looking forward, looking backward, coming full circle
Appeal
News stories
Inform rather than entertain
Features
~ Literary stories, no Eurostat equivalent
Breaking news
~ Eurostat press release
Explainers
~ Statistics Explained
Types of news stories
5 journalistic techniques
5W, 1H
Where?
When?
Who?
What?
Why?
How?
Context
Context
Character
Cause and effect
Sensemaking
The inverted pyramid
The News
important details
BackgrouND
Journalistic reality
Fixed length
Breaking news comes in
'When in doubt, leave things out'
'Cut from the bottom'
Make it personal
Address the reader
Put the "you" in the headline
Put in real people
Personification
Use a narrator
Storytelling and Statistics Explained
II
"Statistics Explained is both an innovative electronic publishing platform and a gateway to Eurostat's statistical information, providing rich information on any statistical subject treated by Eurostat. Because it works in a way similar to Wikipedia, it is easy to use and easy to navigate.
Statistics Explained is:
- an encyclopaedia on European Union statistics;
- a portal to further information for occasional and for regular users;
- a statistical glossary."
Media
Goal 1: attract readers, sell ads
Goal 2: impact, change behaviour
Interpretation and sensemaking
Offers insights
Newsworthiness
Framing
(Cherry)picking numbers
Informing + entertaining
Rational and emotional
Stat office
Goal 1: publish data
Goal 2: disseminate data
Reporting of numbers
User needs to create insight
Disconnected from news cycle
Neutral
All the data
Data publishing + informing
Rational
Data
publishing
Storytelling

The relevant characteristics of Statistics Explained:
- publication platform (both collaboration wiki and dissemination channel) for all Eurostat's published content (to a large extent replacing paper-only publications of the past):
- statistical articles presenting description and analysis of data;
- background articles on methods, nomenclatures, context, ...;
- online publications (= briefly introduced table of contents linking to individual articles);
- glossary items.
Stories for the Statistics Explained user
Disclaimer
Looking to Statistics Explained from a journalistic perspective
Might contradict existing guidelines
Might go beyond CMS's capabilities
The Statistics Explained user is online
Next page is only on click away
Next page is only one tap away
Visual consumption
The homepage is was dead
Statistics Explained, your guide to European statistics. Statistics Explained is an official Eurostat website presenting statistical topics in an easily understandable way. Together, the articles make up an encyclopedia of European statistics for everyone, completed by a statistical glossary clarifying all terms used and by numerous links to further information and the latest data and metadata, a portal for occasional and regular users.
From the Statistics Explained homepage
The Statistics Explained user is a non-expert
Not familiar with the topic jargon
Not familiar with statistical jargon
Easily scared away
Likes stories
The headline is crucial, sometimes the only thing the users see
Trigger the user to click through/start reading
Short Not too long
SEO-proof: should contain the topic
1 message
Headlines
Before
After
How EU unemployment rose and fell over 20 years
Unemployment down in all EU member states
Meet the only EU country where unemplopyment didn't go down
Unemployment down all accross Europe: how is your country doing?
Before
After
Statistics prove it: Air Europe keeps doing well
EU air transport leaves crisis behind
50 million passengers each year: 4 EU airports do it. Do you know which ones?
The lead
Your second chance to convince the reader to read your piece
Should contain 5W 1H
No details
Contains most newsworthy elements
New statistics are never the 'What'
Newsworthy?
surprising
counterintuitive
in the news
record
everyday life
particular group
Before
This article presents an overview of European Union (EU) statistics related to mental and behavioural disorders, Alzheimer’s disease (which is a disease of the nervous system) and intentional self-harm (which is an external cause of morbidity and mortality). It focuses on four aspects:
- deaths from mental and behavioural disorders, Alzheimer’s disease and intentional self-harm;
- the extent of depressive disorders;
- healthcare for mental and behavioural disorders and Alzheimer’s disease; and
- the availability of specialist healthcare resources (beds and personnel).
After
Each year more than 180.000 mental patients die from their illness in Europe. The number of specialists taking care of the mentally ill is growing, but at the same time the number of psychiatric beds in hospitals is declining.
Before
This article presents statistics on the mobility of tertiary education students in the European Union (EU) and forms part of an online publication on education and training in the EU. It focuses on tertiary education students who are internationally mobile. In theory, this concerns students studying in an EU Member State who completed their secondary education elsewhere (regardless of whether this was in another EU Member State or in a non-member country); in practice, a number of different criteria are used, notably the country of usual or previous residence, or citizenship. The first part of the analysis focuses on tertiary students and the second part on tertiary graduates, with a brief final analysis comparing the number of students with the number of graduates.
After
Cultural and historical ties determine the origin of foreign students accross the EU. 1 in 2 foreign students in the United Kingdom comes from Asia, while you will find many African students in France and Latin American students in Spain.
Lead can help you focus
Start your writing process with the lead
Body
General writing guidelines
Be consistent
Avoid repetitions
Active verbs
Avoid jargons
Avoid definition codes
Write the article for your mother


Schoolgirl
Journalist
Business analyst
Professor
Writing for websites
Short sentences
Short paragraphs
Make text scannable:
bolding, subheadings, pull quotes

Telling stories with data visualisation
III
Why visualisation?
- Interpreting numbers becomes easier
- Trends become clearer
- Let users contextualise themselves
- Message is supported and amplified
- Augments reliability
- Makes long text breath
- Replaces lengthy paragraphs full of numbers (elevator journalism)
- Easy sharing of message
- Can be aesthetically pleasing
- Draws attention
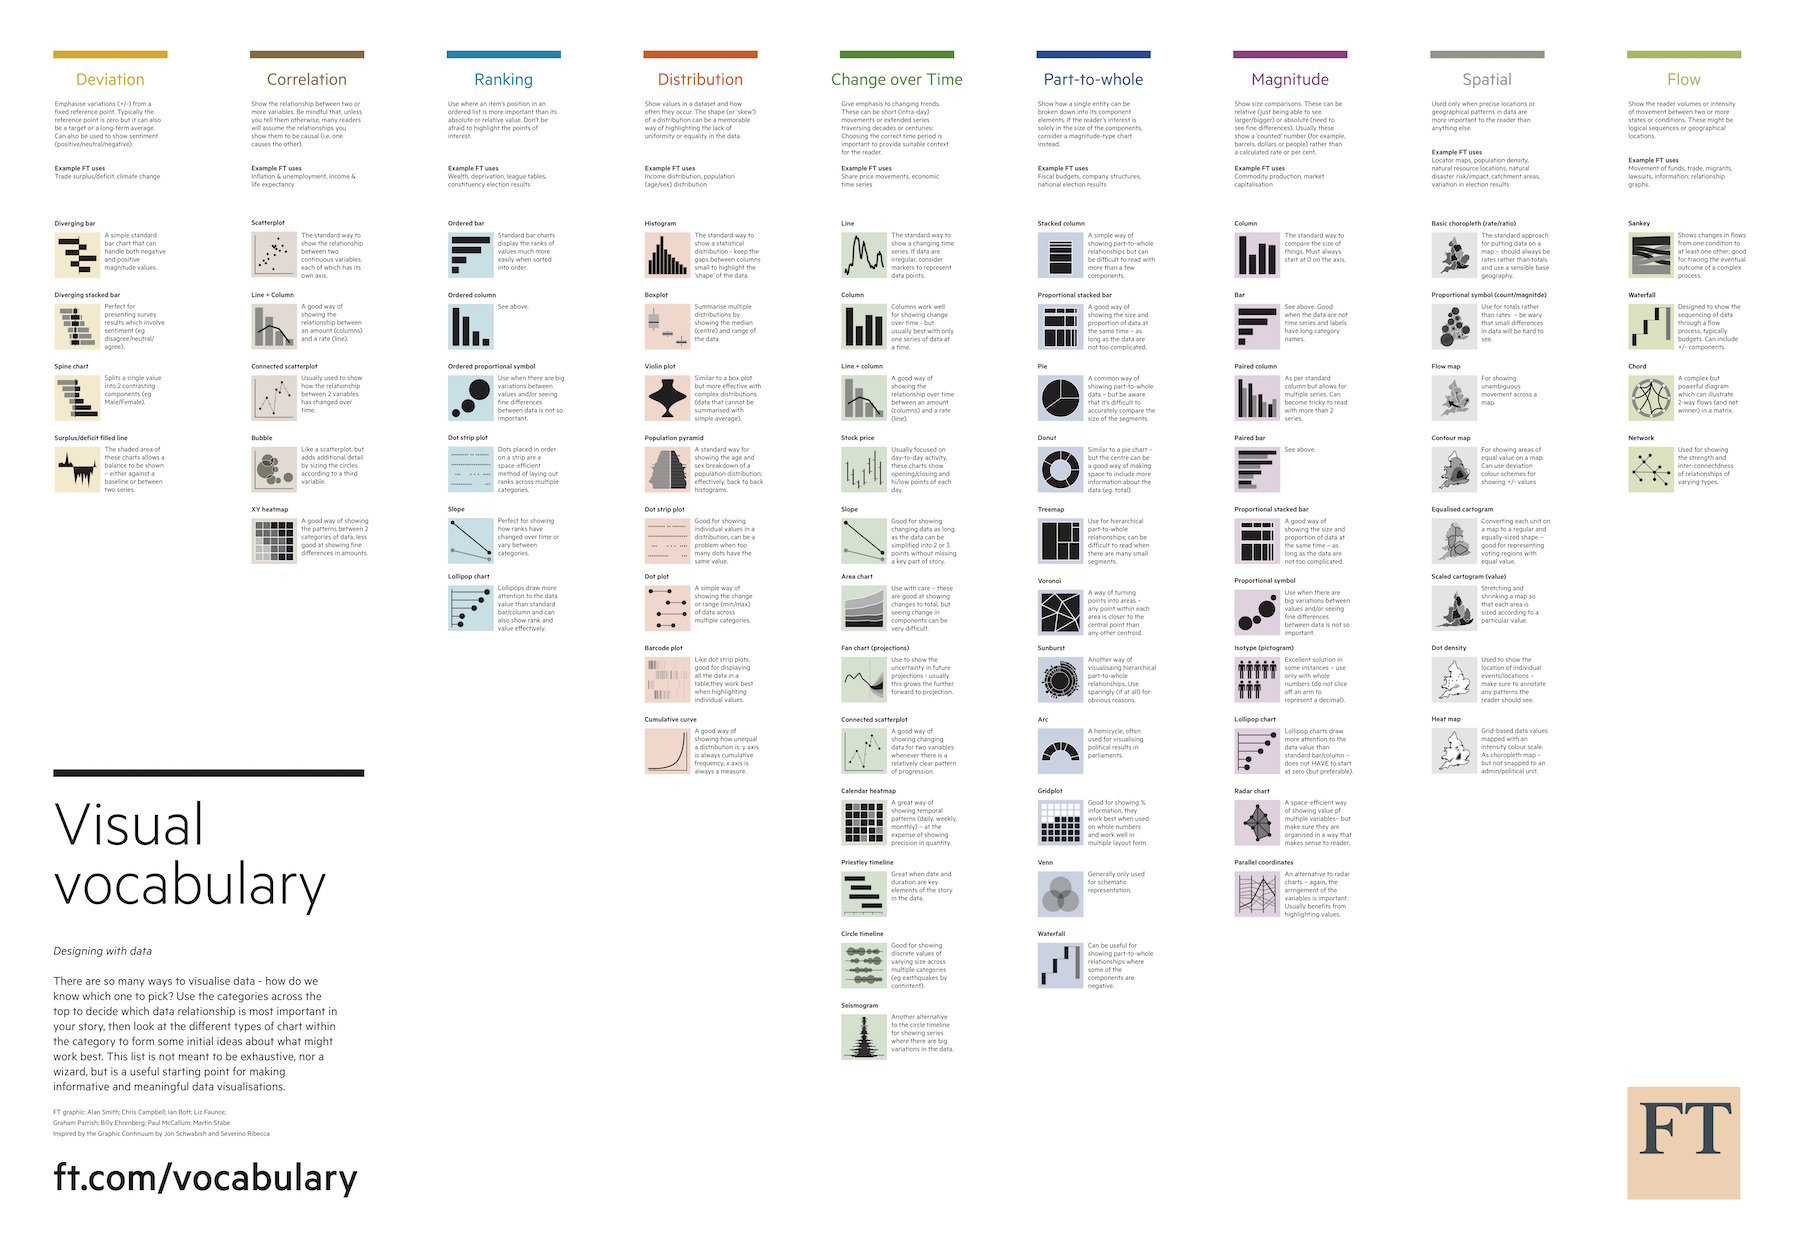
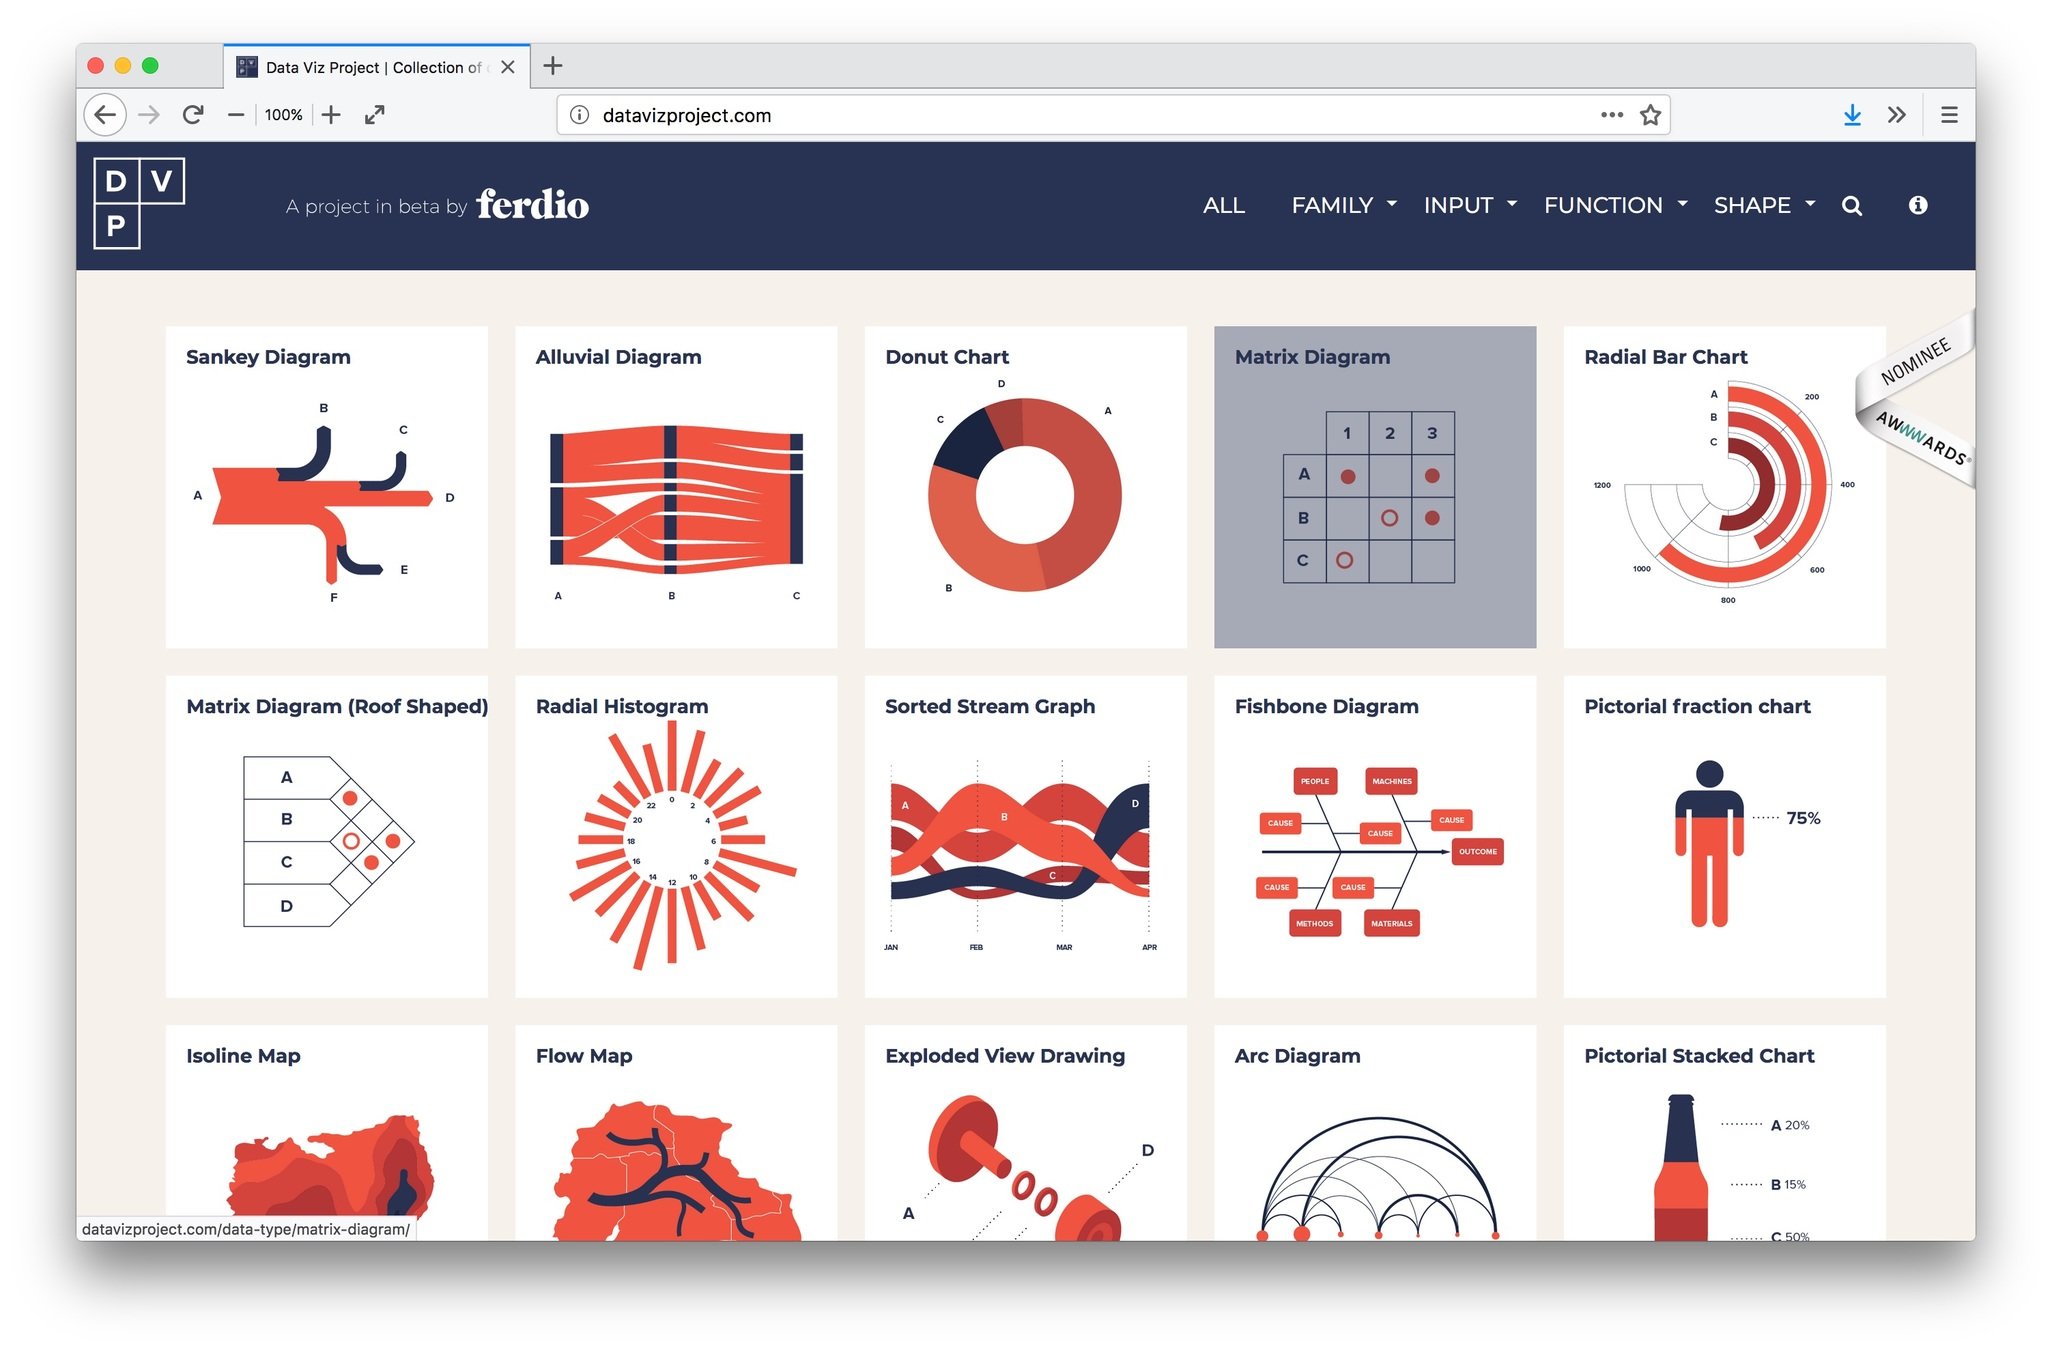
Bars or lines?
Something else?
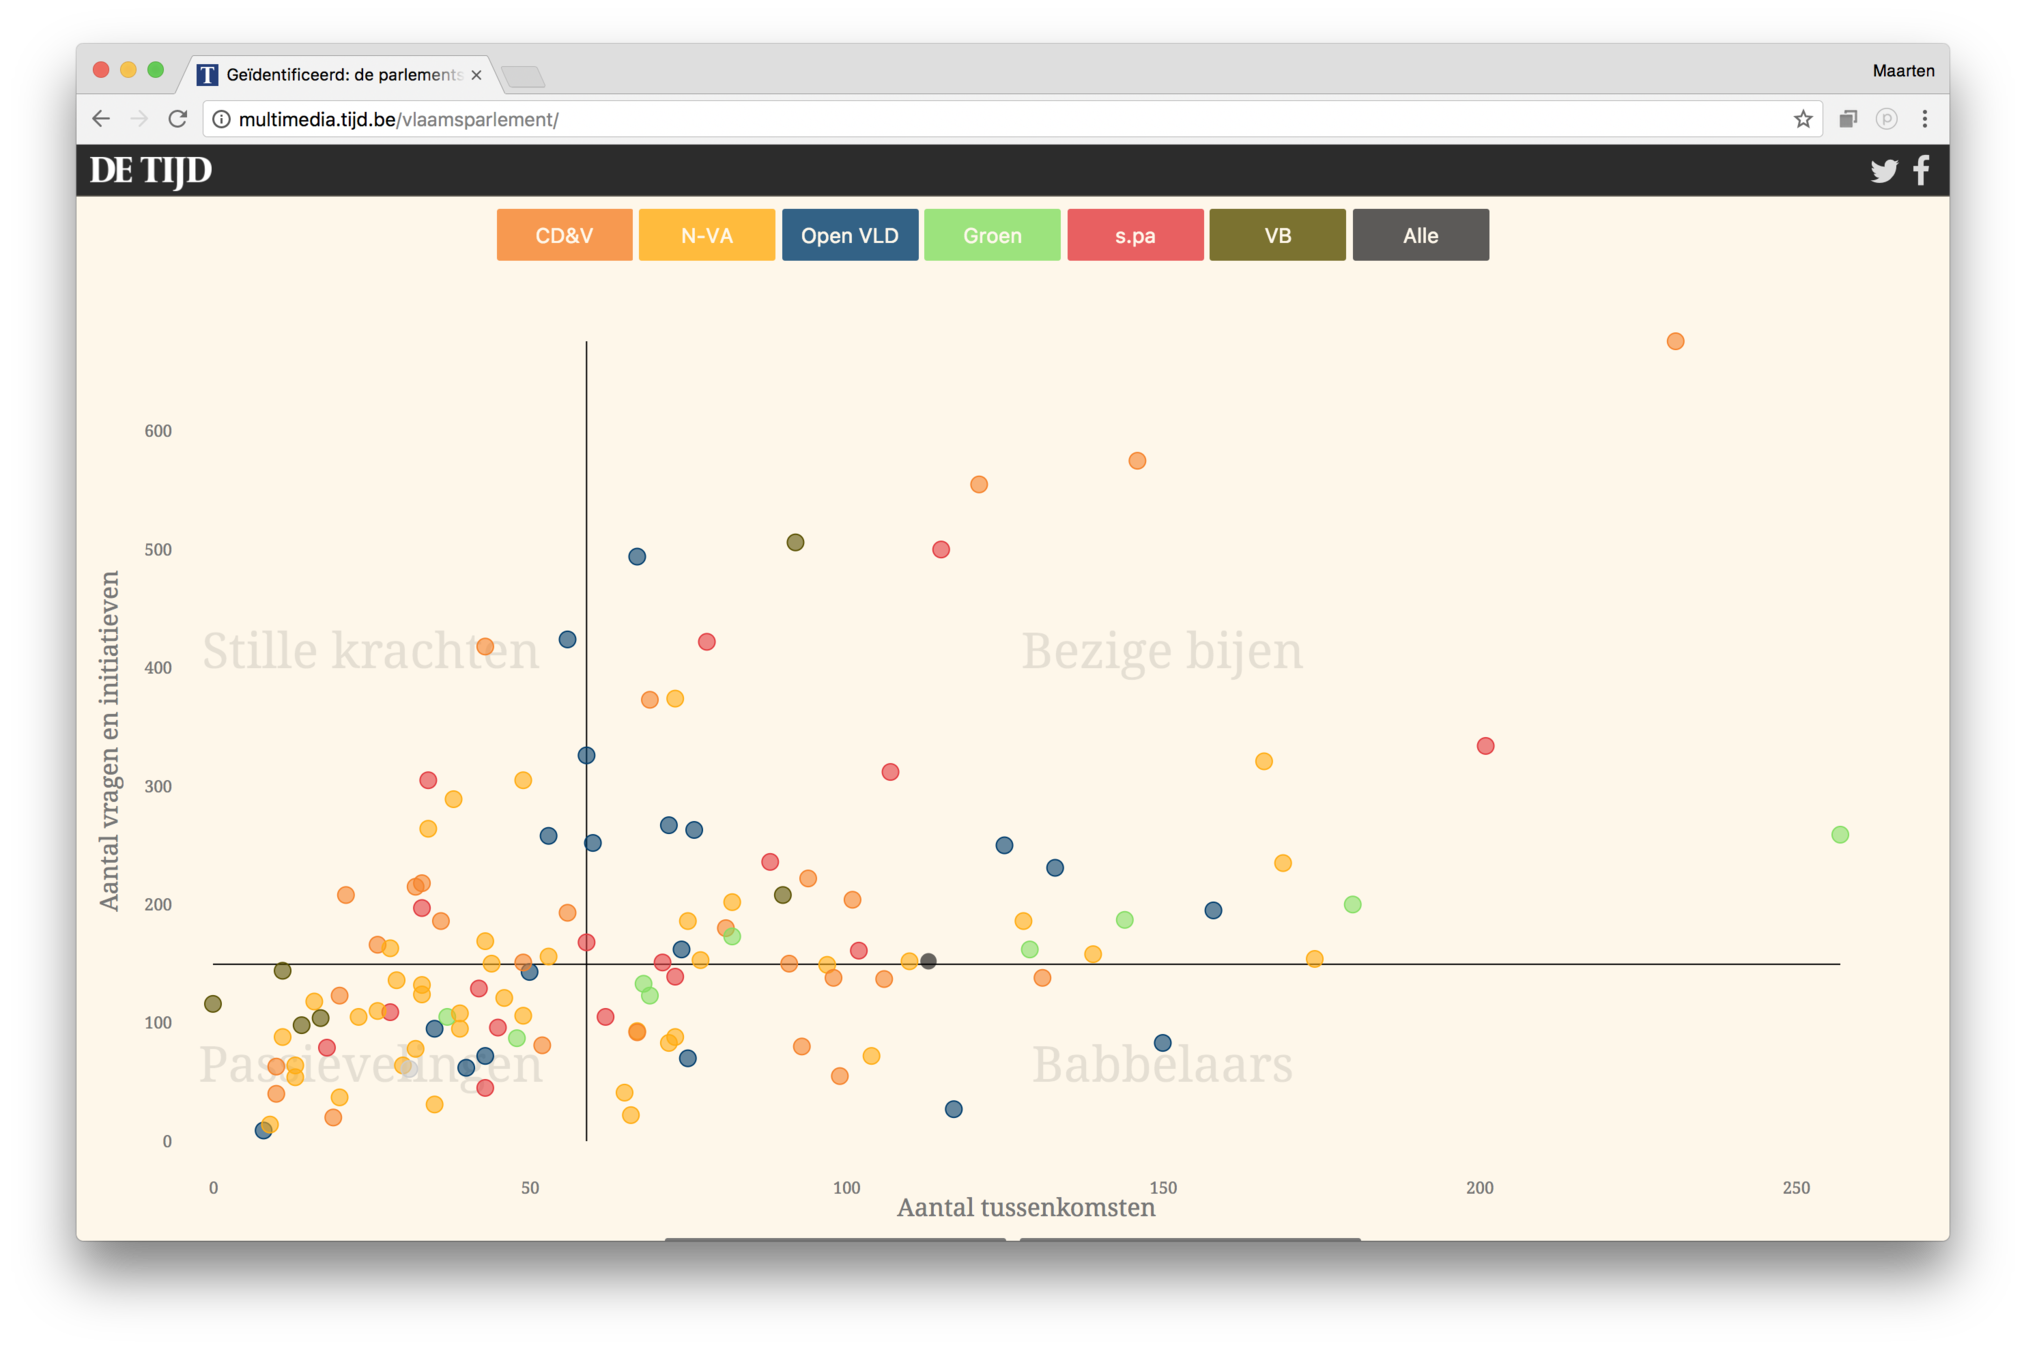
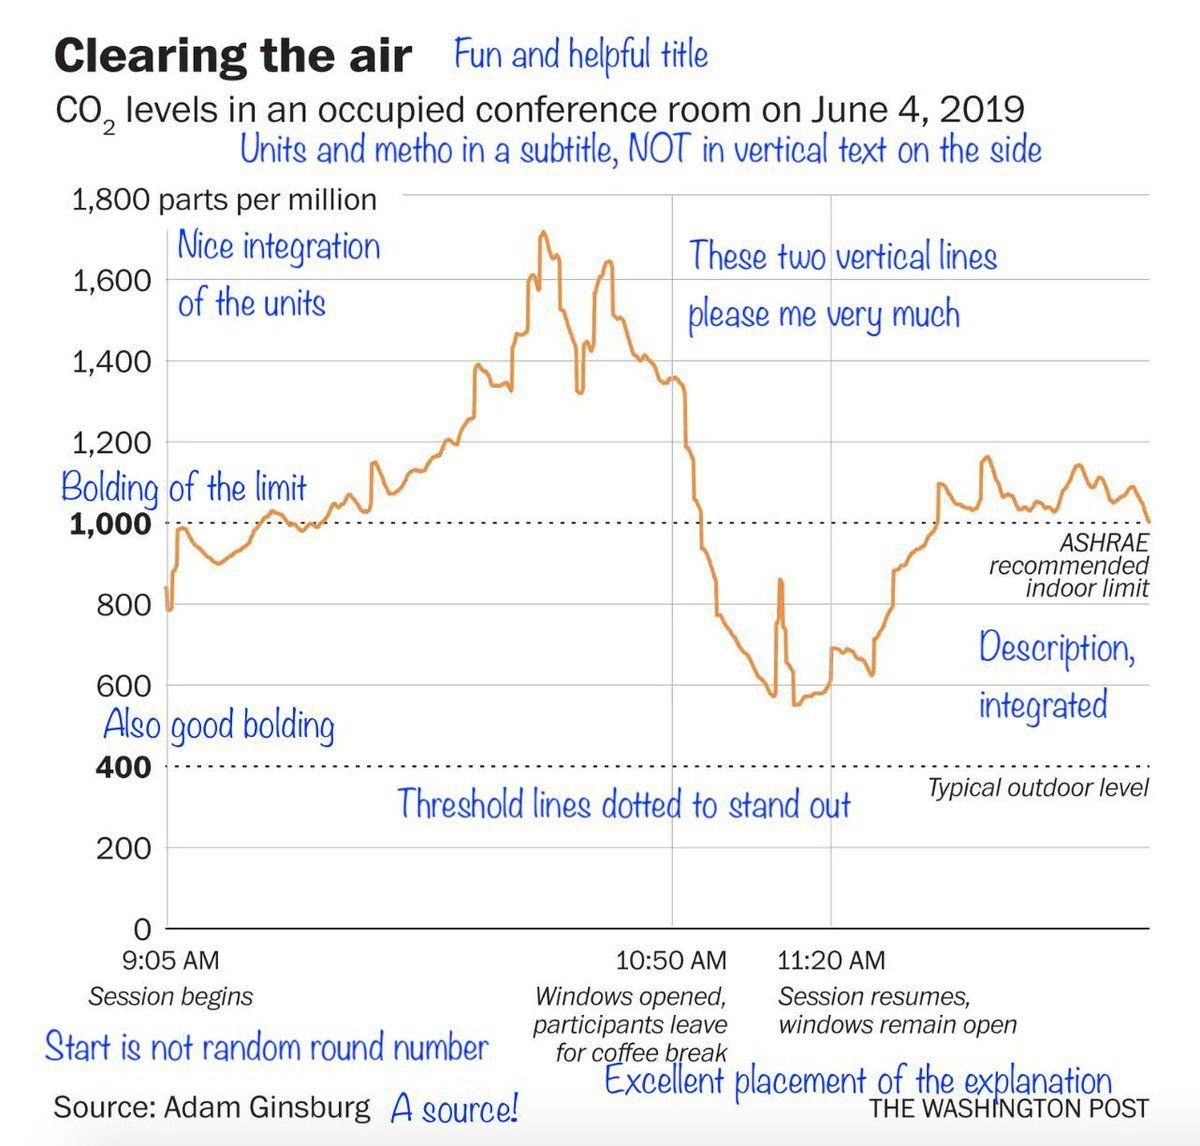
Title, colors and annotations tell the story of a chart


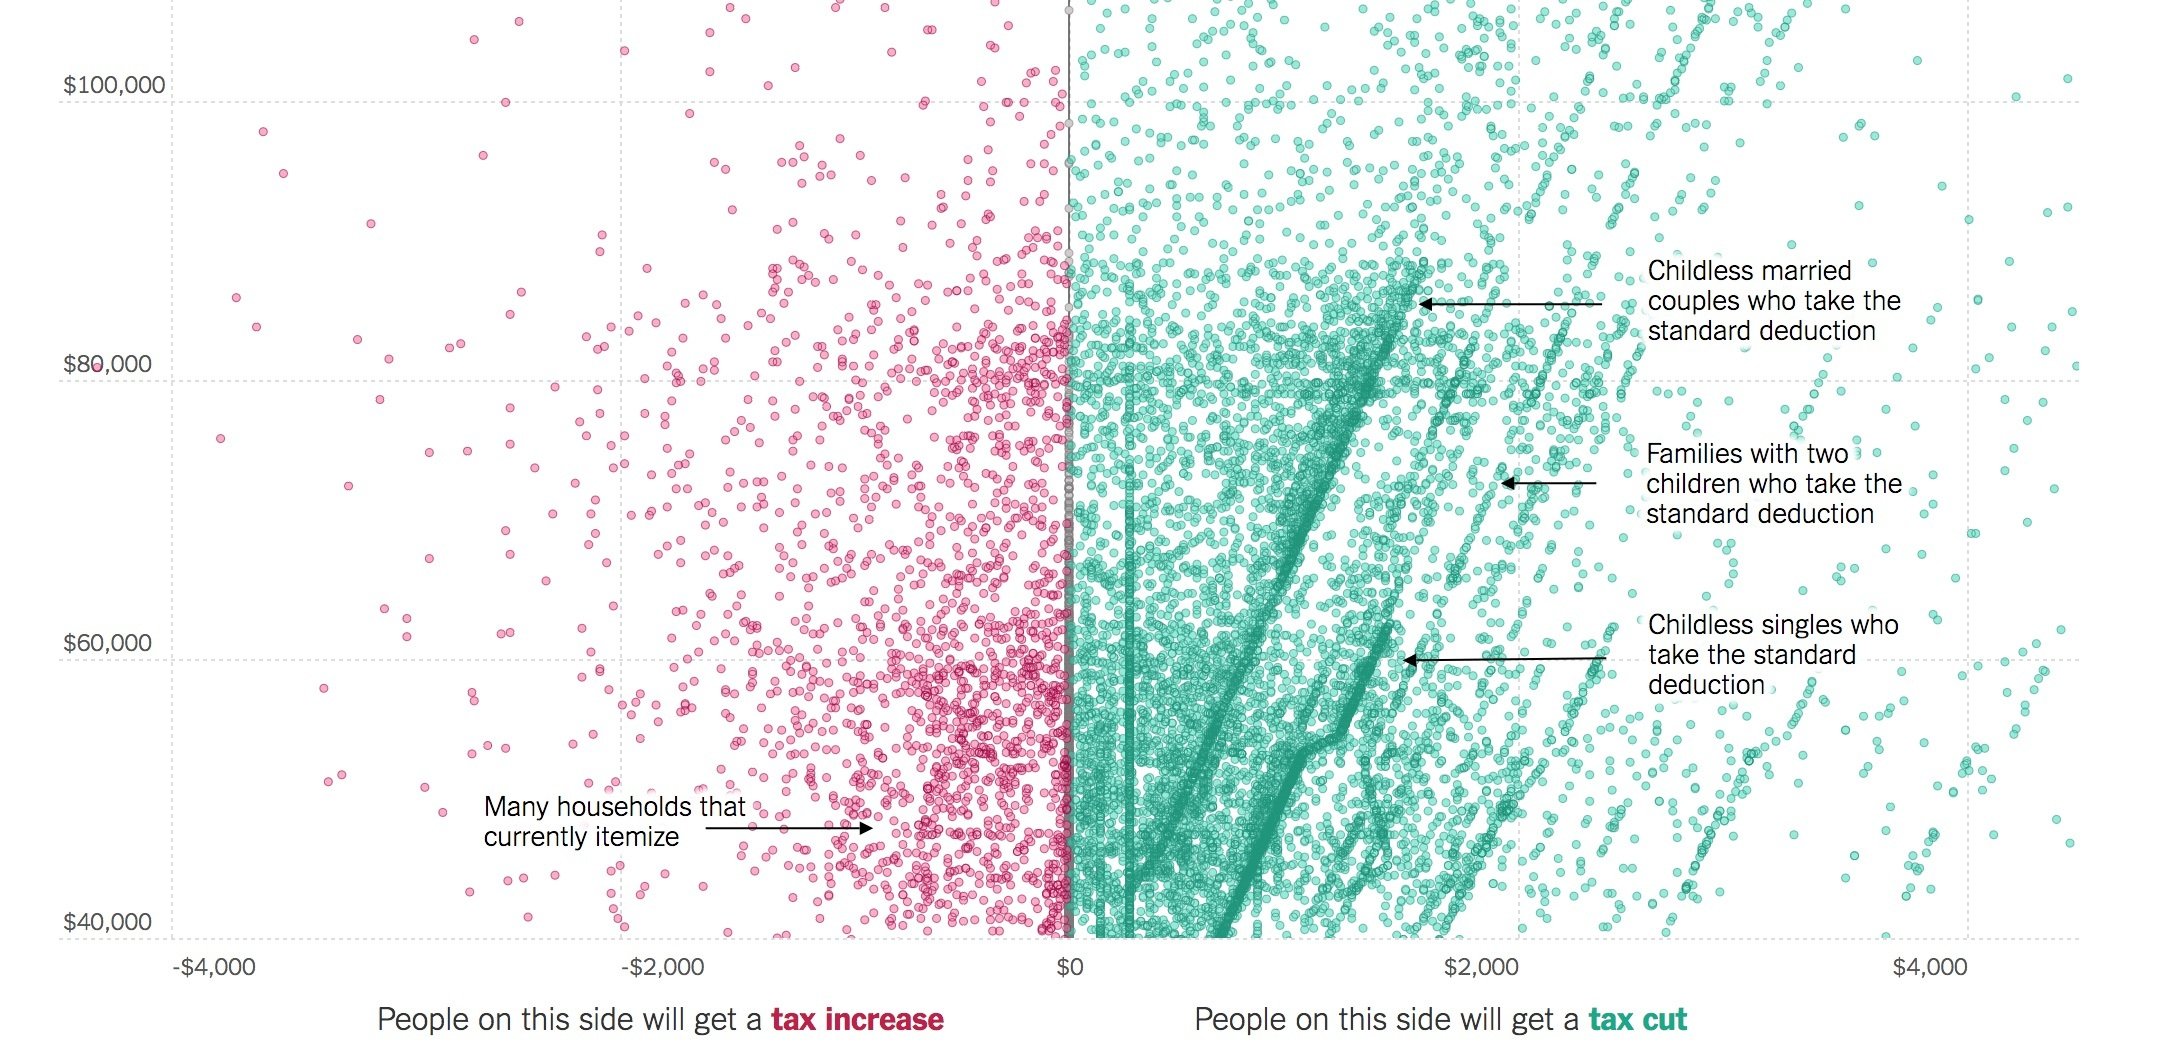
The annotation layer is the most important thing we do. Otherwise it's a case of here it is, you go figure it out.
Amanda Cox, New York Times


Text-visualisation relation
Make it easy for the reader
A chart referenced in the text should be next to the reference
Text and visualisation should have the same message, but work complementary
Don't repeat everything in text and visualisation
Make text and visualisation not contradict each other
Colors can be shared between text and visualisation
Colors and text can be linked together interactively
Visual stories

_YB17.png)


More storytelling with data visualisation:
The New York Times: How the recession shaped the economy in 255 charts
Hans Rosling: The best stats you've ever seen
Neil Halloran: The Shadow Peace
Makeover
Choose a Statistical Explained article
How could the article be made more attractive, more readable and more engaging for the general public?
Consider:
Main message and story?
5W 1H
Inverted pyramid
Headline
Lead
Writing improvements
How to tell the story with data visualisation?