The data
Before hacking hidden API's or write scrapers, you...
...ask politely


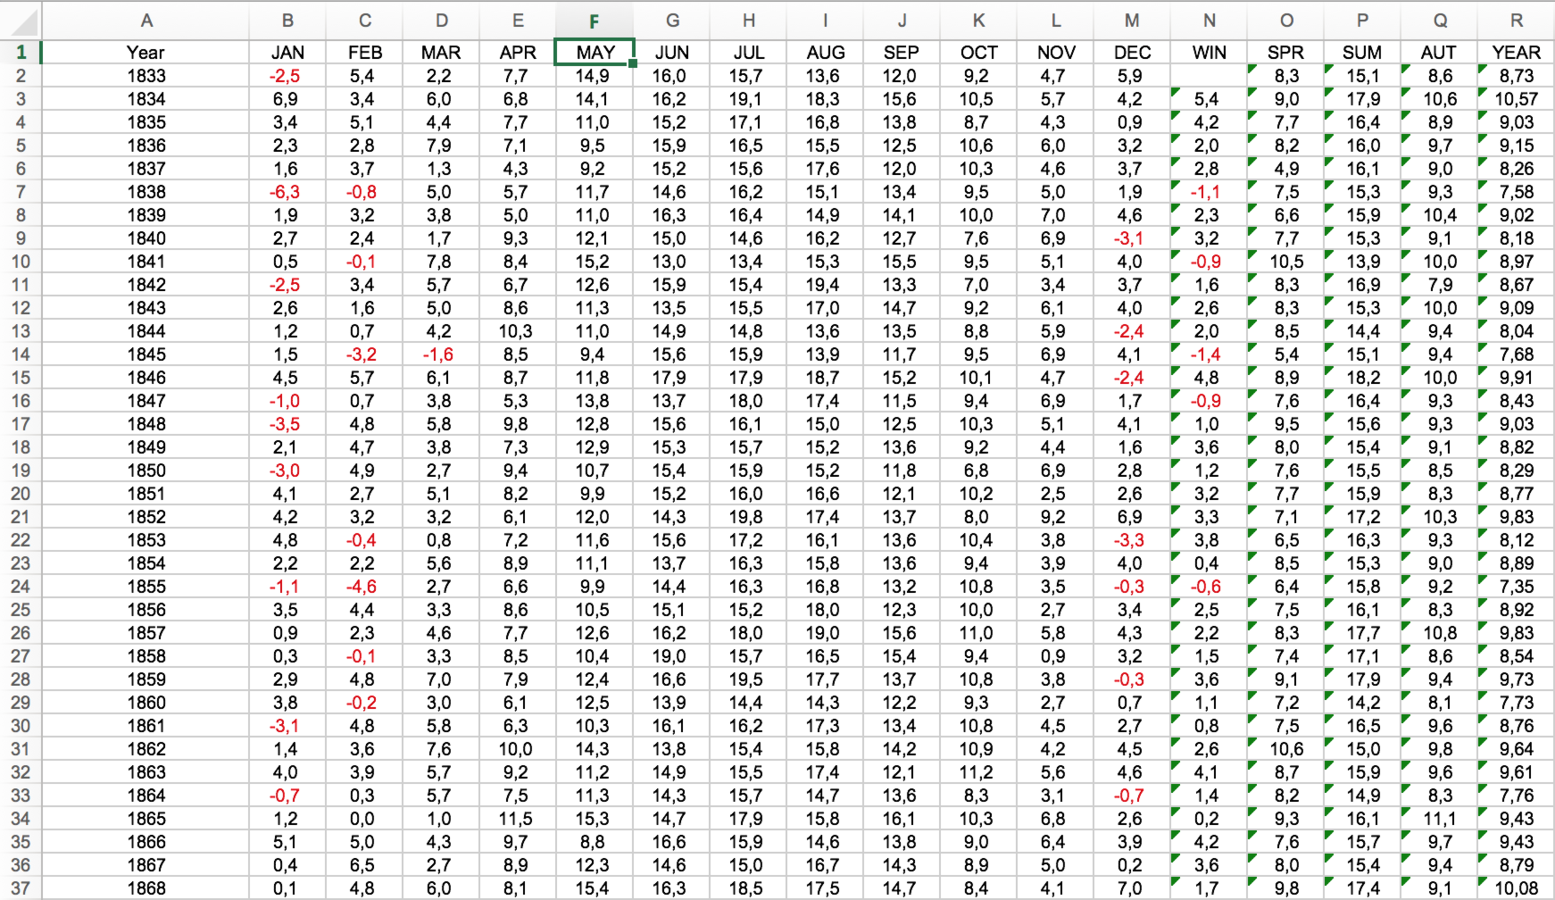
Meteo.be: Voorbije maanden
Technology
Some of my first steps in R
setwd("~/Sites/ukkel")
read.csv("ukkel_tt.csv", sep=";")
ukkel <- read.csv("ukkel_tt.csv", sep=";")
head(ukkel)
colnames(ukkel) <- c("Jaar","1","2","3","4","5","6","7","8","9","10","11","12")
head(ukkel)
melt <- melt(ukkel, id=c("Jaar"))
library("reshape2", lib.loc="/Library/Frameworks/R.framework/Versions/3.1/Resources/library")
melt <- melt(ukkel, id=c("Jaar"))
head(melt)
colnames(melt) <- c("Jaar", "Maand", "T")
head(melt)
write.csv(melt, "temperature2.csv")
Reused (a little) code from How the World Developed
d3.csv("temperature2.csv", function(error, data)   {
   ...
}
D3
Makes scales
Restructures data
Calculates lines (and interpolates)
Draws lines
Draws invisible lines for hover
D3 doesn't
Animate lines
Write functions for every step (animations and text)
Inspirational


Why does it work?
Tell the story
Make it lighter
Make it playful
Steps
Text linked to graphics
=
power
Familiar units
No 'diffs', 'anomalies', ...
but °C
Clean & smooth graphics
No chart junk
Almost no color
Rounded curves
'Complete' dataset
Familiar to everyone
Experienced by everyone
In the news