Data visualisation and data storytelling
THE UI AND UX OF DATA
29 May
2018
Maarten
Lambrechts
UX Meetup
Antwerpen
The UI of data
| Party | Oct 2010 | Sep 2012 | May 2013 | Oct 2013 |
|---|---|---|---|---|
| N-VA | 28,2 | 36,3 | 32,1 | 27,9 |
| CD&V | 17,6 | 18,5 | 17,4 | 19 |
| SP.A | 14,9 | 14,5 | 14,7 | 13,4 |
| VB | 12,6 | 9,5 | 10,6 | 10,6 |
| VLD | 14 | 10,7 | 10,1 | 13,8 |
| Groen | 7,1 | 7,9 | 9,5 | 10 |
| LDD | 3,7 | 1,3 | 0,4 | 1,3 |
| PVDA | 5 | 5 | 2,5 | 3,9 |
| Andere | 2 | 1,2 | 2,6 | 0,1 |

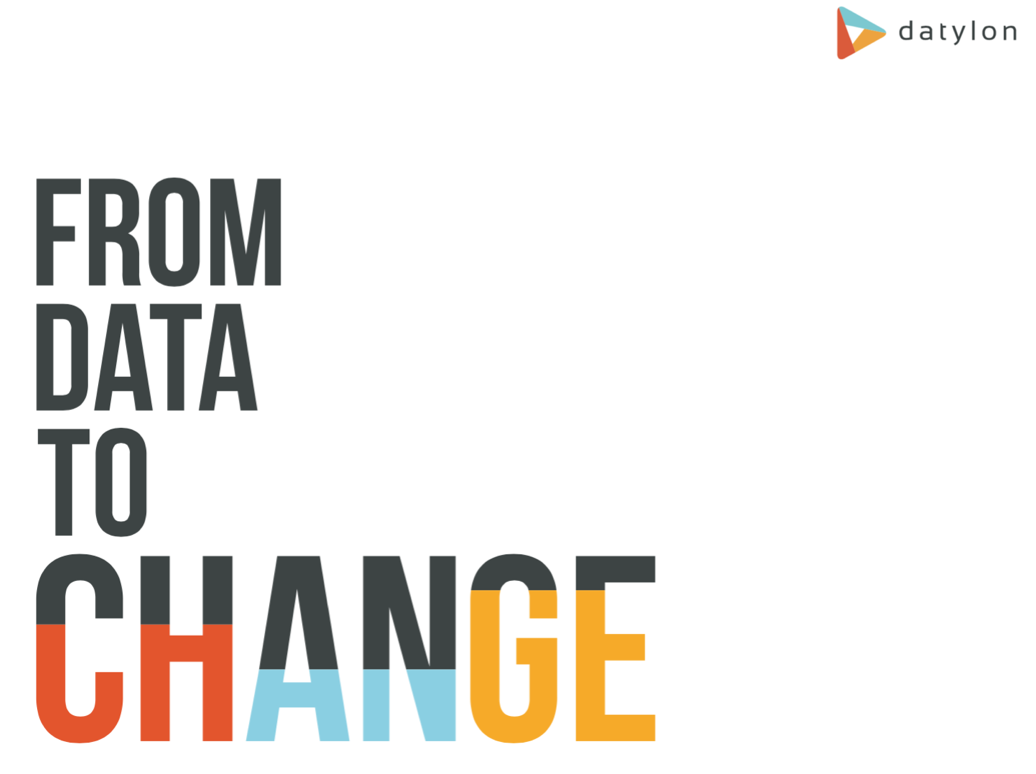
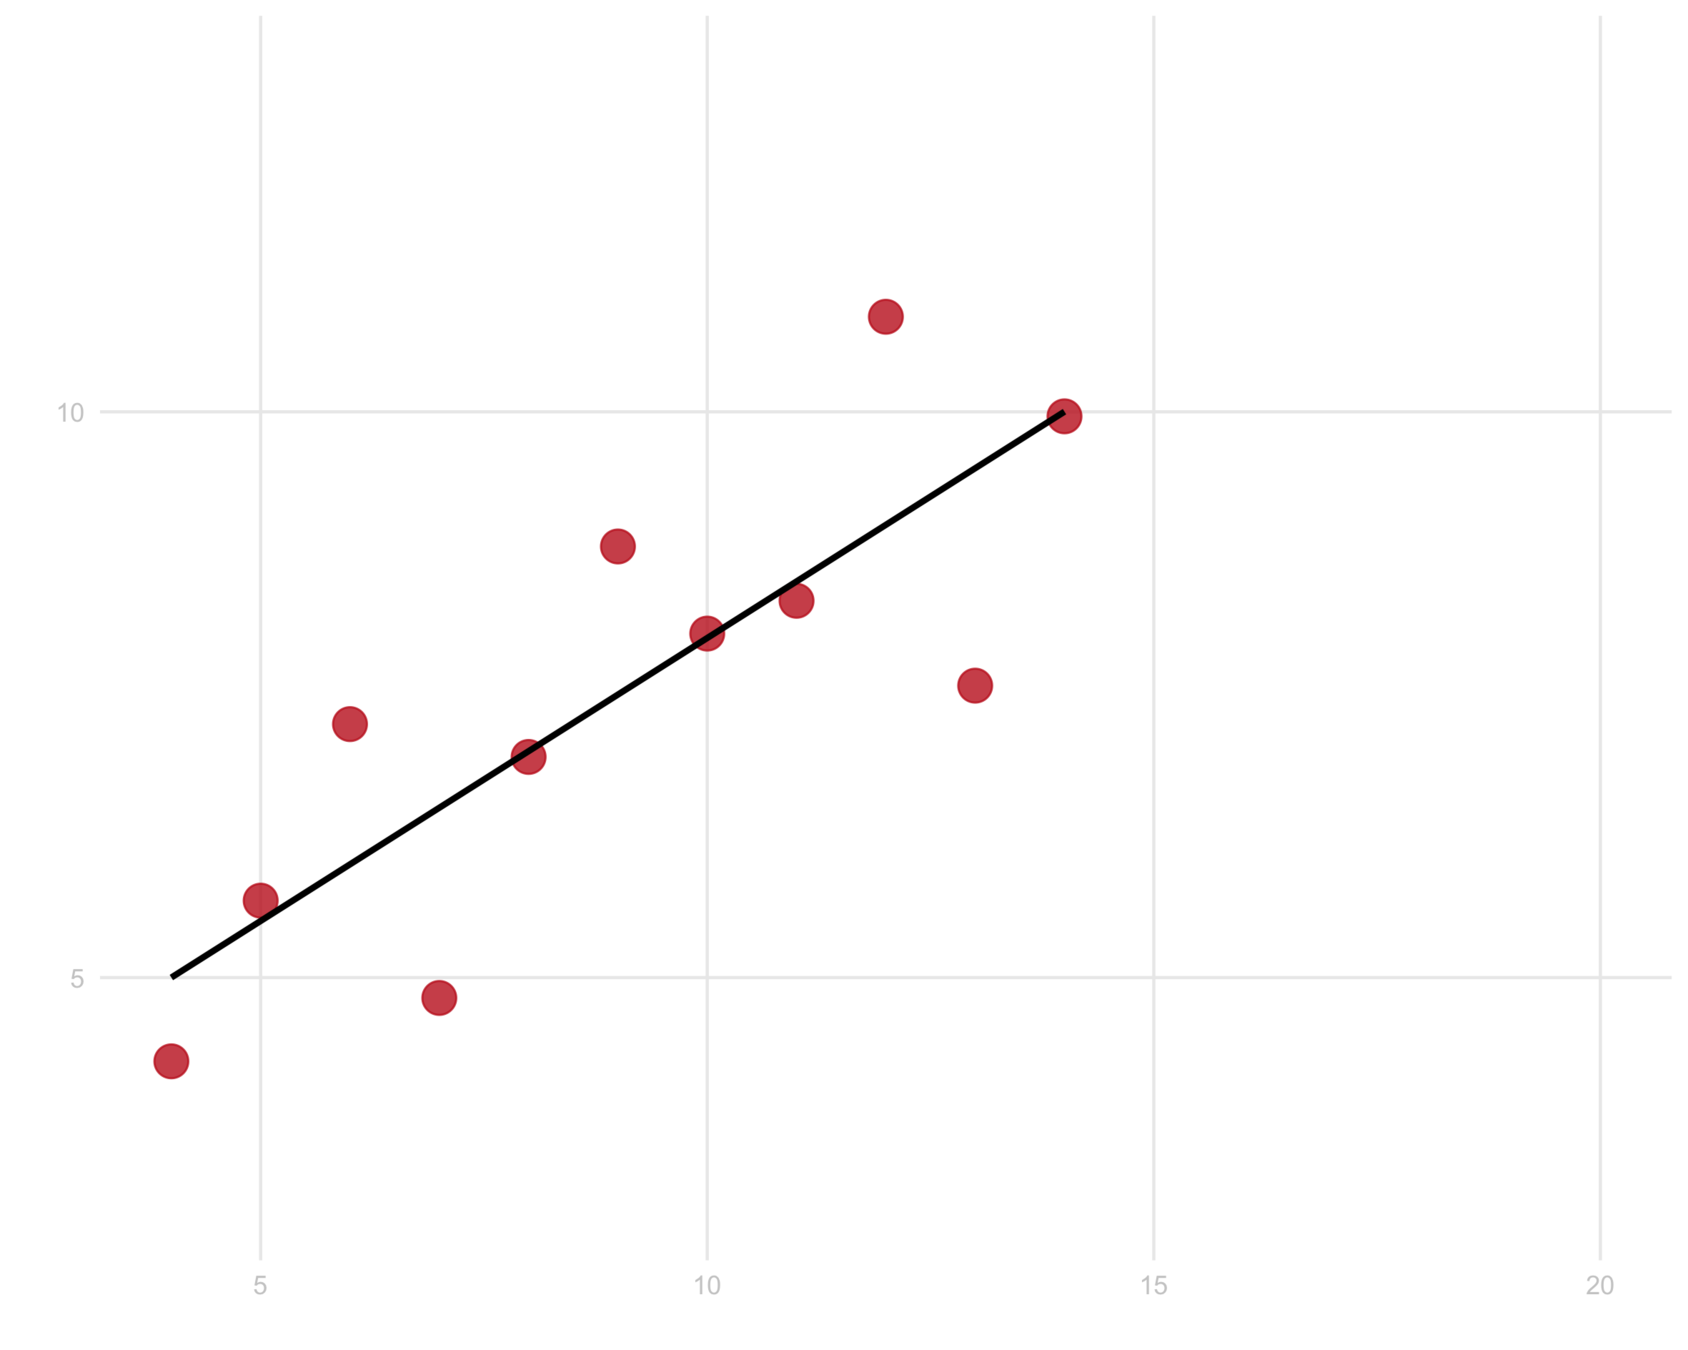
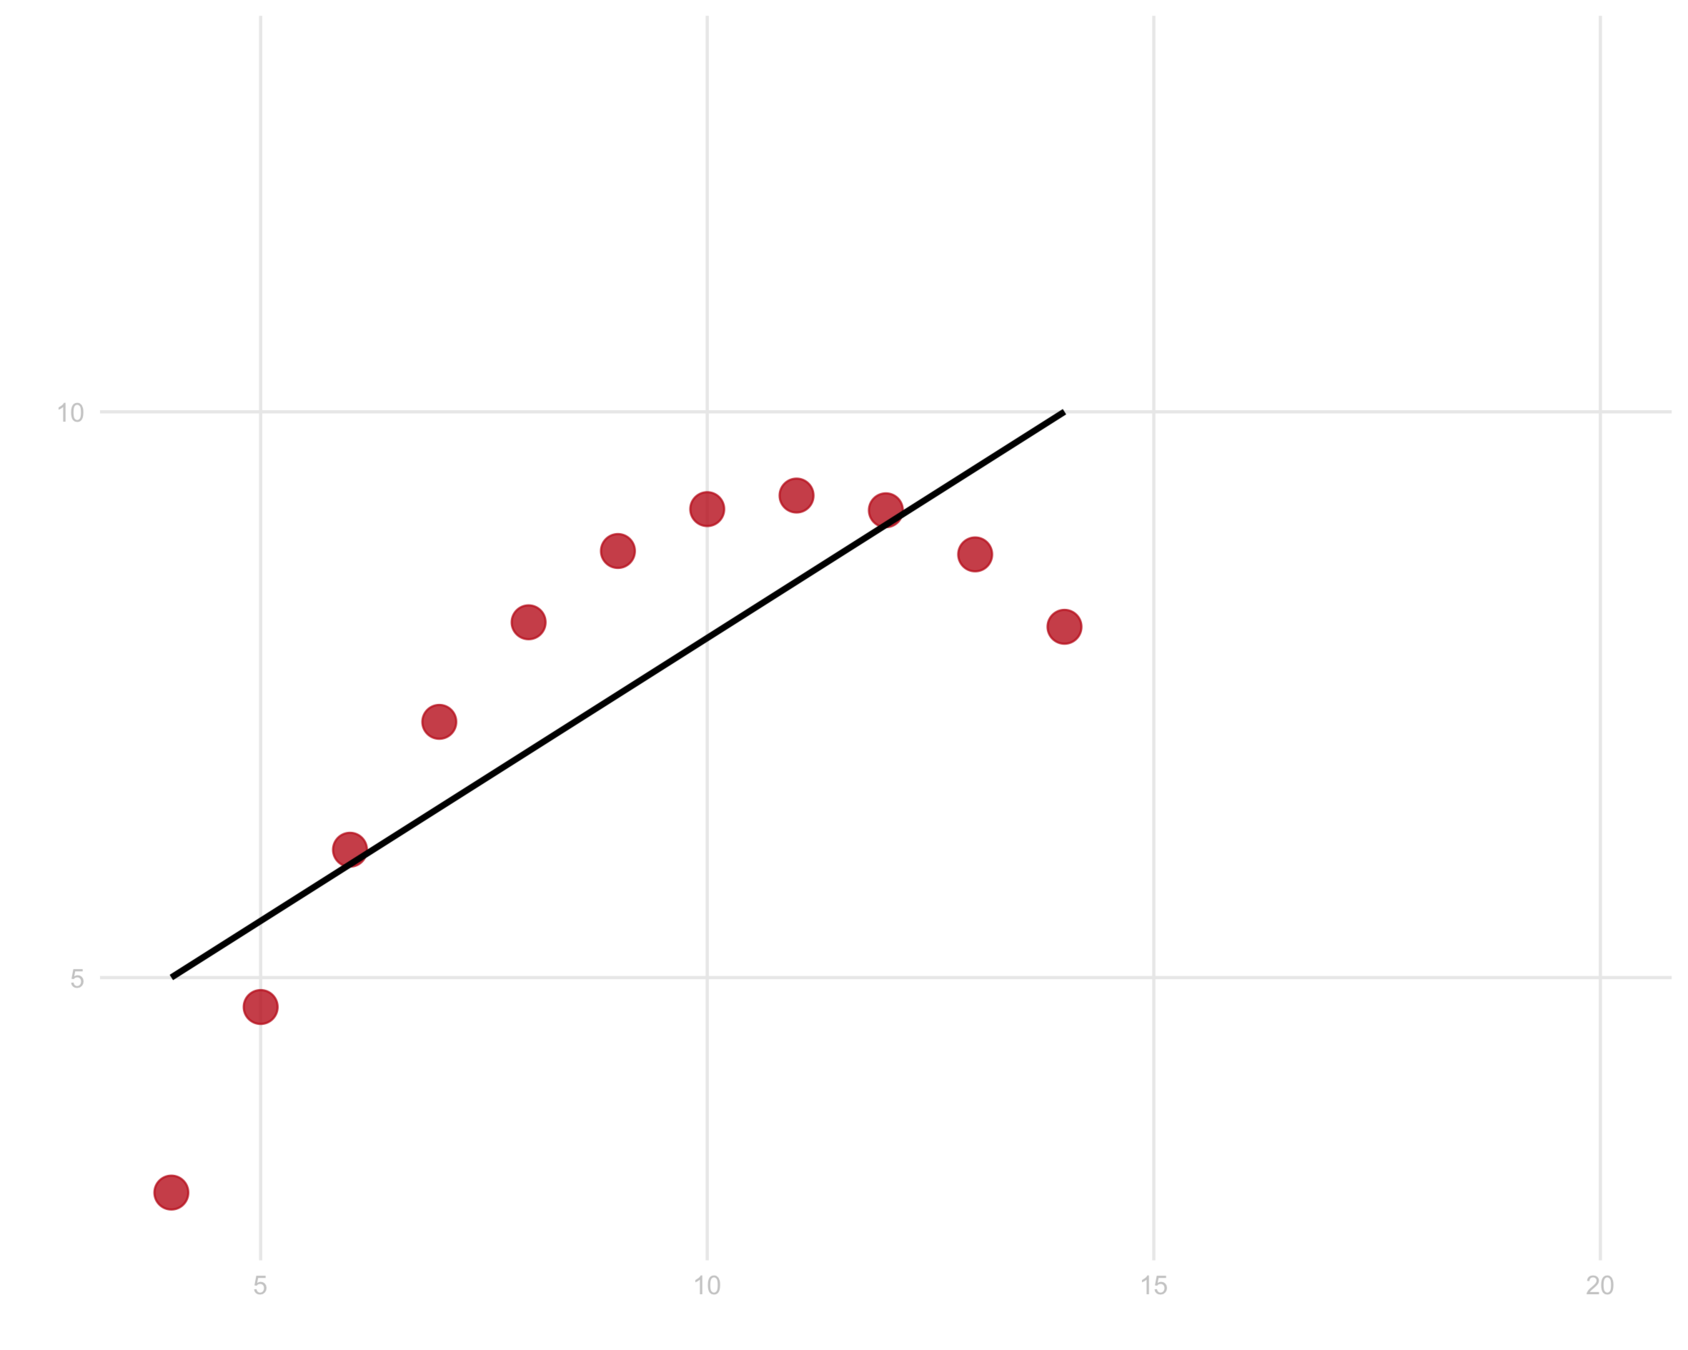
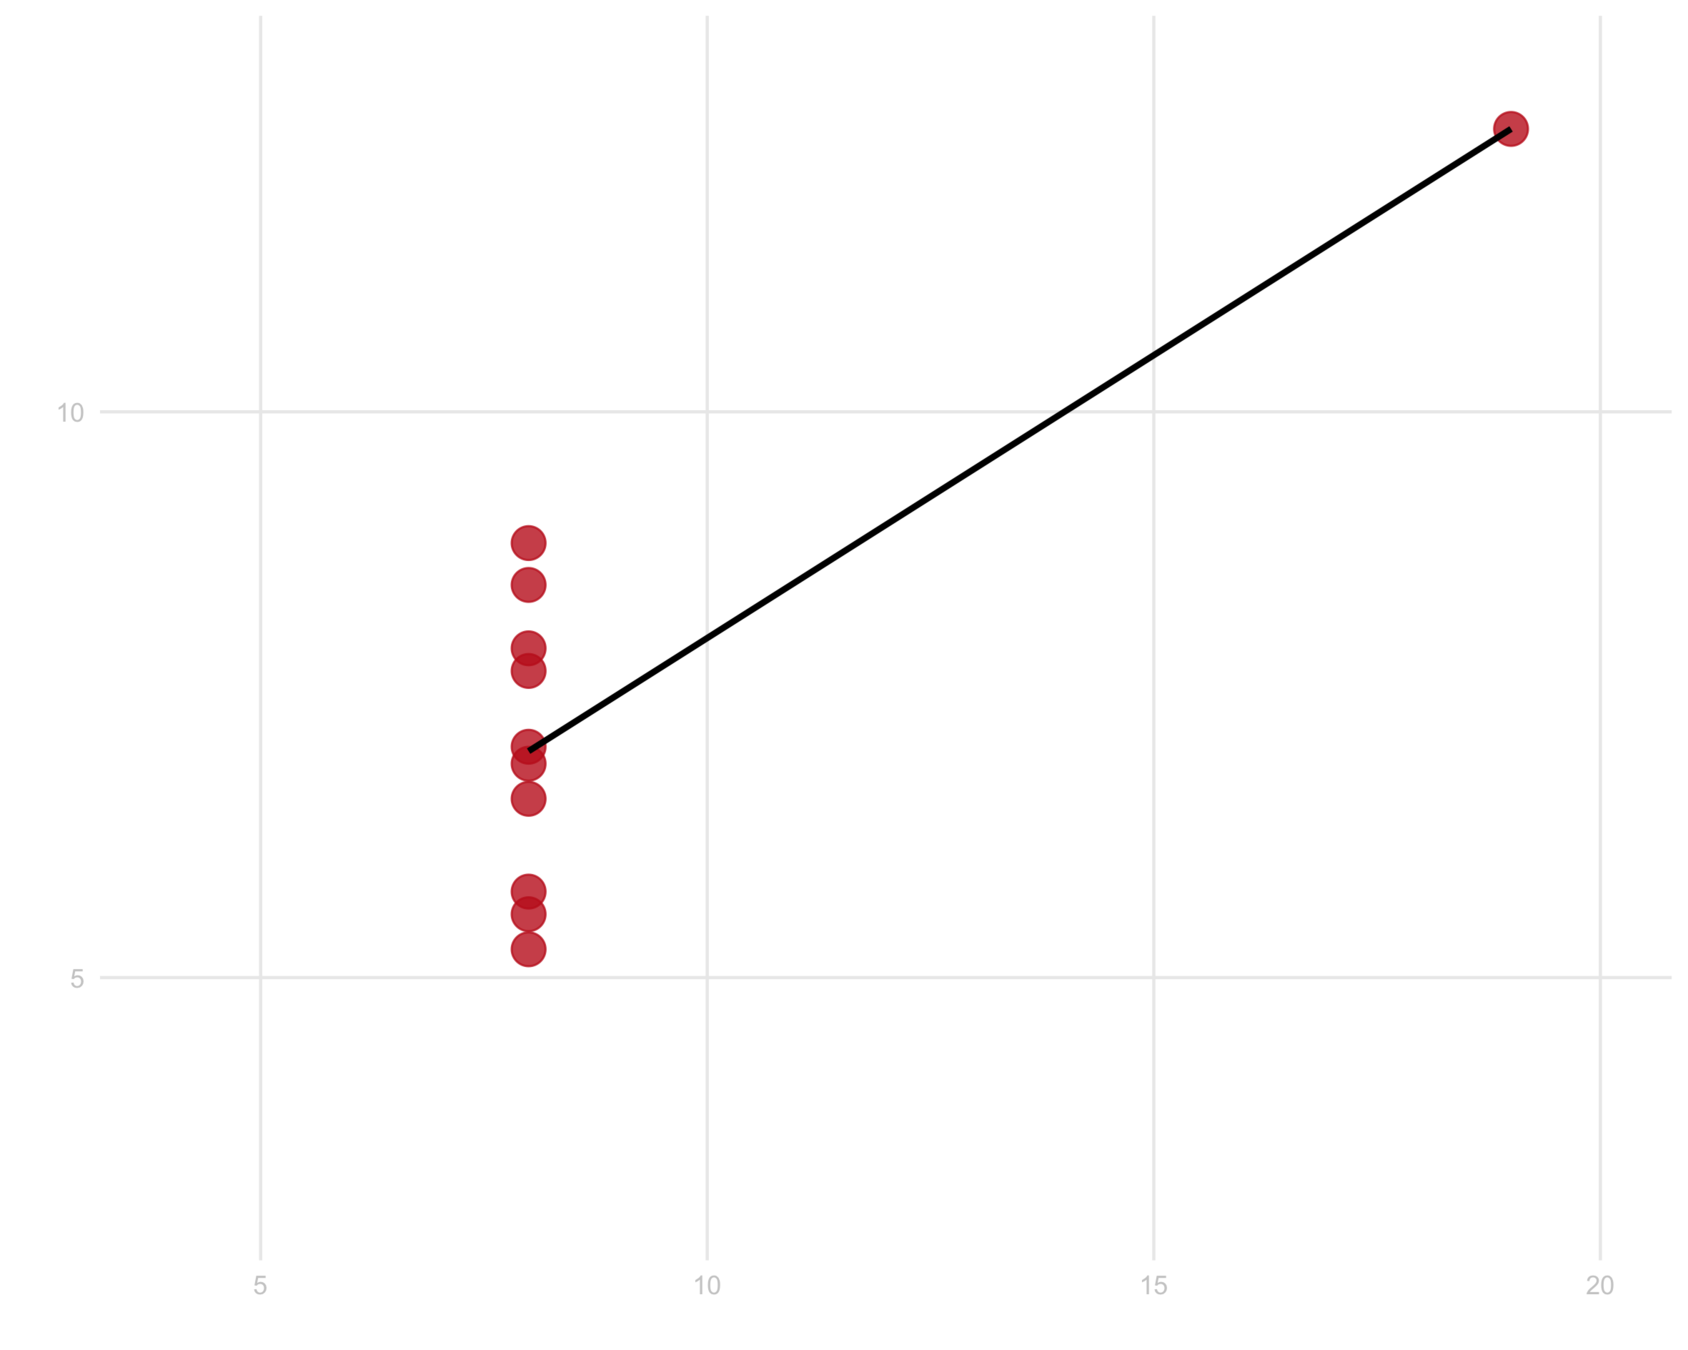
| x1 | y1 | x2 | y2 | x3 | y3 | x4 | y4 |
|---|---|---|---|---|---|---|---|
| 10 | 10 | 10 | 8 | 8.04 | 9.14 | 7.46 | 6.58 |
| 8 | 8 | 8 | 8 | 6.95 | 8.14 | 6.77 | 5.76 |
| 13 | 13 | 13 | 8 | 7.58 | 8.74 | 12.74 | 7.71 |
| 9 | 9 | 9 | 8 | 8.81 | 8.77 | 7.11 | 8.84 |
| 11 | 11 | 11 | 8 | 8.33 | 9.26 | 7.81 | 8.47 |
| 14 | 14 | 14 | 8 | 9.96 | 8.10 | 8.84 | 7.04 |
| 6 | 6 | 6 | 8 | 7.24 | 6.13 | 6.08 | 5.25 |
| 4 | 4 | 4 | 19 | 4.26 | 3.10 | 5.39 | 12.50 |
| 12 | 12 | 12 | 8 | 10.84 | 9.13 | 8.15 | 5.56 |
| 7 | 7 | 7 | 8 | 4.82 | 7.26 | 6.42 | 7.91 |
| 5 | 5 | 5 | 8 | 5.68 | 4.74 | 5.73 | 6.89 |
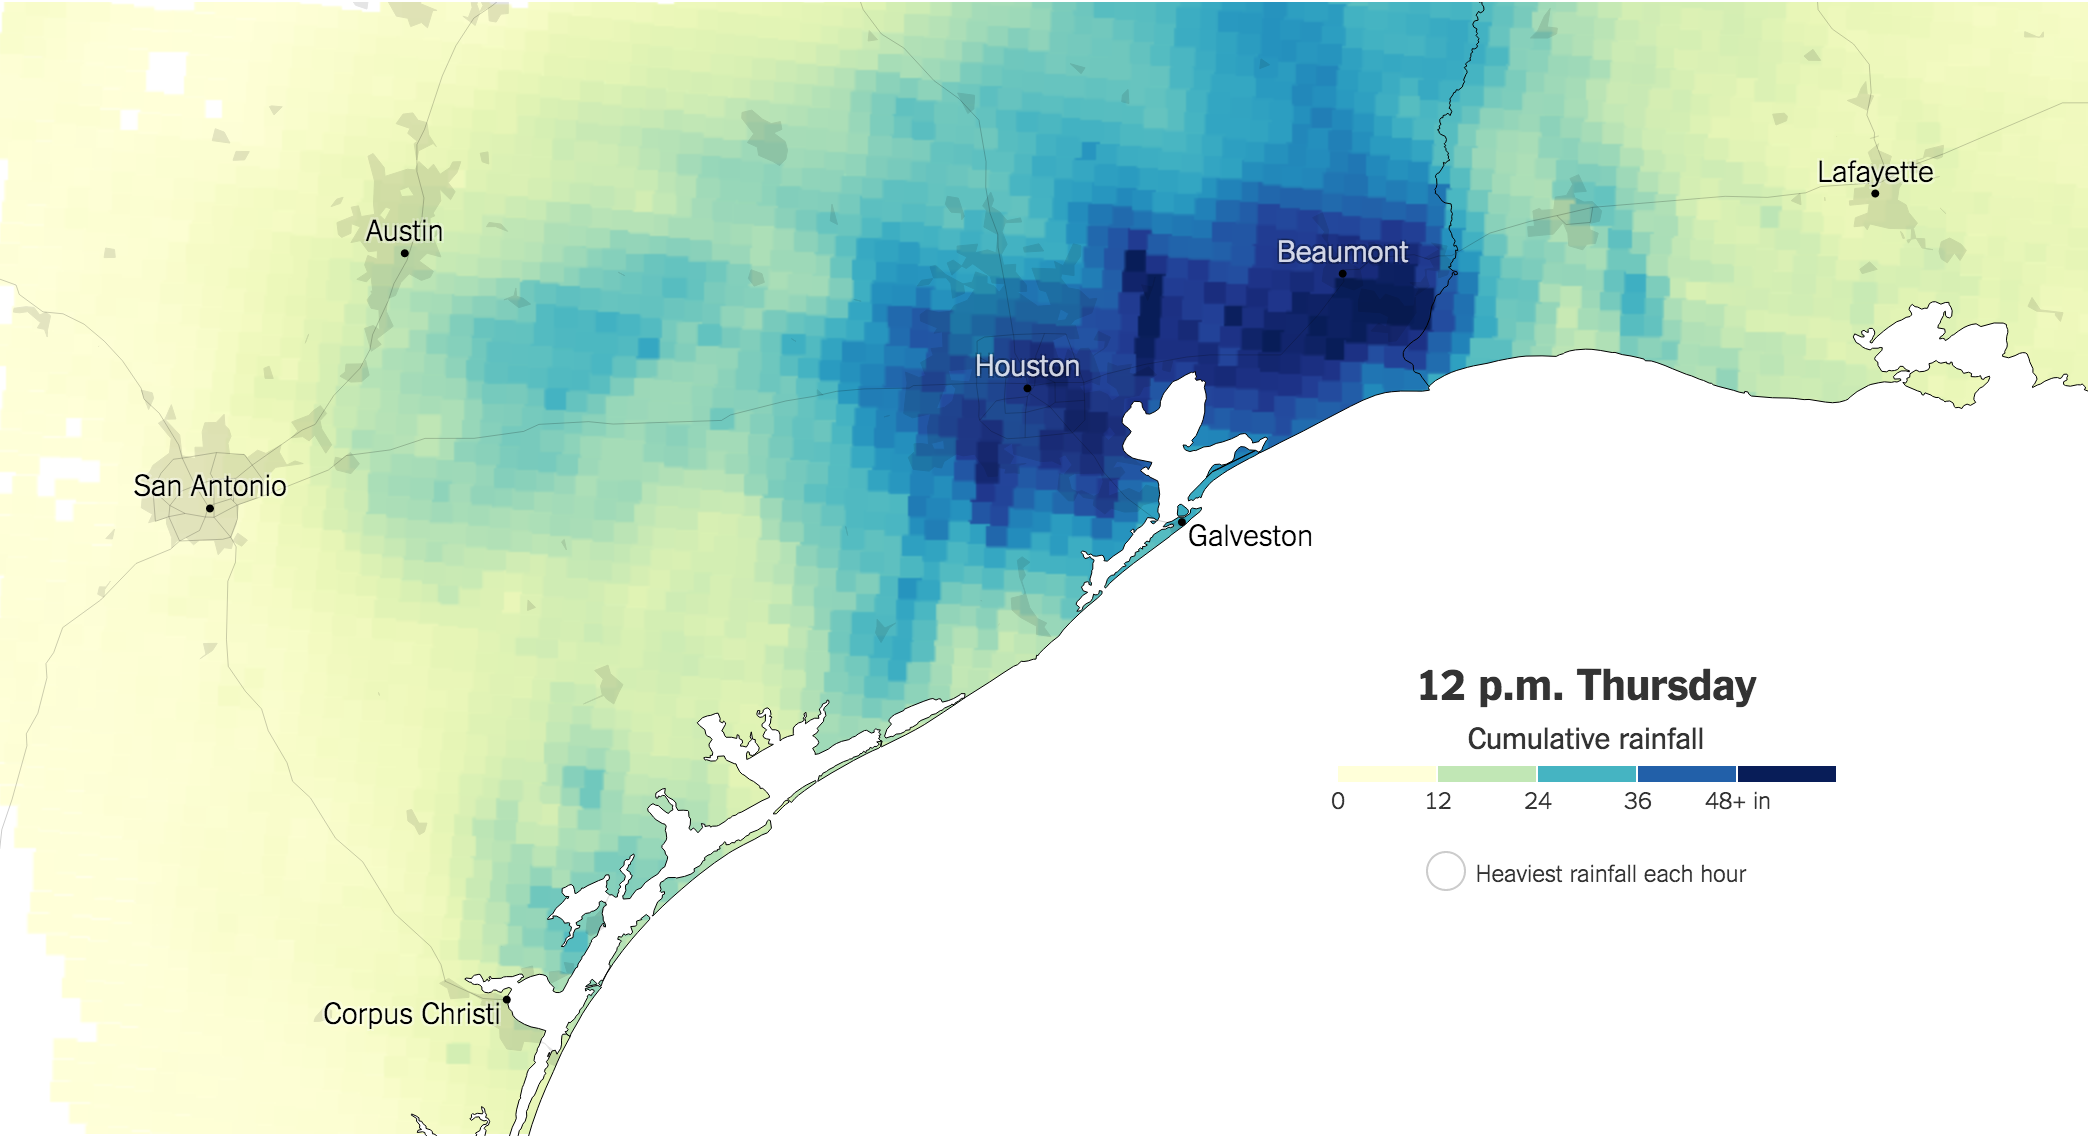
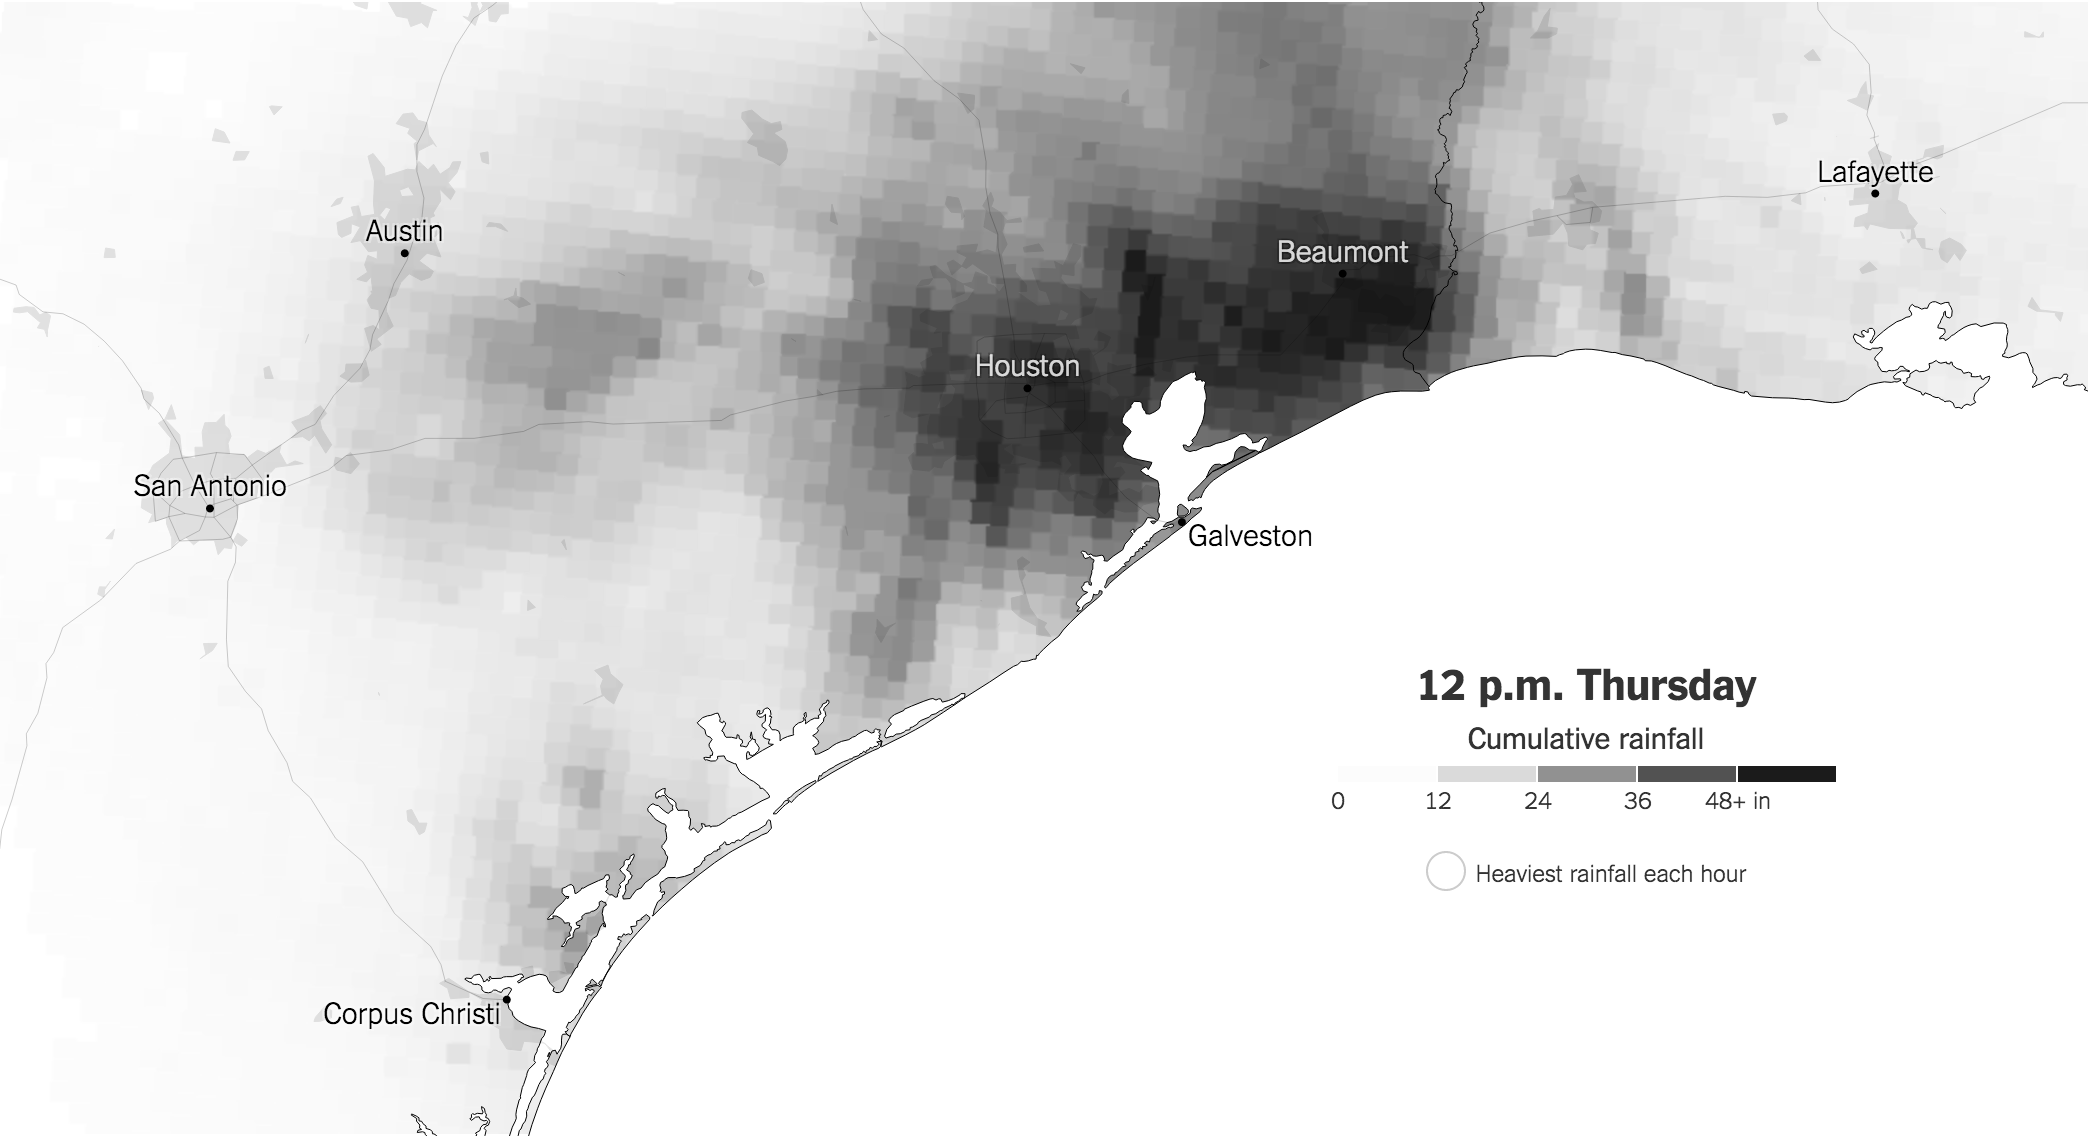
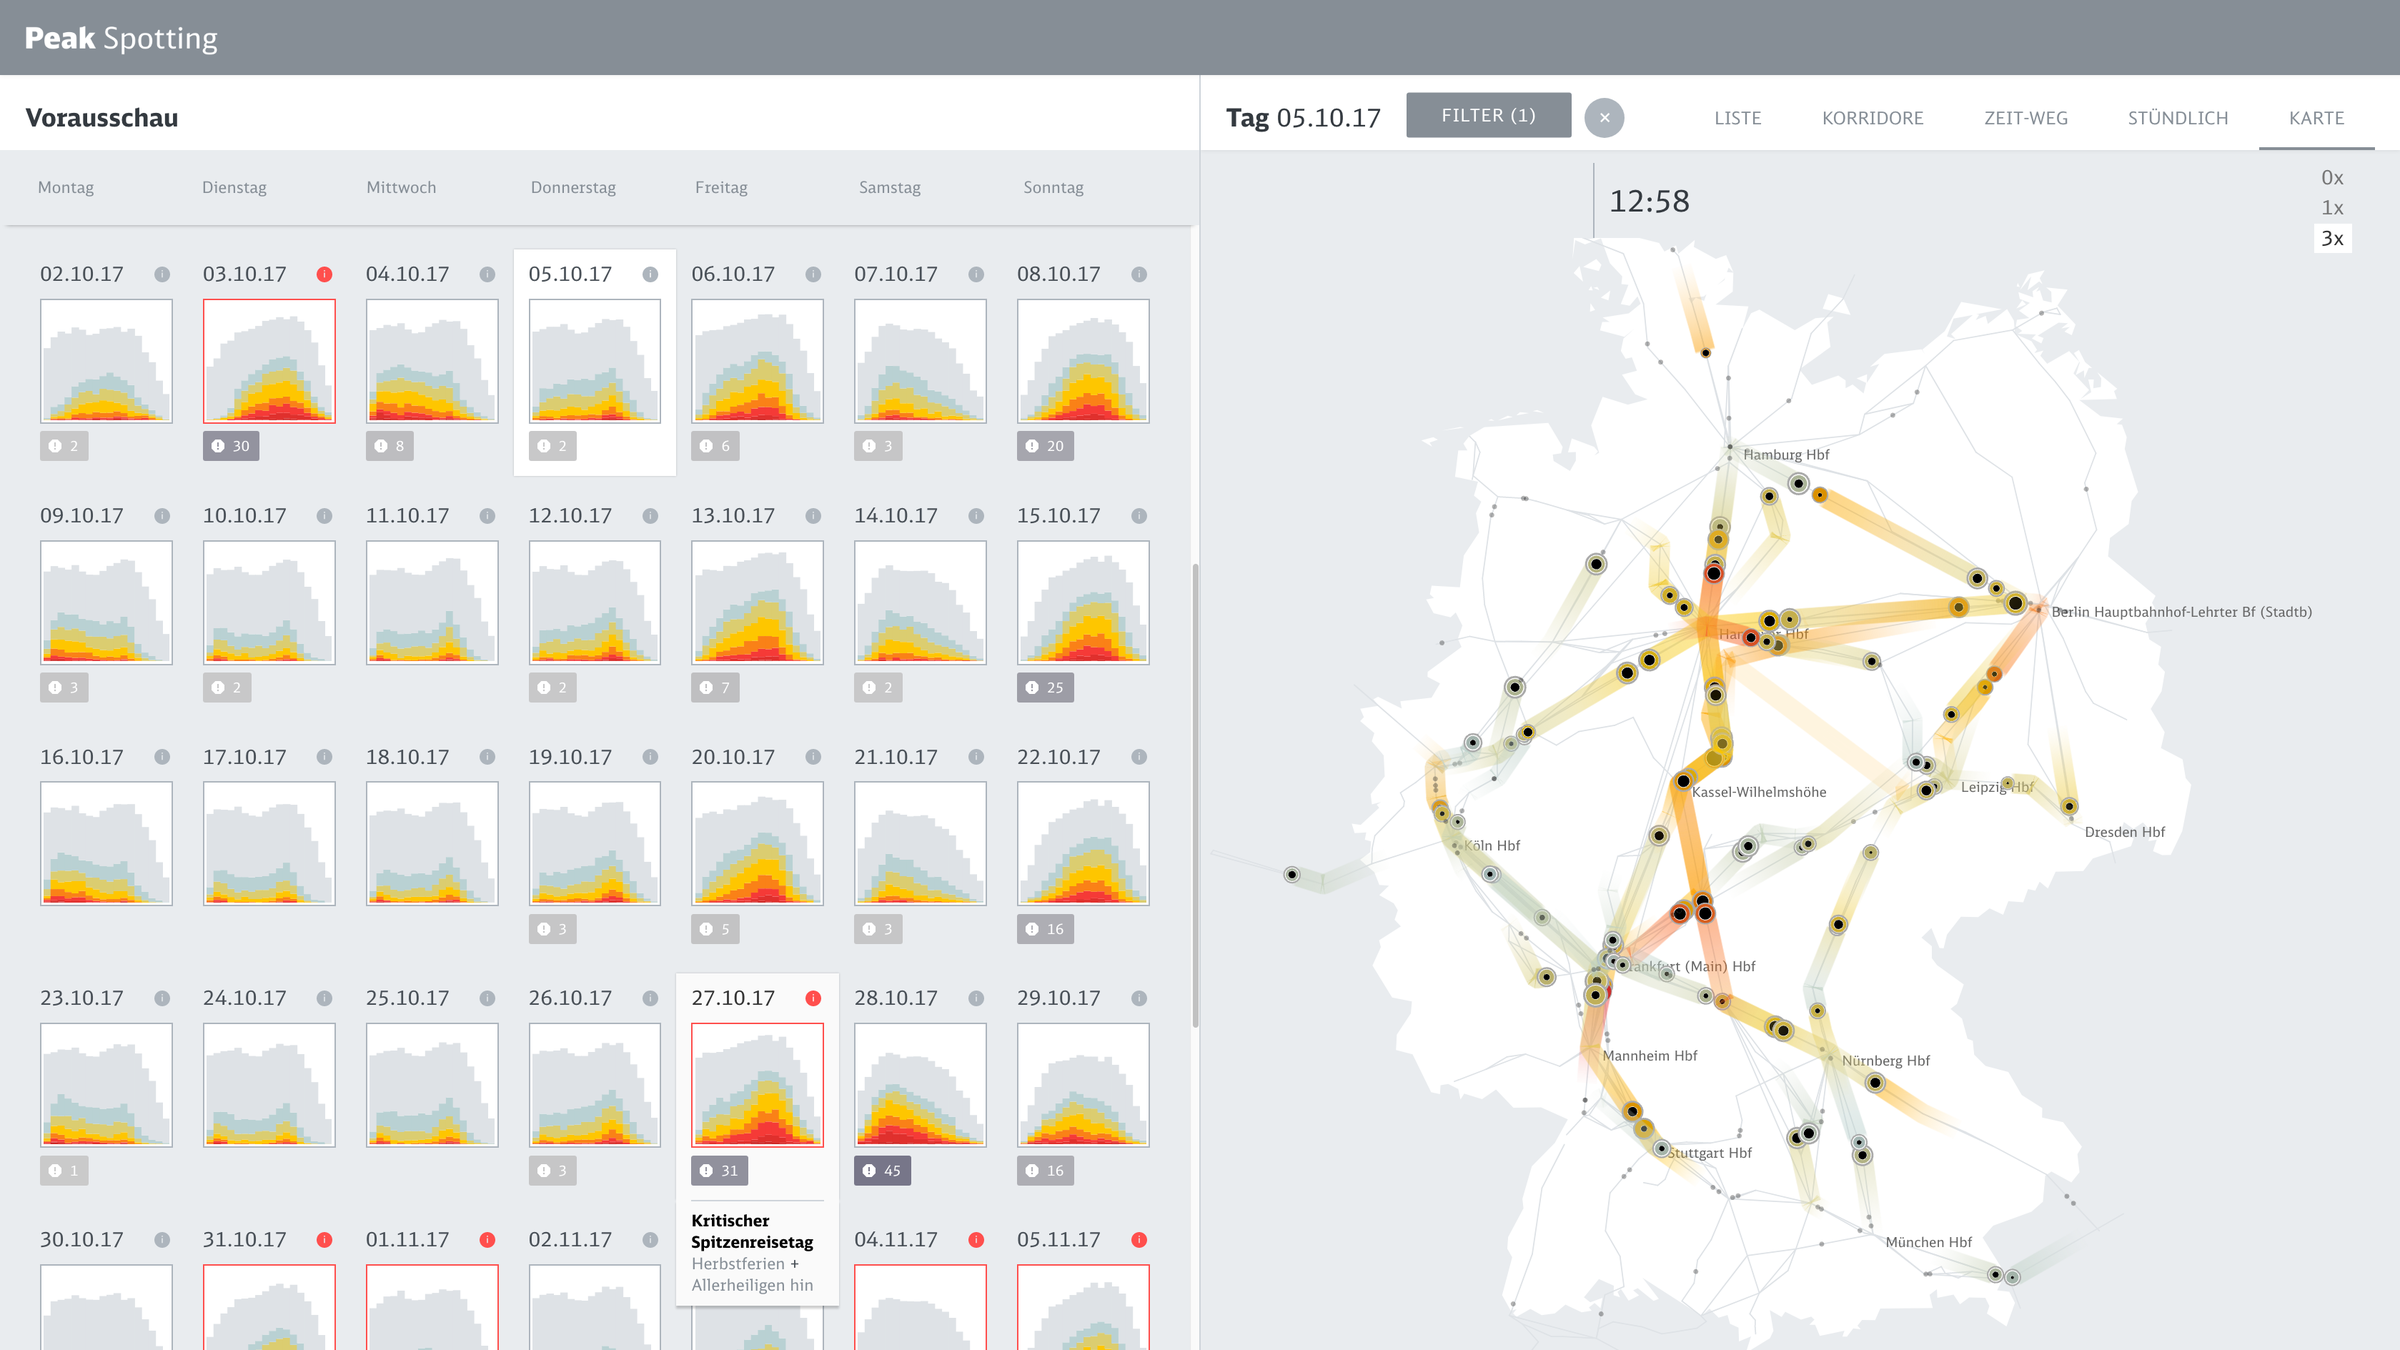
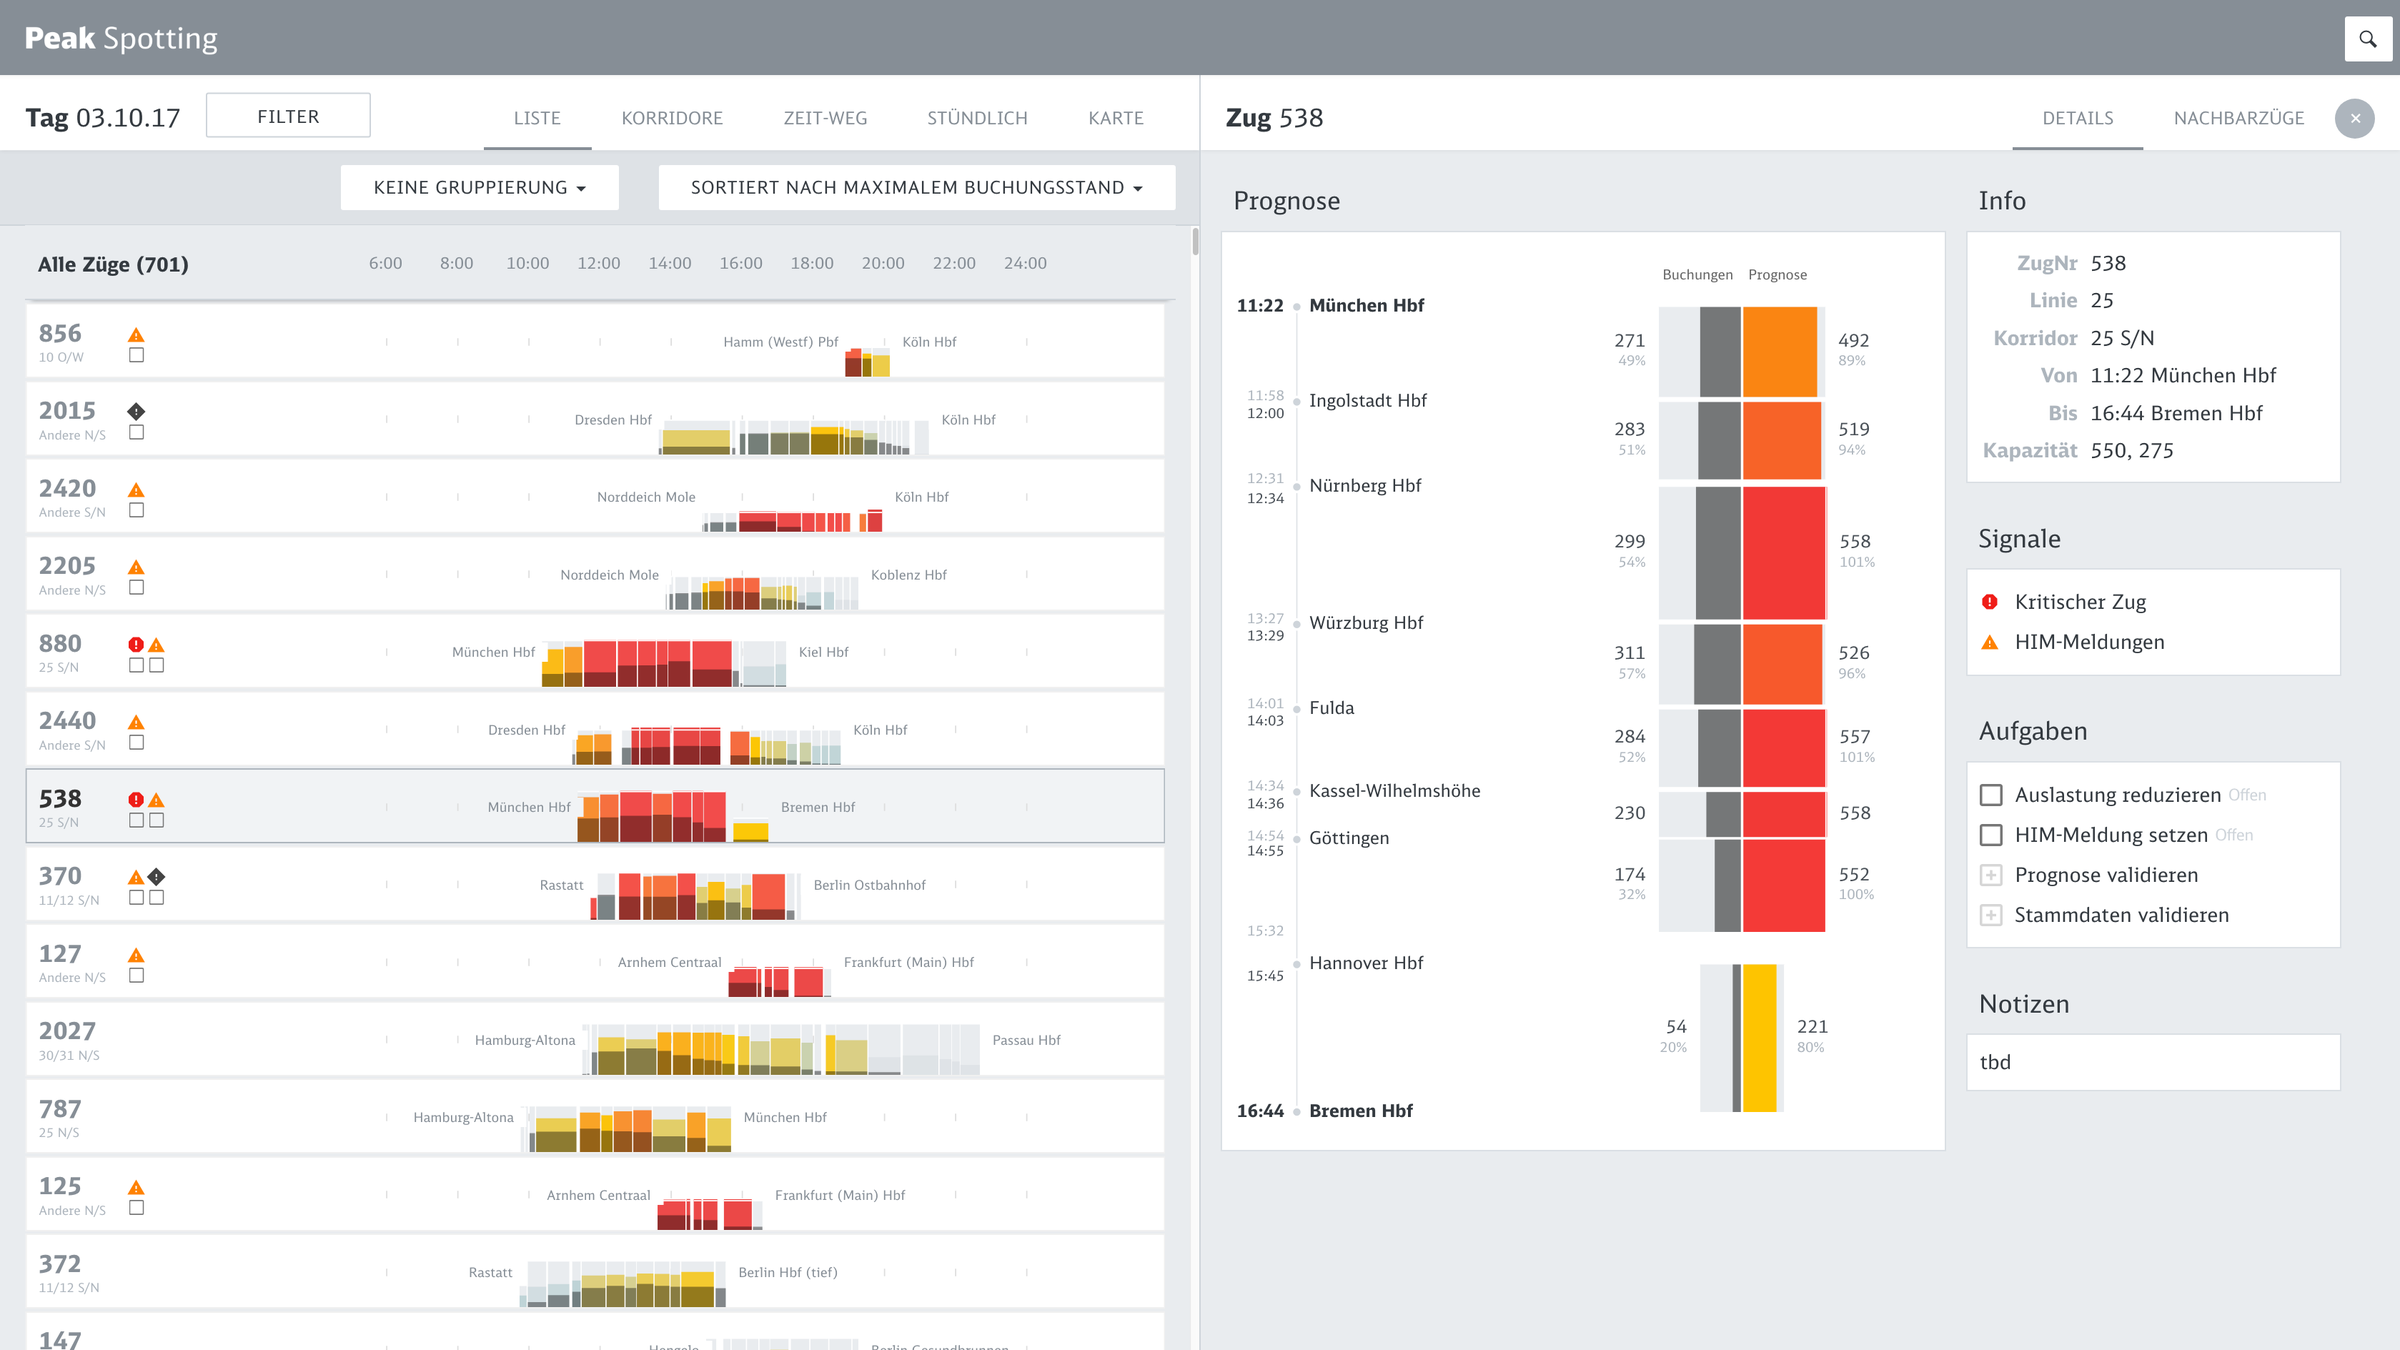
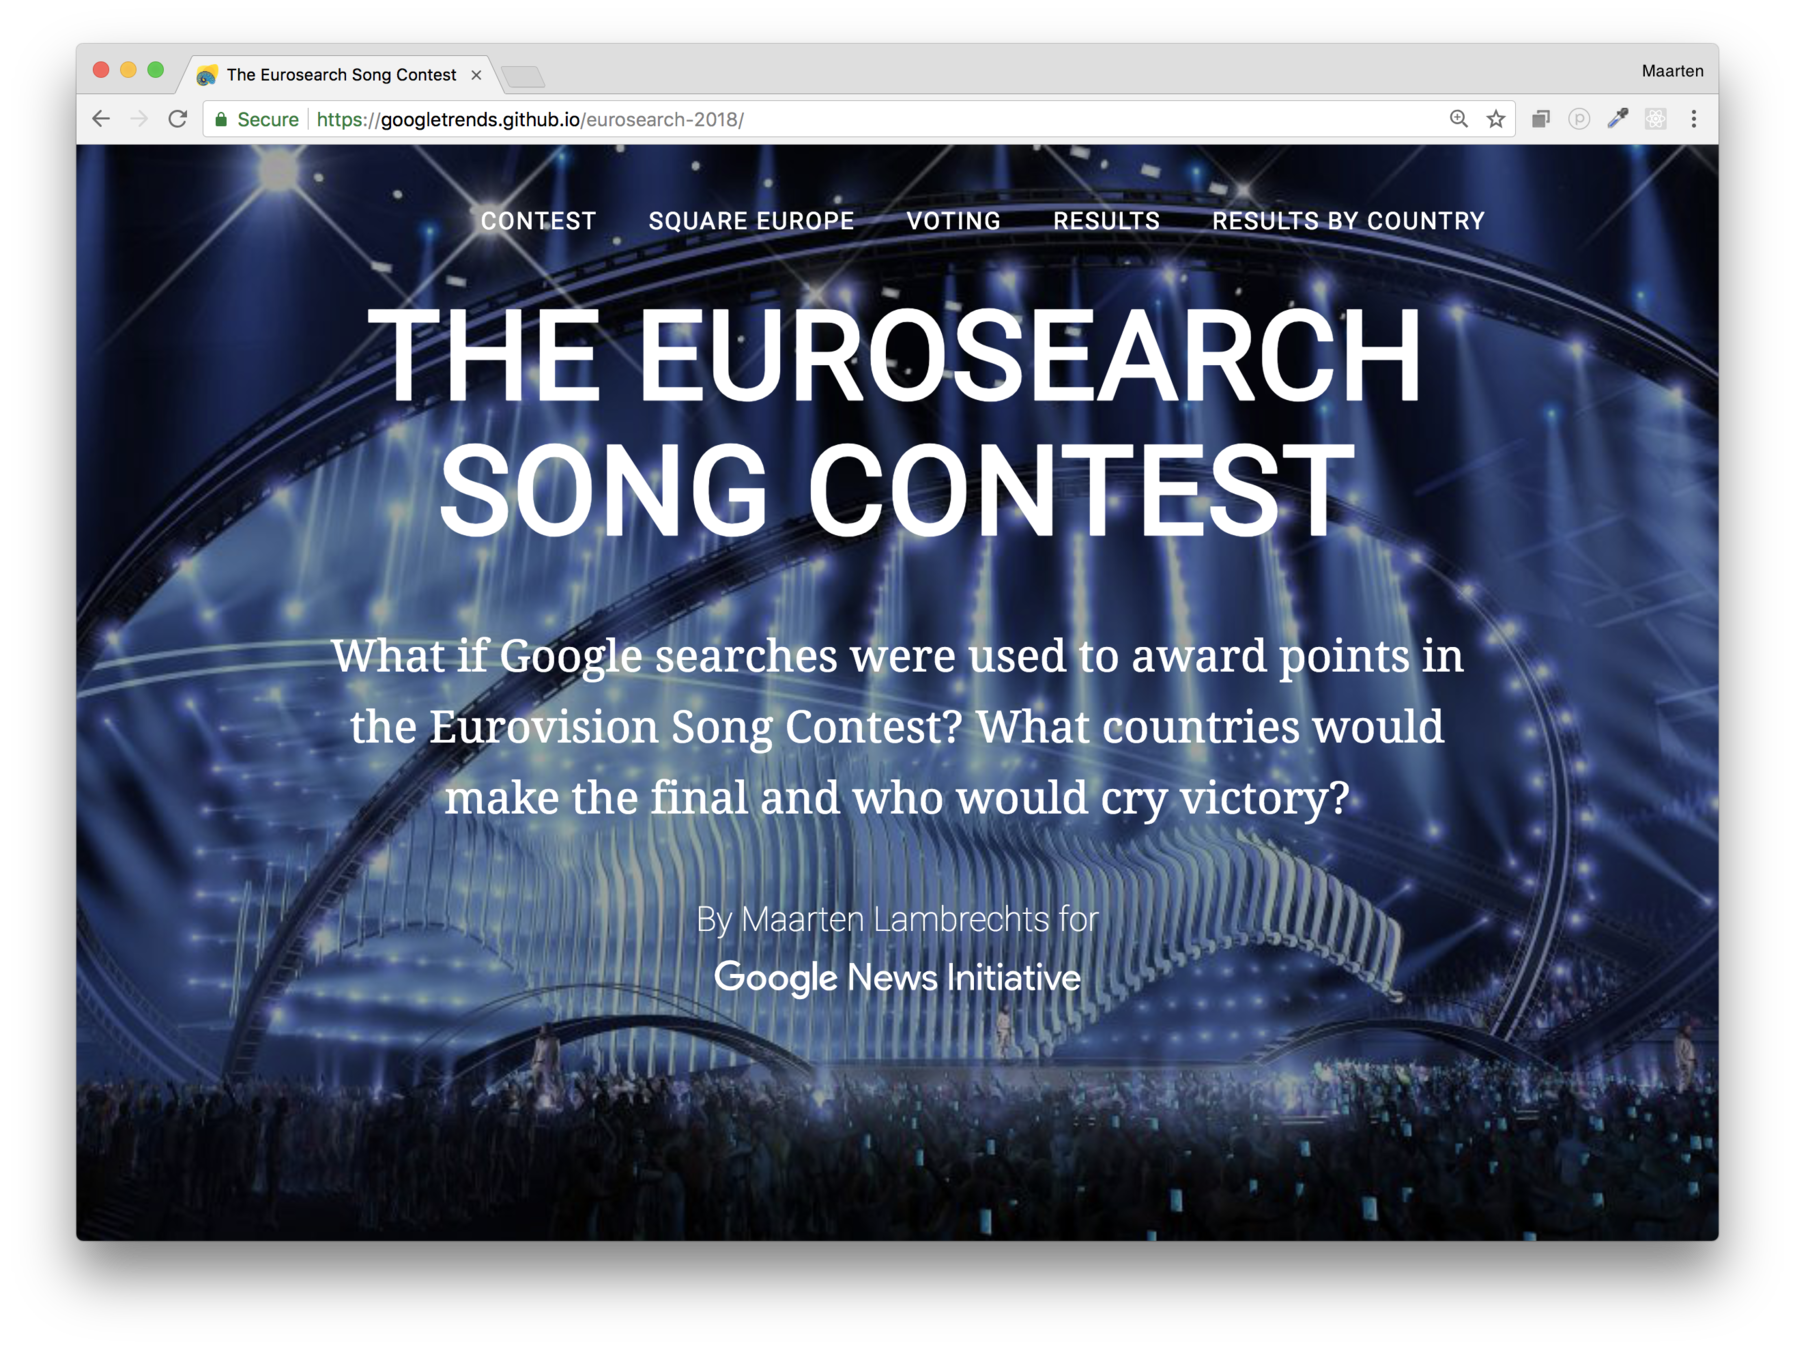
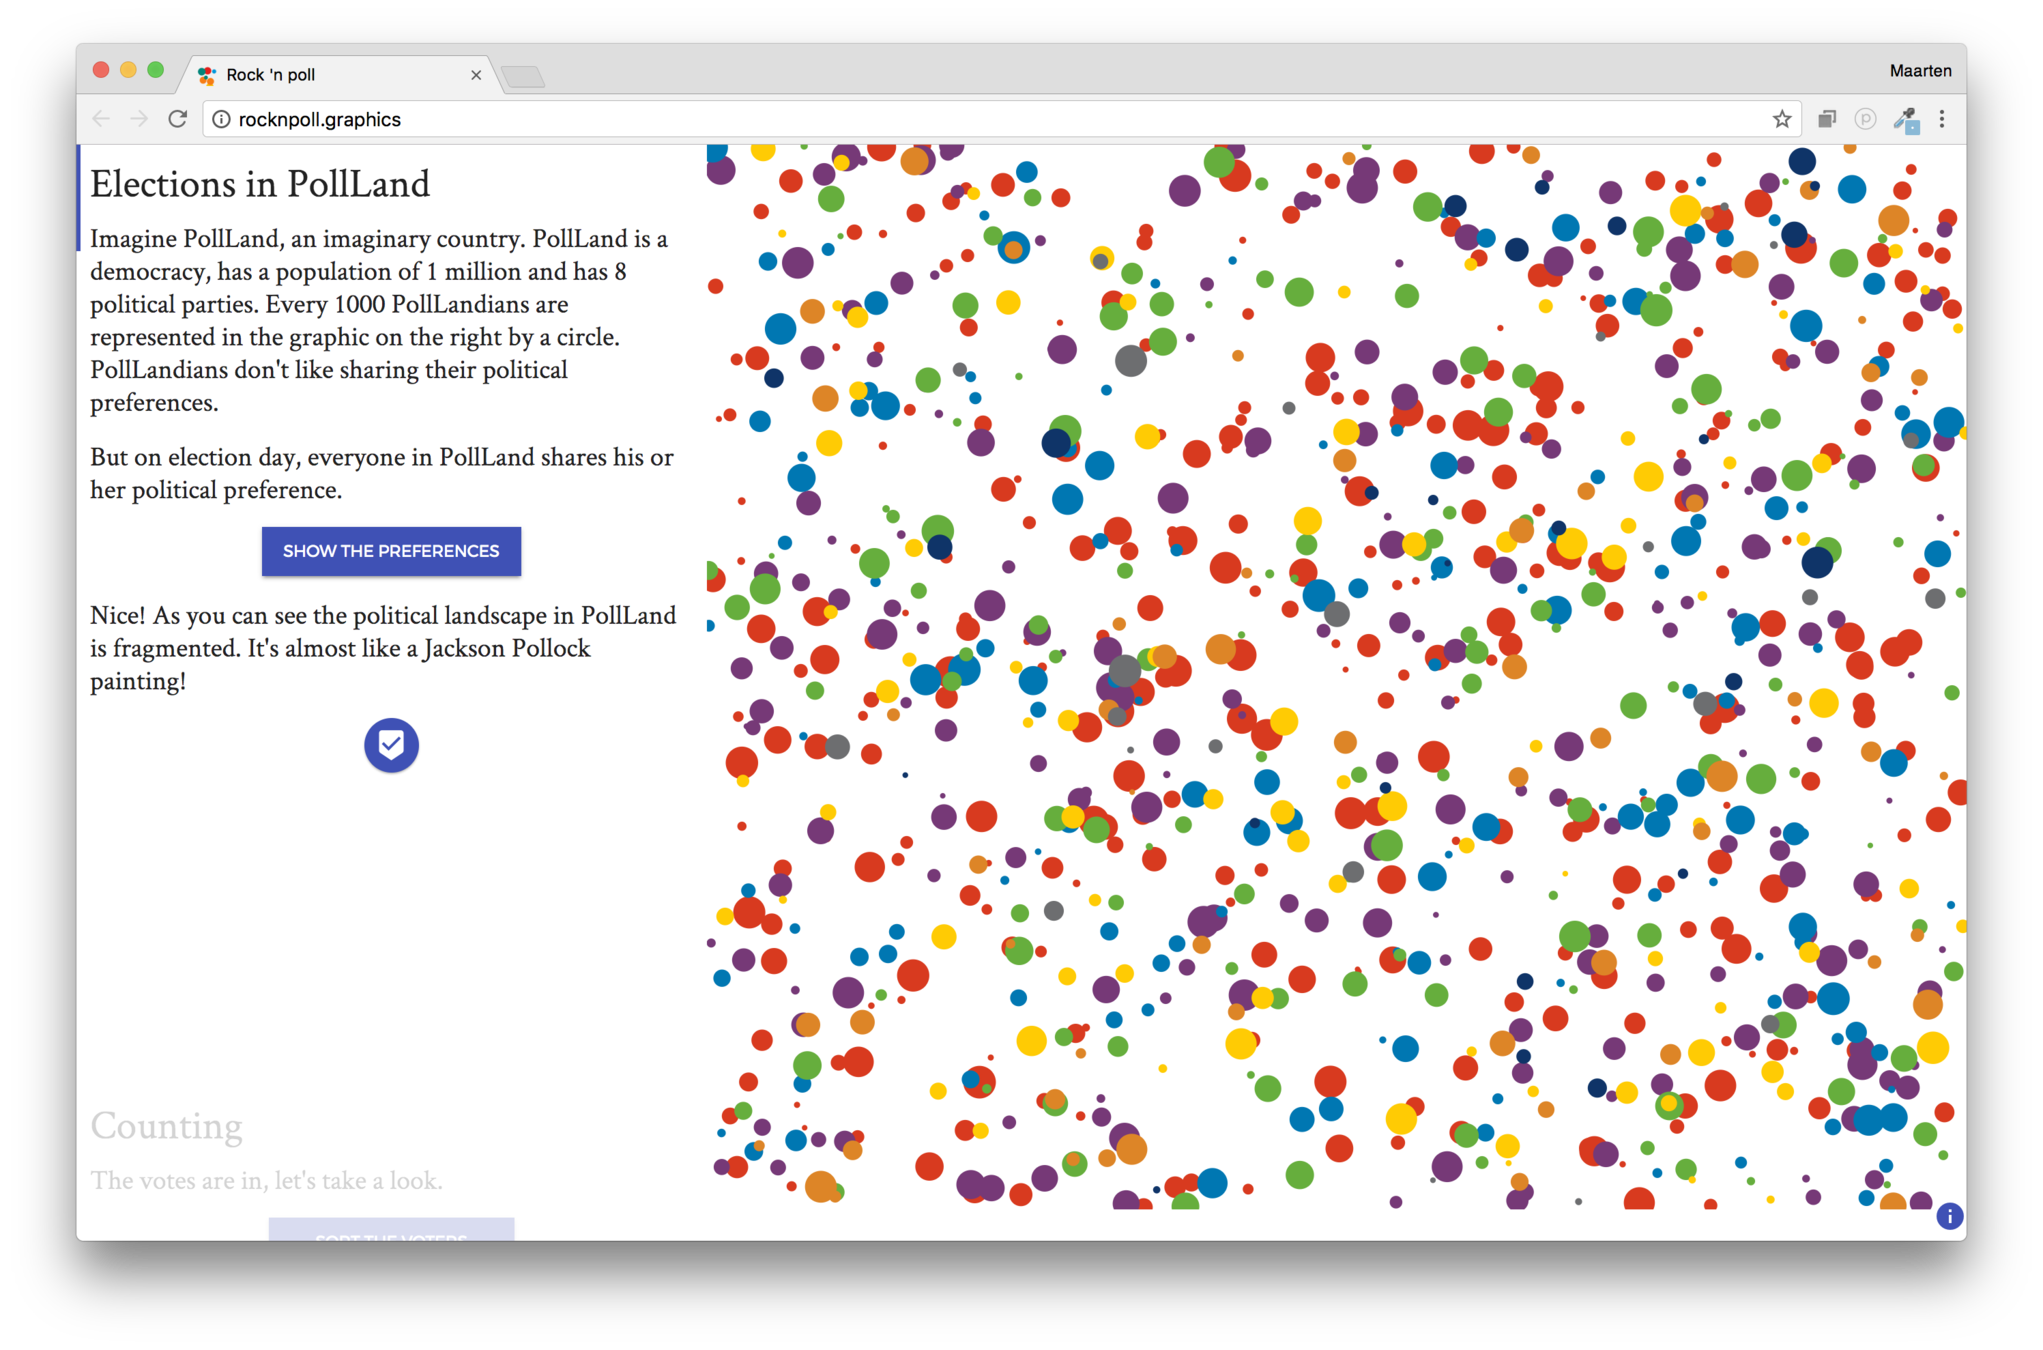
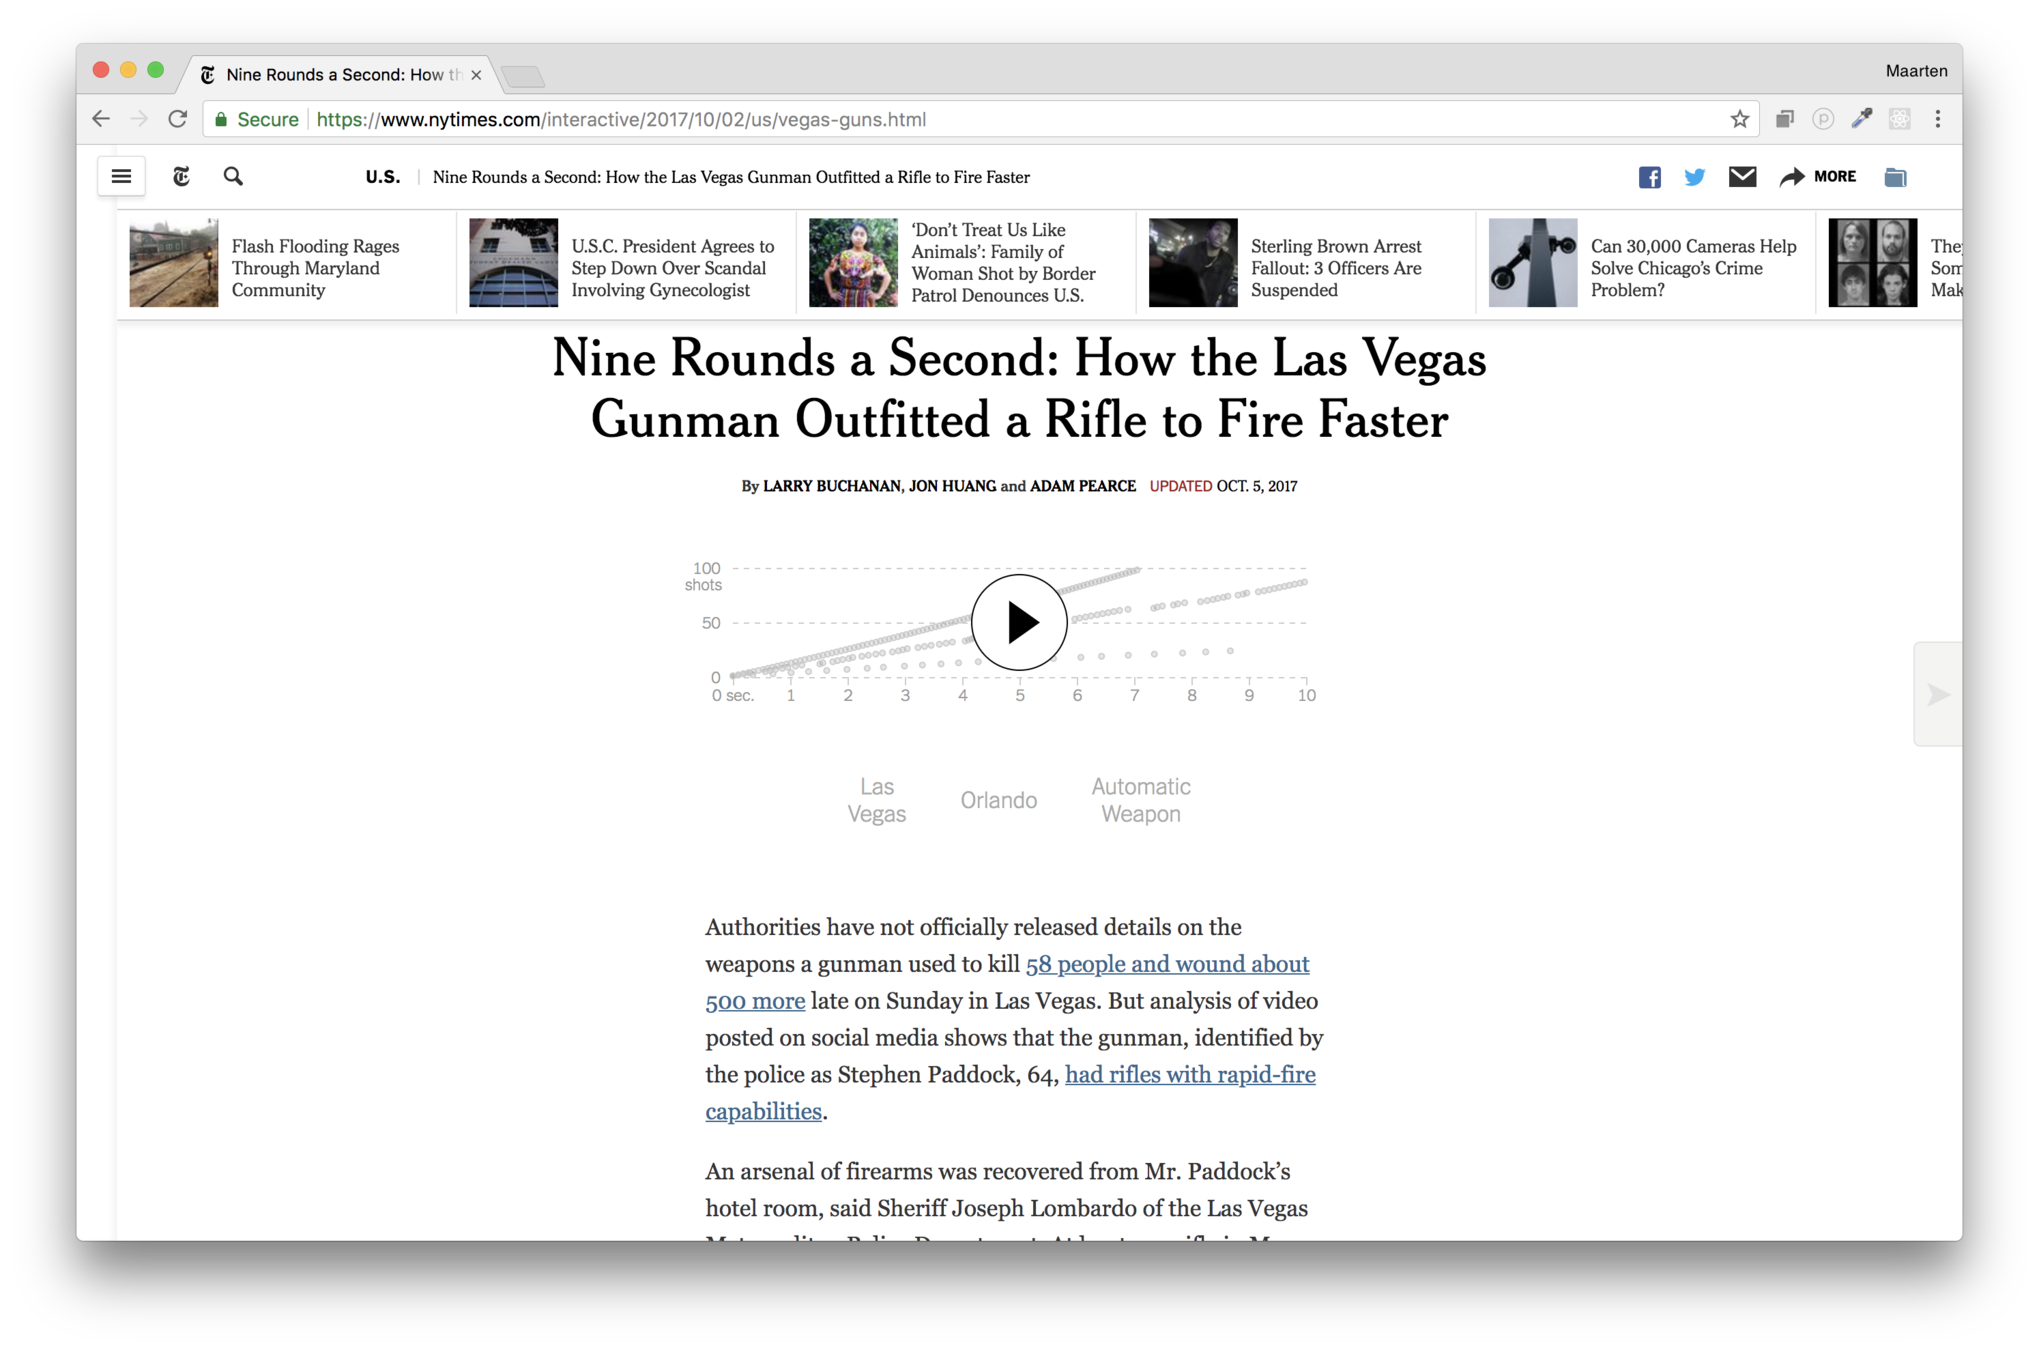
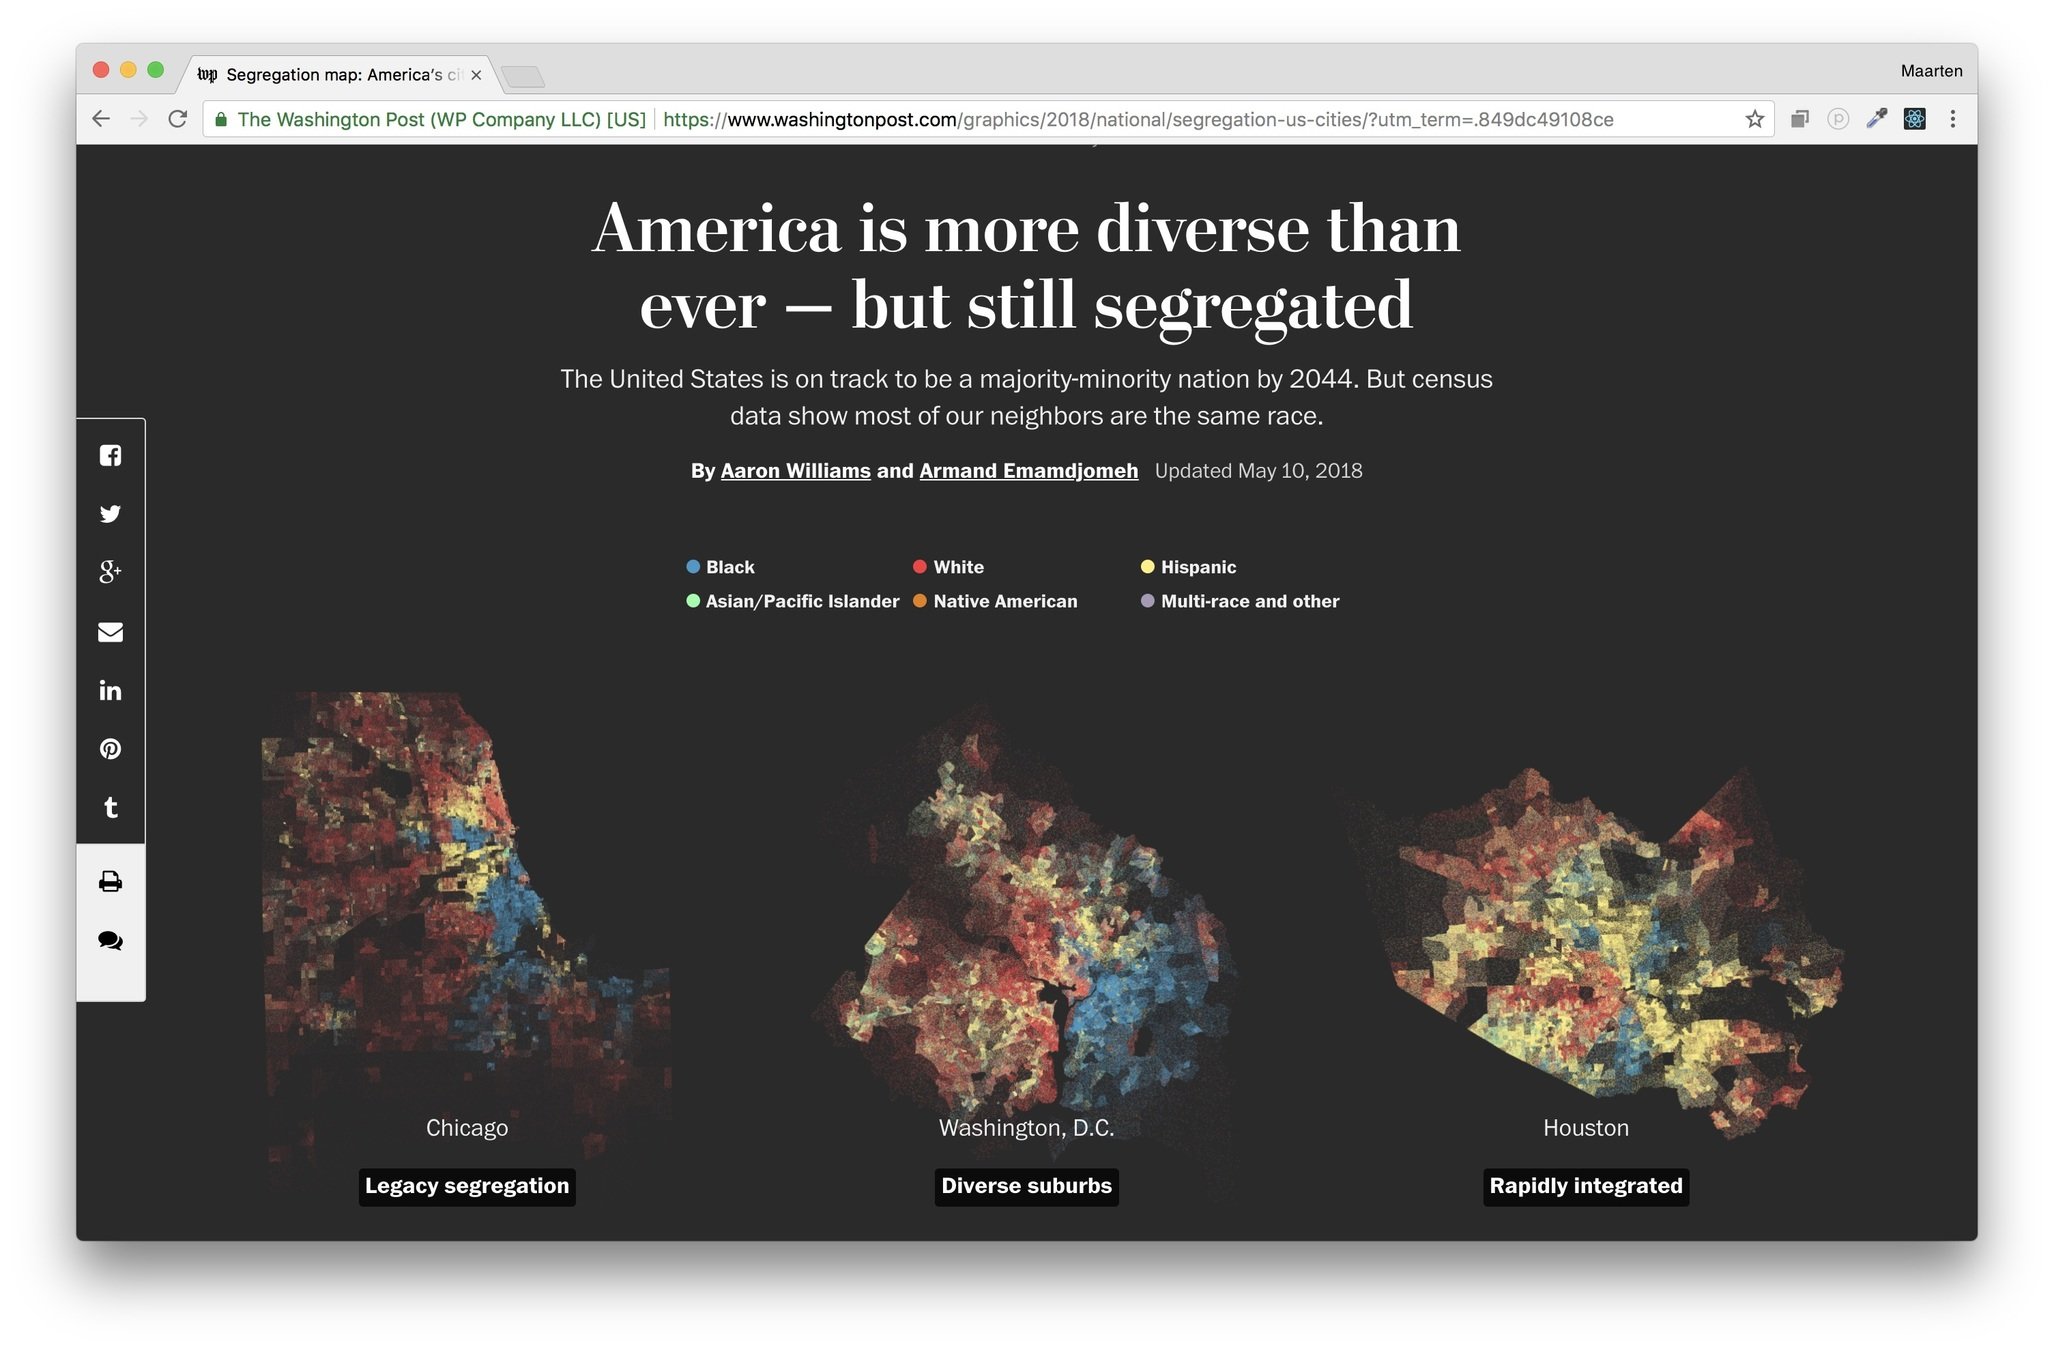
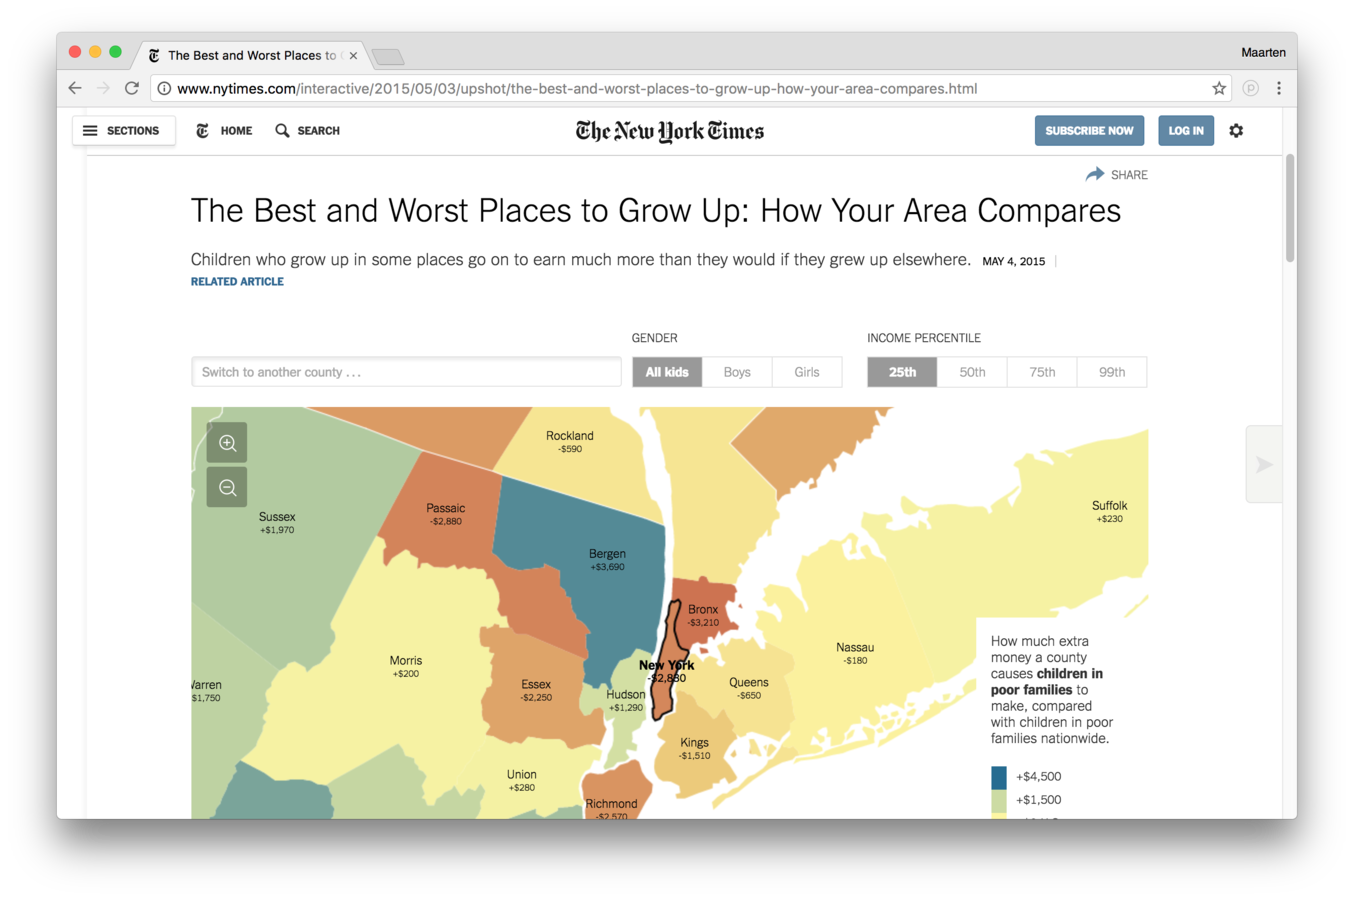
Data visualisation is an efficient human-data interface
But this interface needs to be designed


Reducing the interface friction

The right chart type


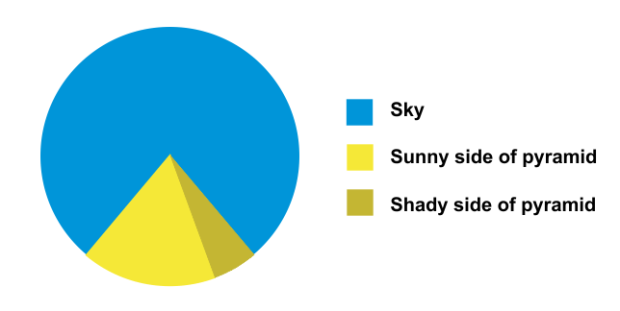

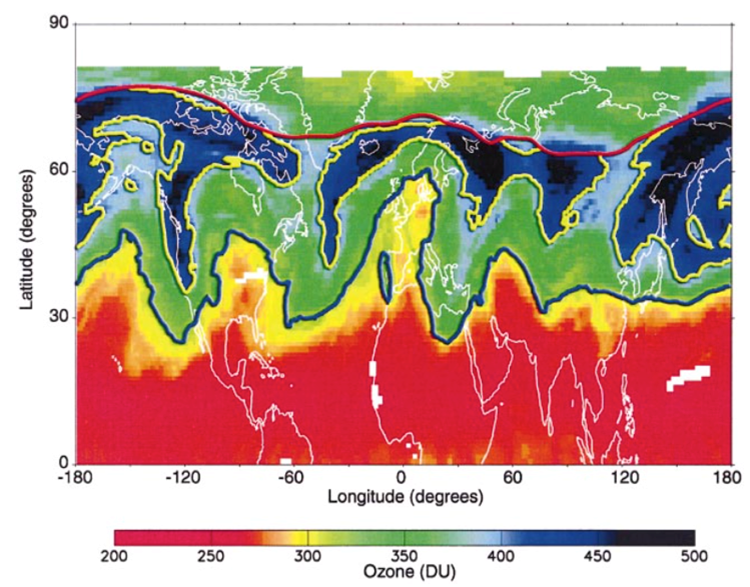
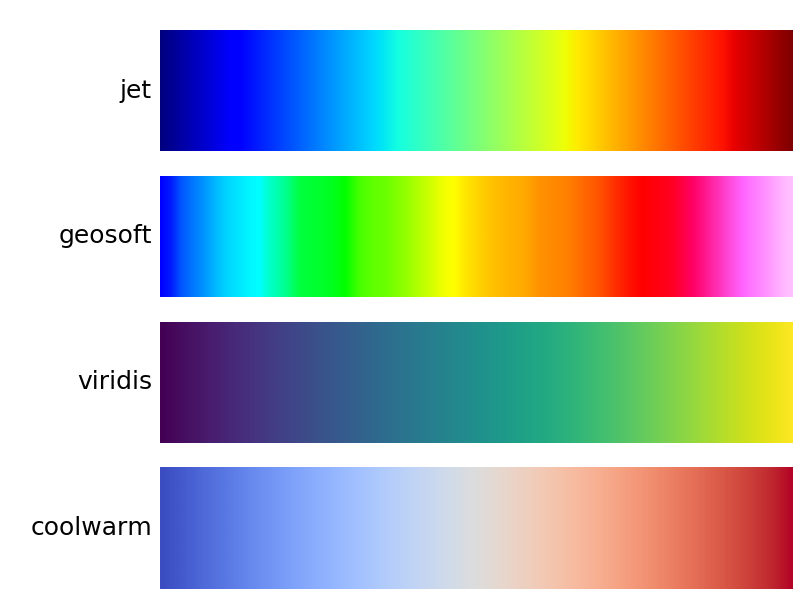
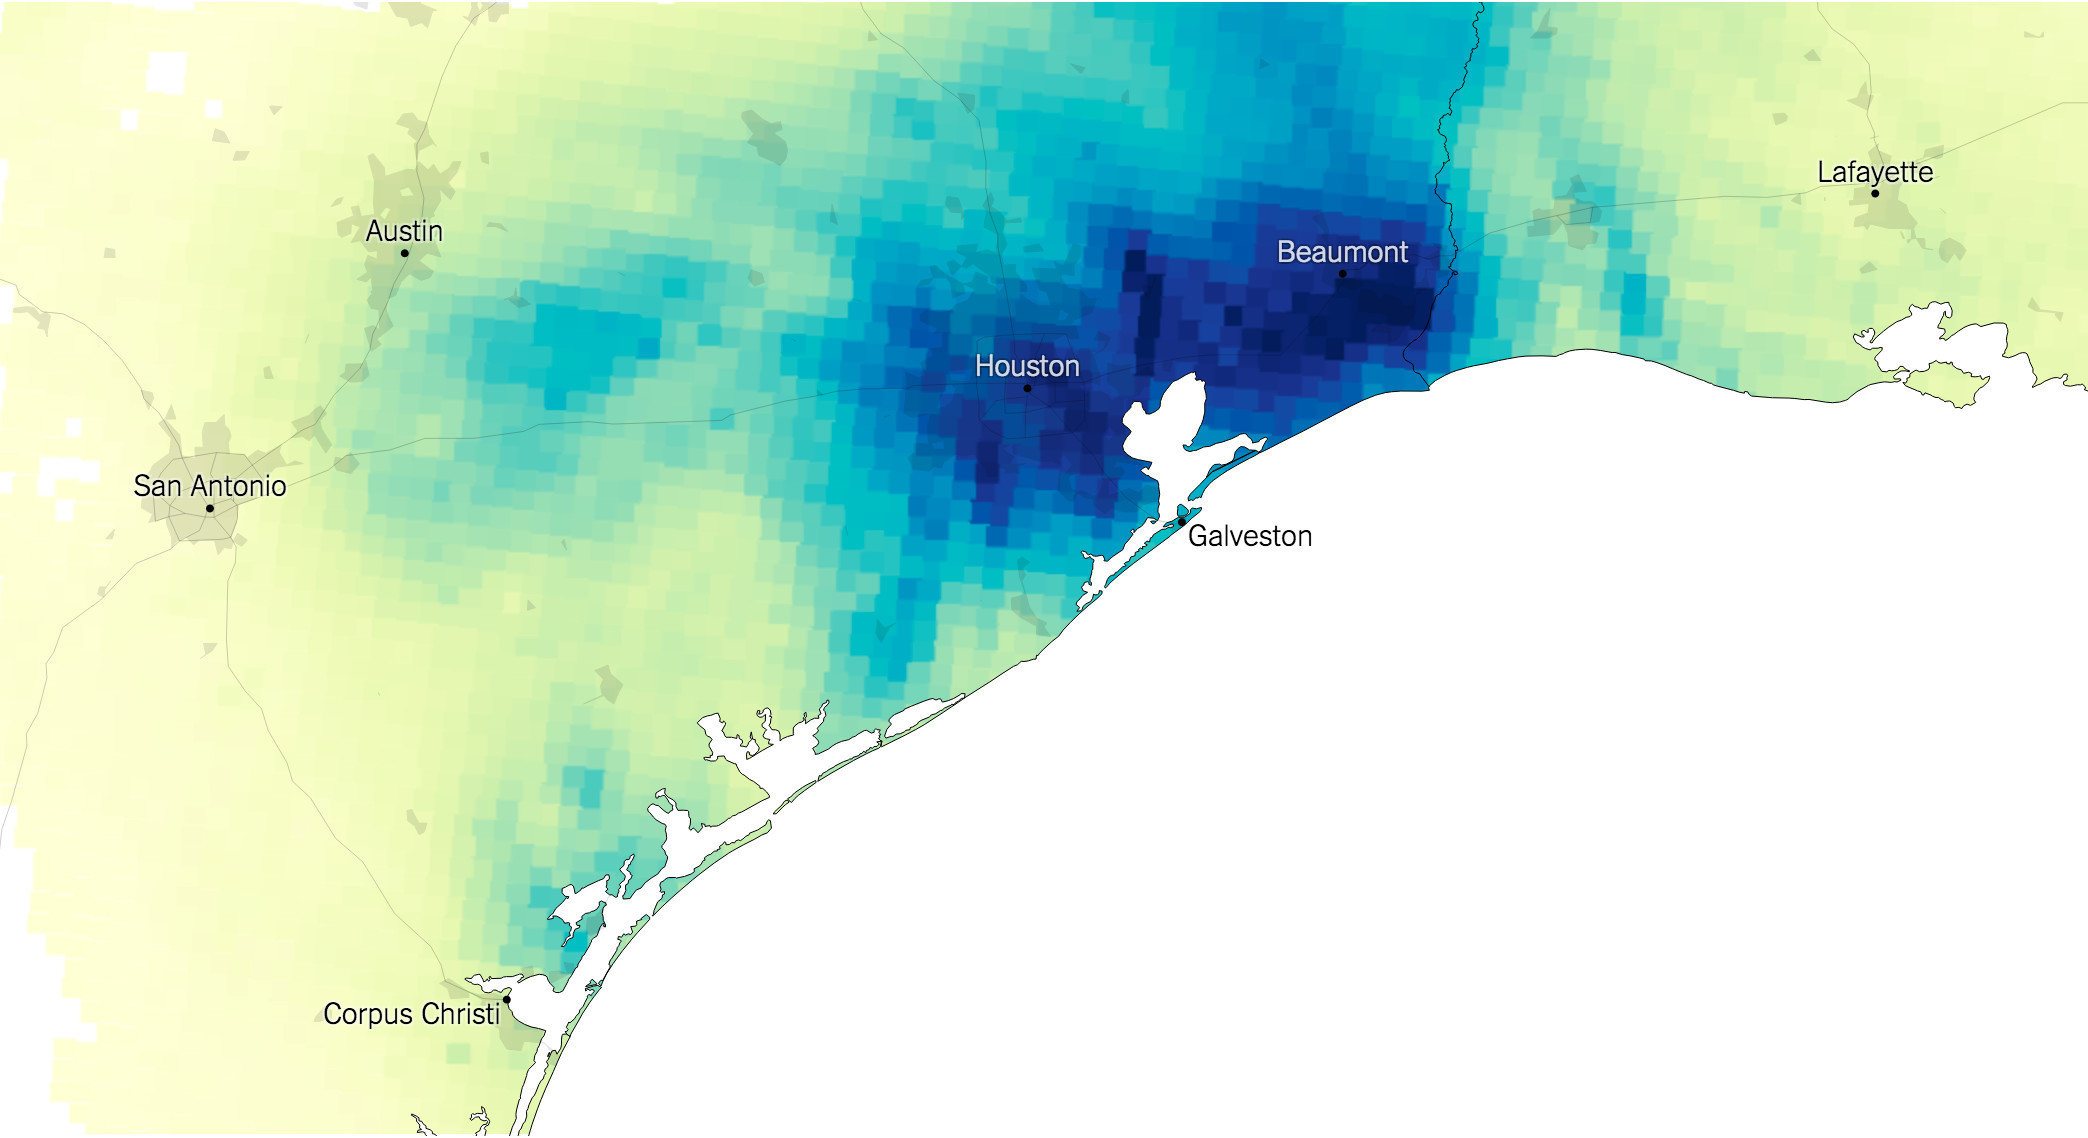
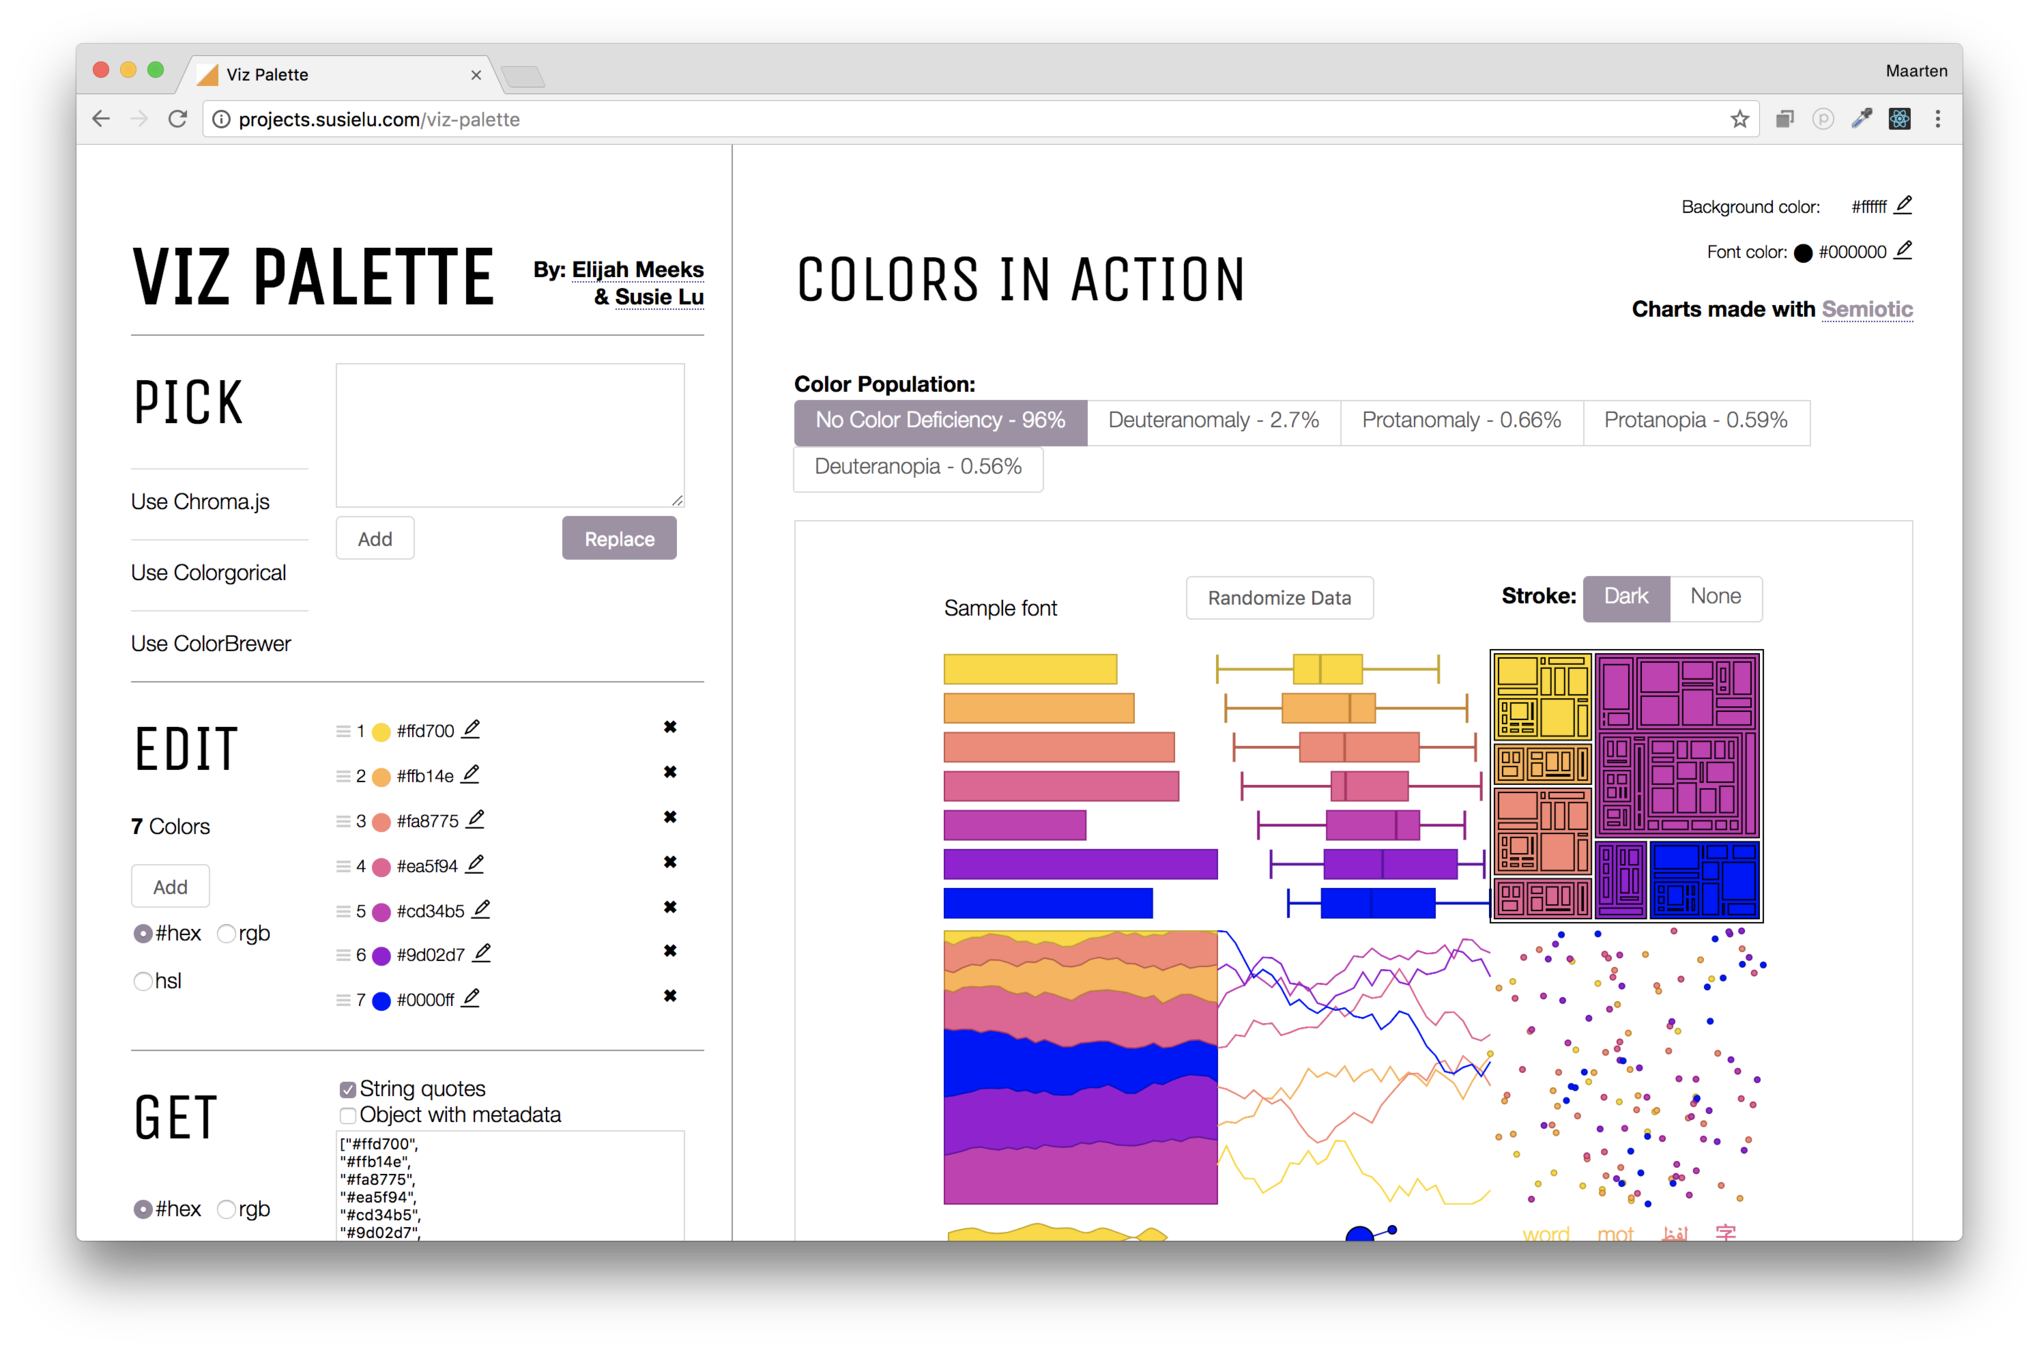
Color
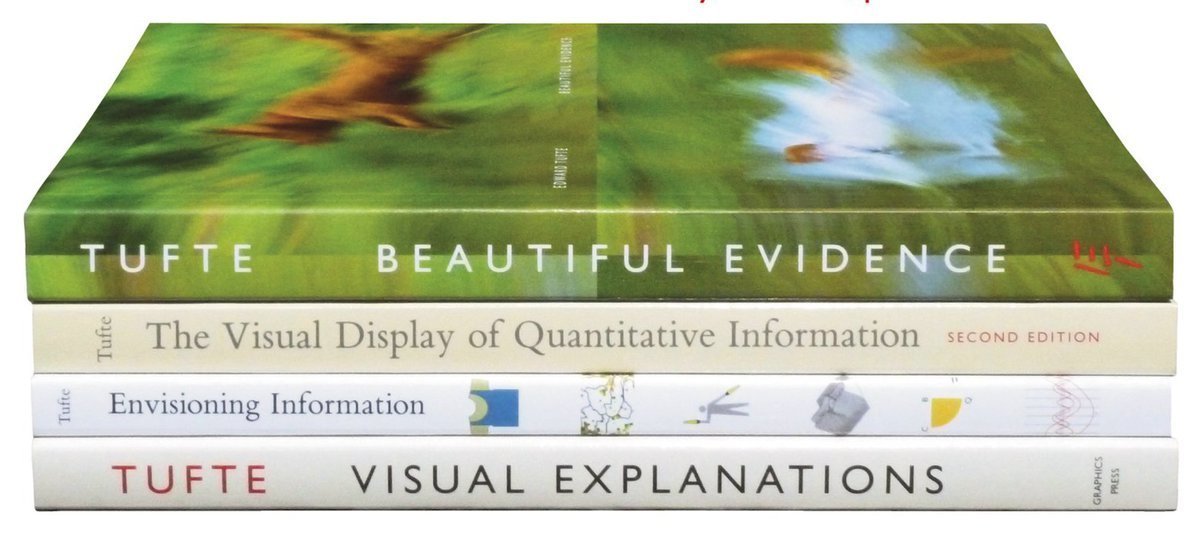
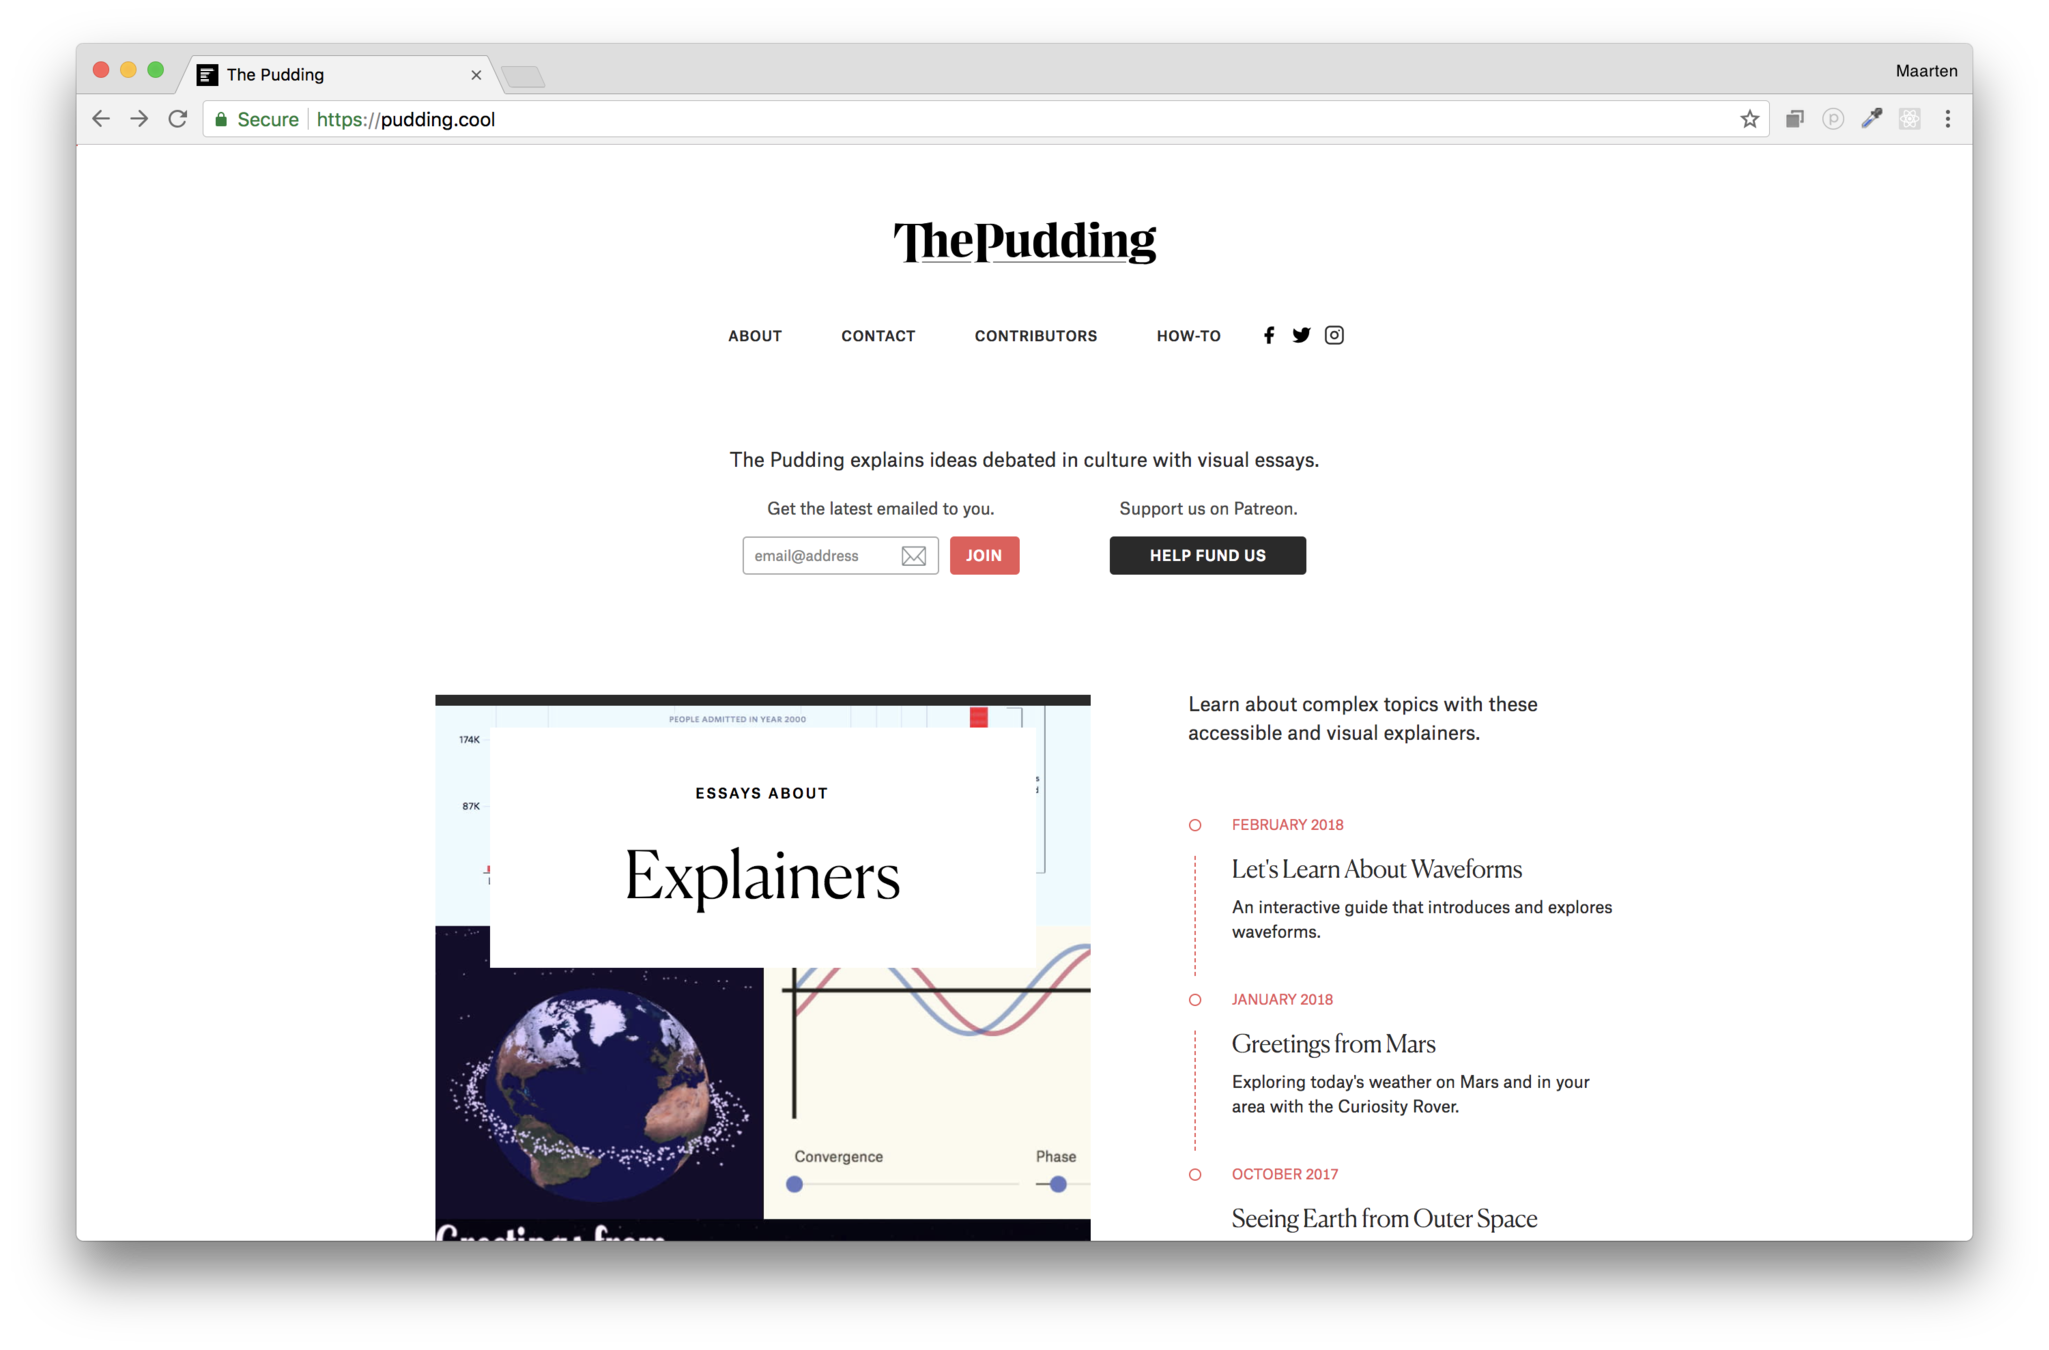
Resources
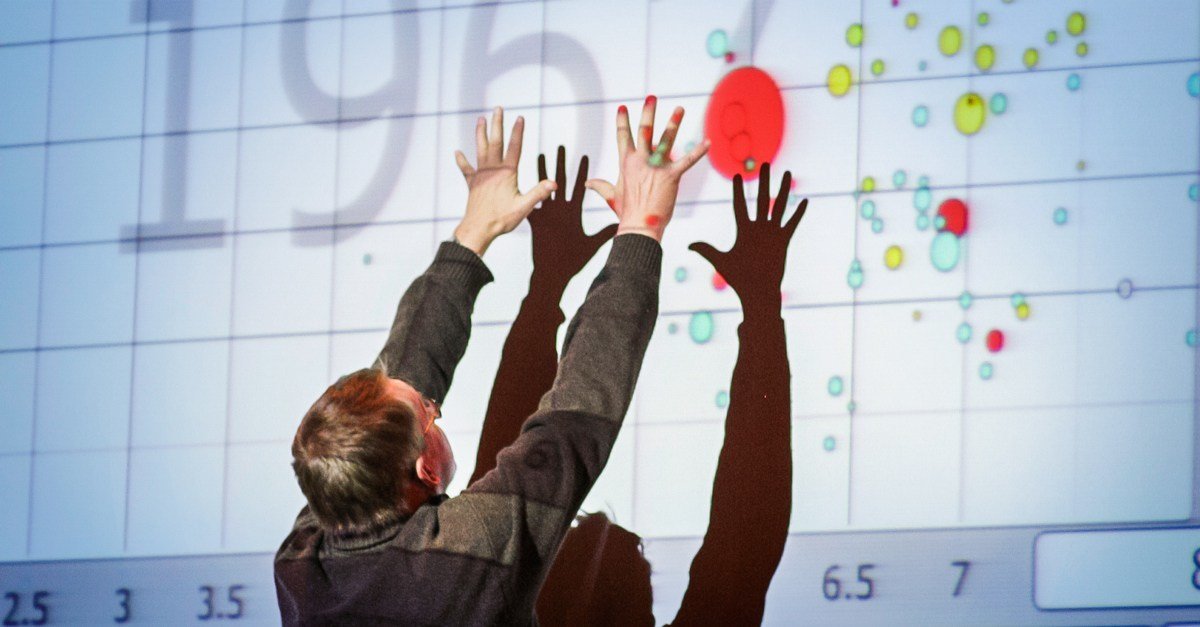
The UX of data
Thanks!
www.maartenlambrechts.com
@maartenzam