Working with data
Part 2


Working with Spreadsheets
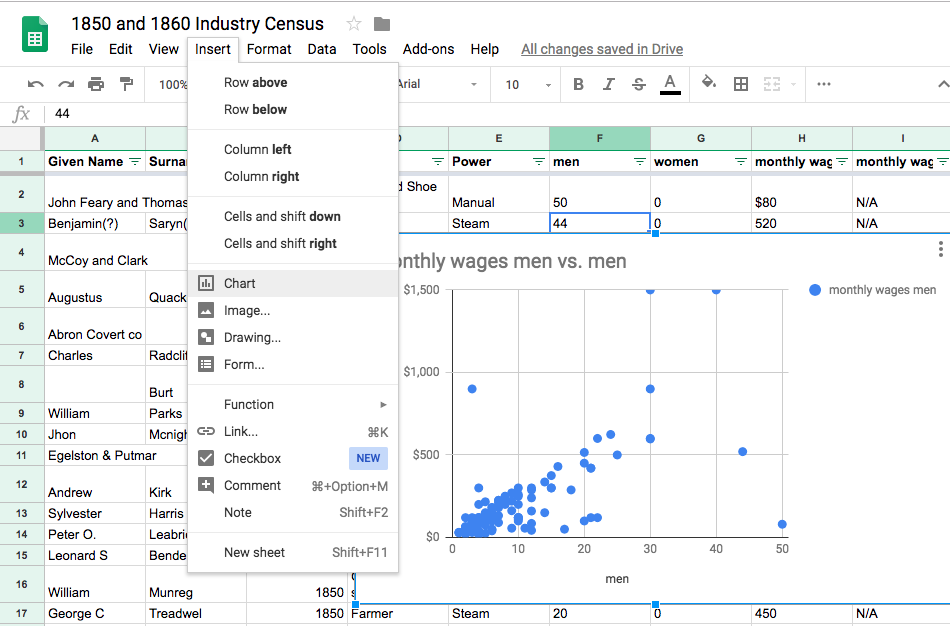
Basic Charts
Most spreadsheet programs can make basic charts, and this might be all your project needs
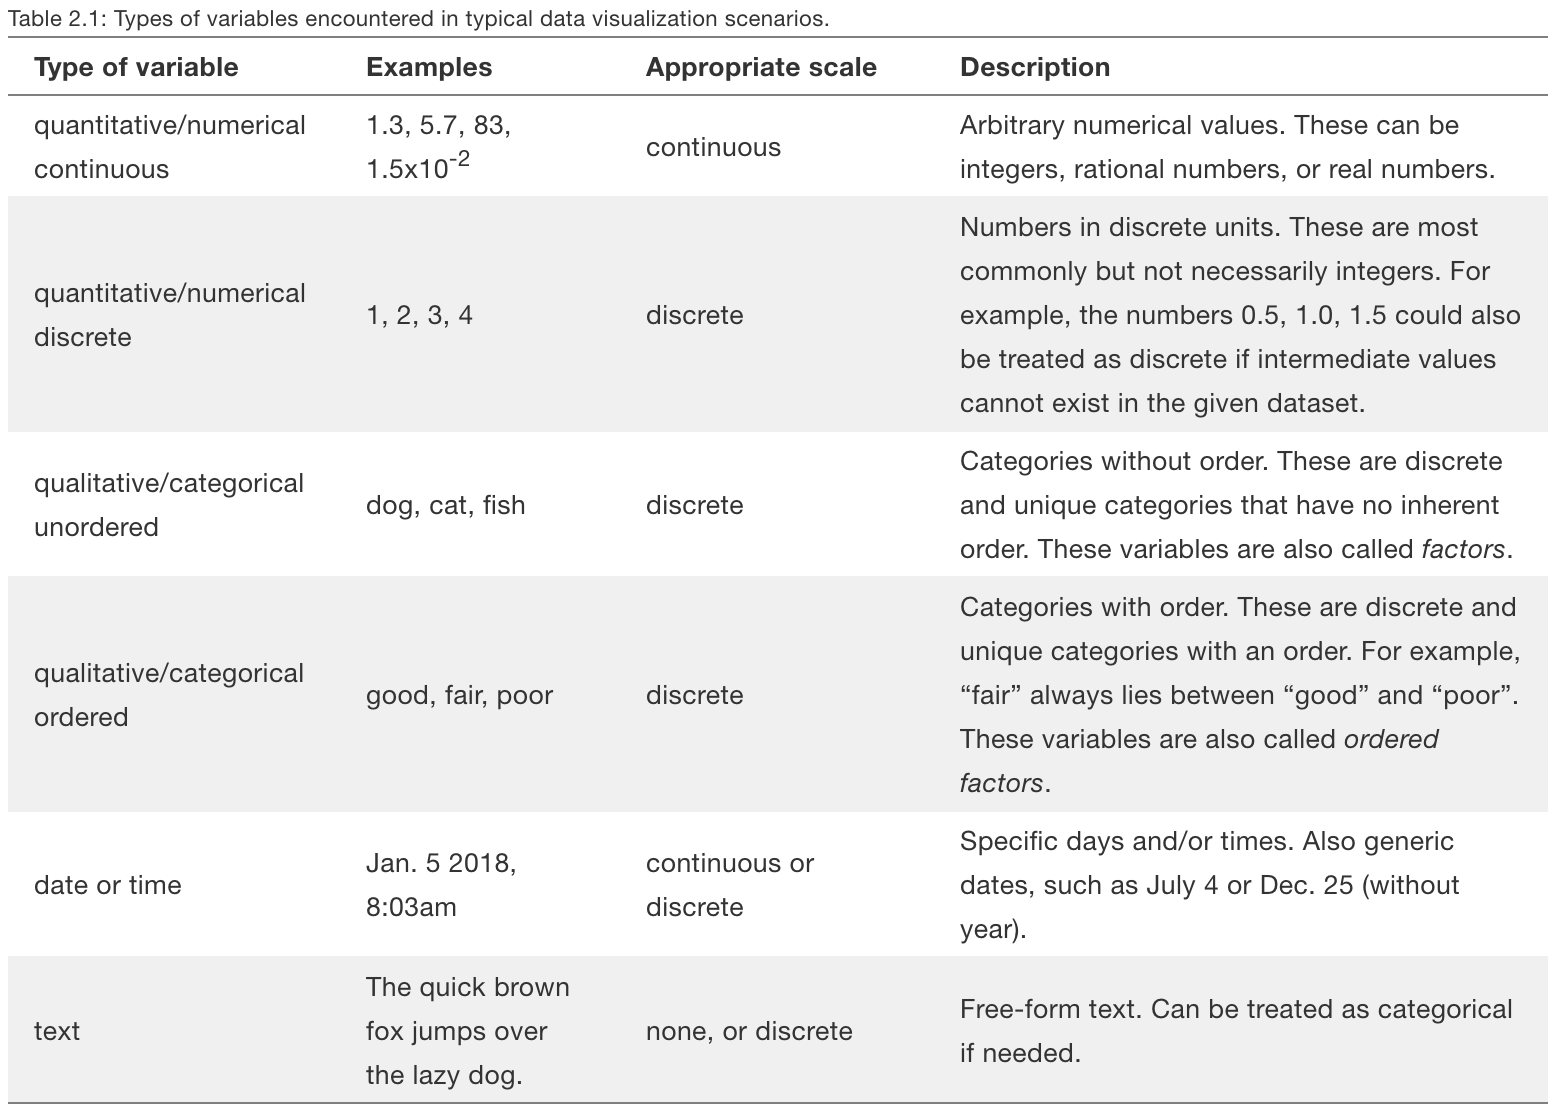
Content type
Discrete: a category or type of thing. Industry, power type, occupation, educational level, and material are all discrete data because there are separate sub-types which do not overlap
Continuous: a spectrum which is connected. Dates, ages, counts, and money are all continuous data because data can fall on any arbitrary point of a spectrum.
Continuous data can sometimes be treated as discrete data
For example: A count of types of power per year uses Year as discrete data because it is used as a category
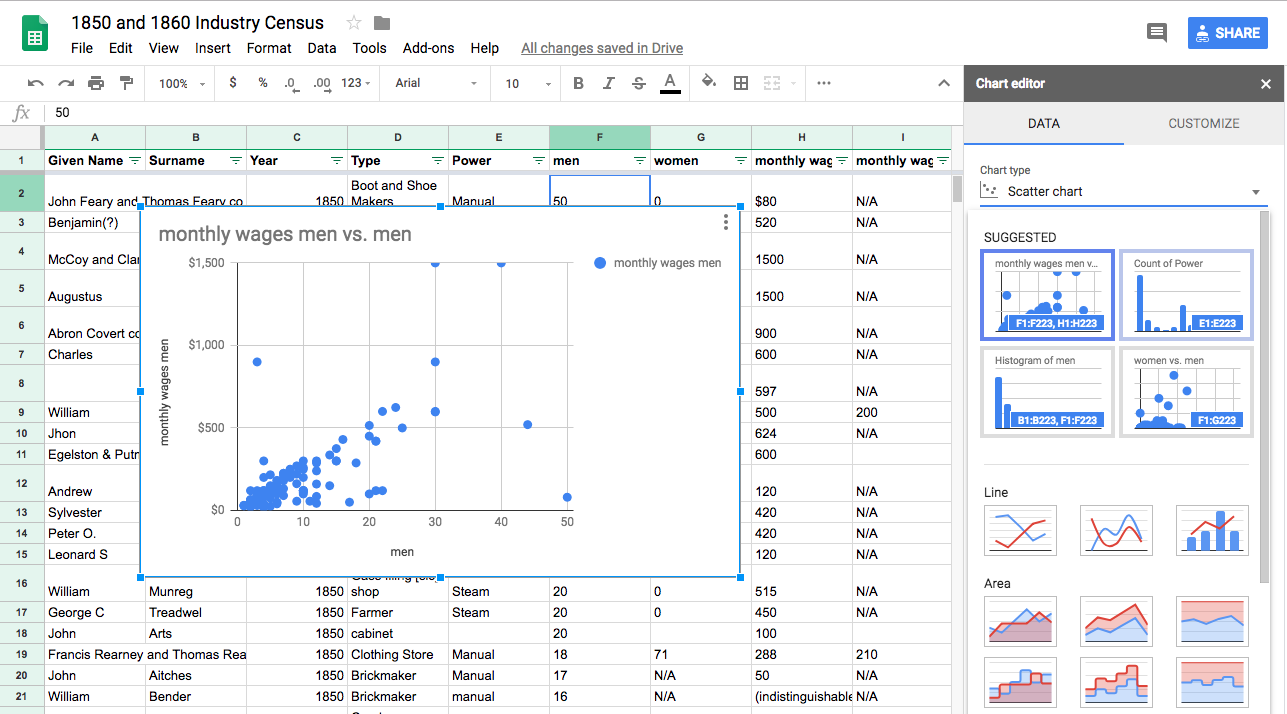
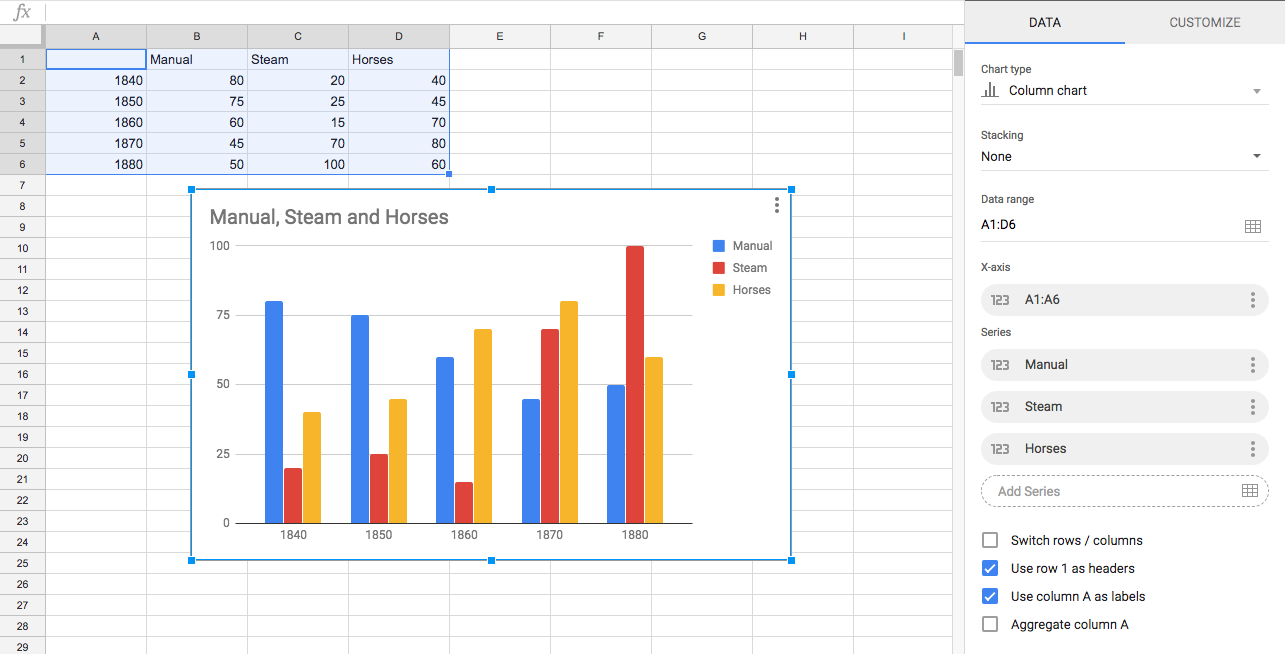
Content type determines your visualization options
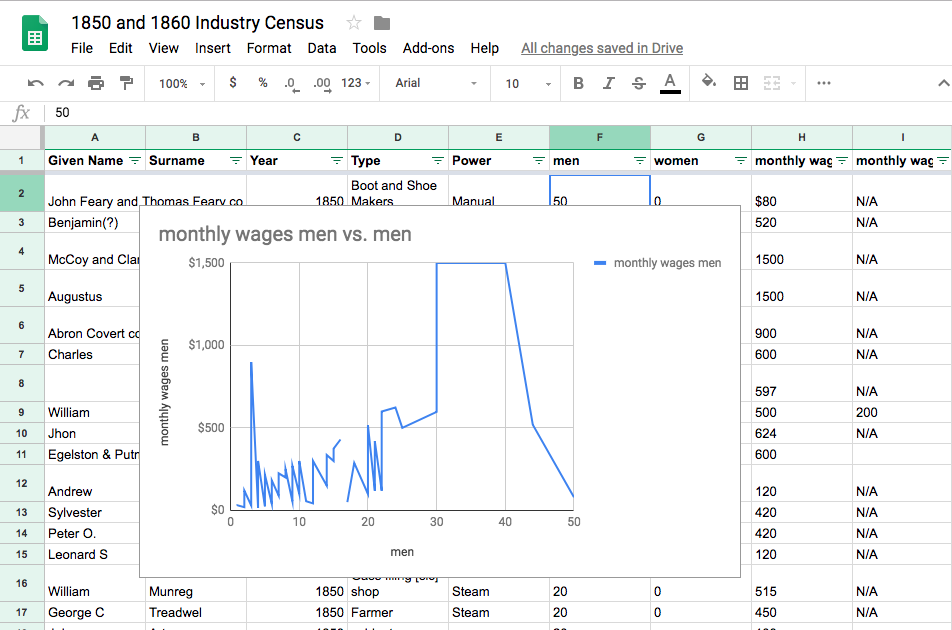
Discrete data should not be displayed with a line or area graphs because it implies a relation that does not exist
=sum( range ) : total up the range
=average ( range ) : find the average of the range
= median( range ) : find the median of the range
=counta( range ) : count the number of items in the range
=if( cell >2,"string if true", "string if false") : check an equation and perform an action if true or false
=countif( range,"string") : count the number of items which match the string
=countif(Sheet1!range, "string") : reference another sheet
Important functions

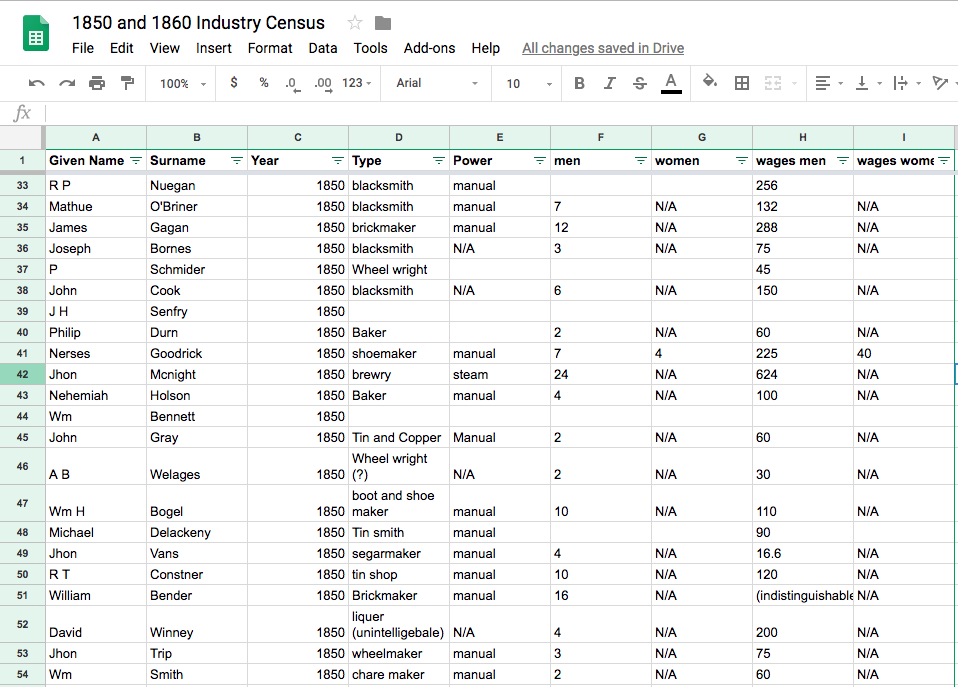
The problem of messy data
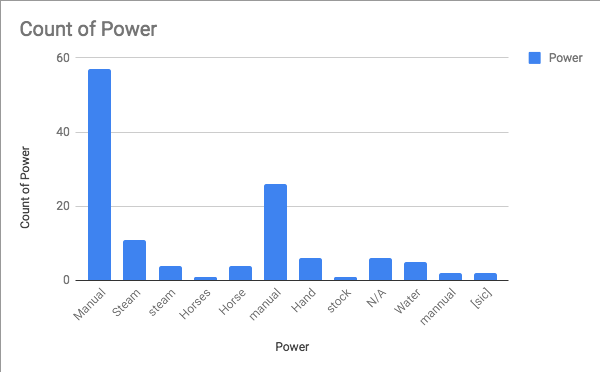
Manual vs. manual vs. mannual vs. Hand
Steam vs. steam
Horses vs. Horse vs. stock
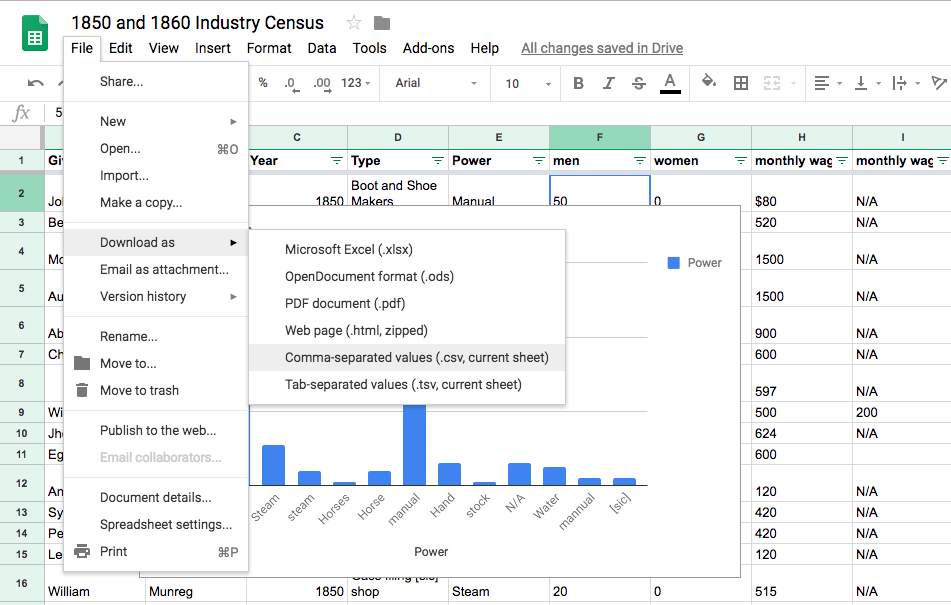
Download
And put it somewhere safe to work with again!
OpenRefine
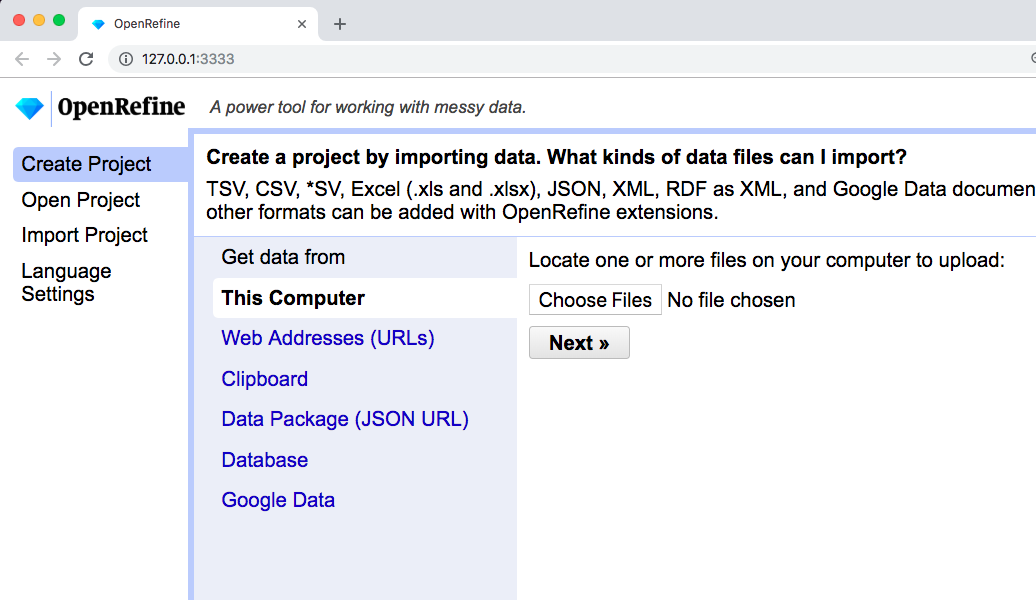
OpenRefine runs on your computer but displays in Chrome or Firefox. If you open OpenRefine and it doesn't immediately open a browser window, type in 127.0.0.1:333
Then open the file we just downloaded!
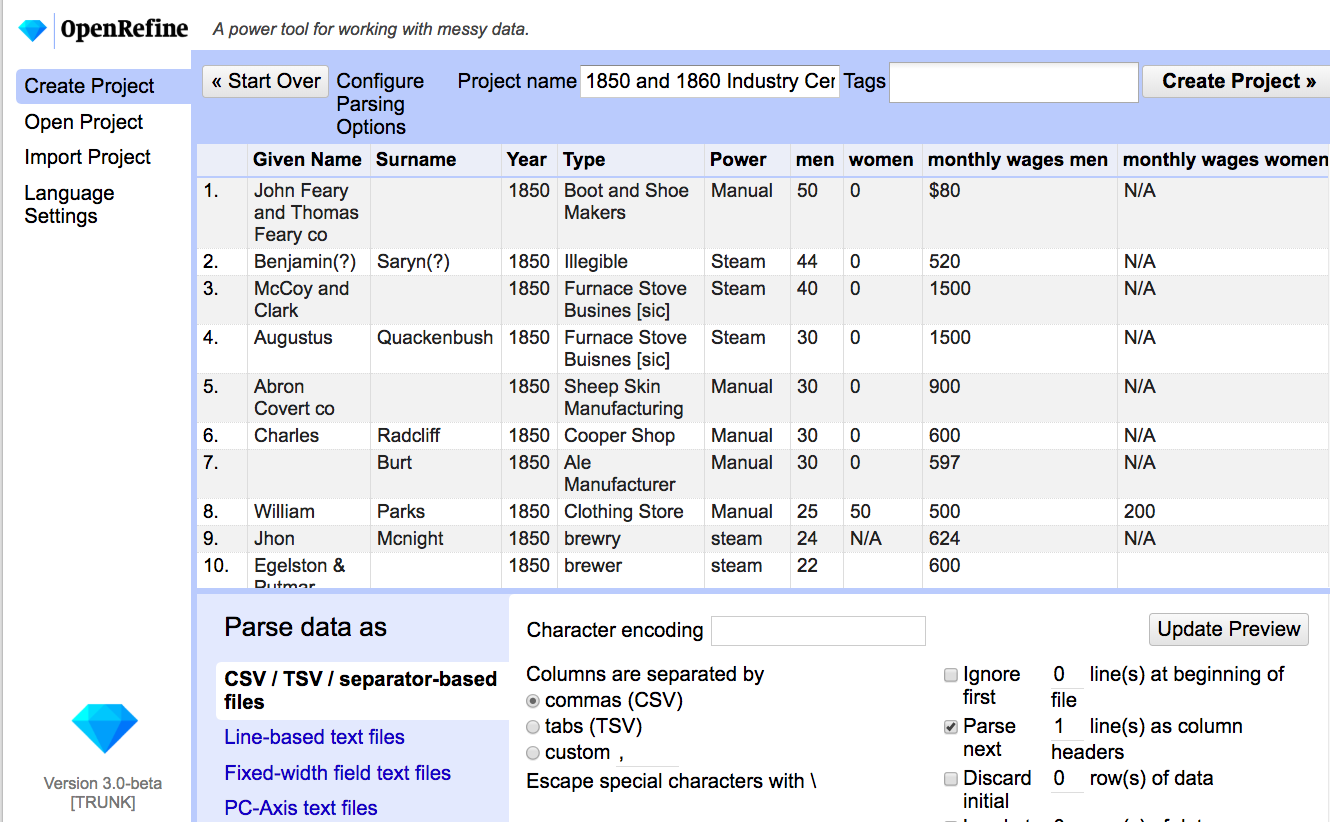
OpenRefine will preview your data to make sure everything looks good (usually you don't need to change anything here)
Give the project a nice name and "Create Project"
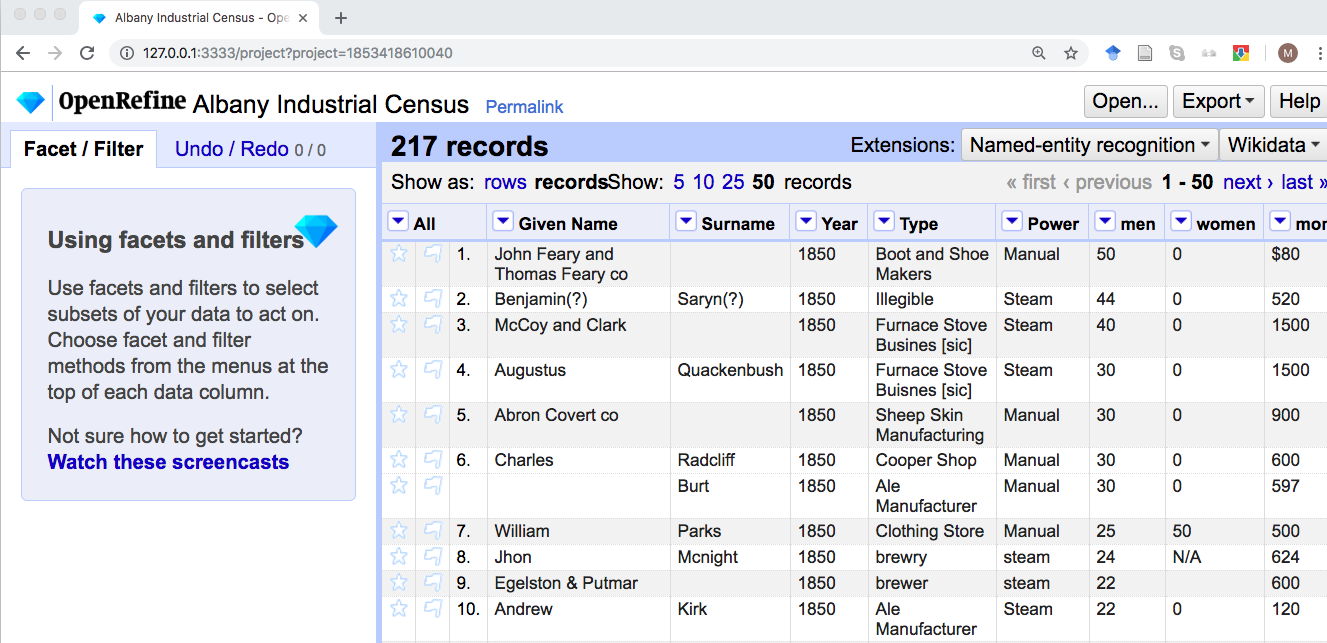
This looks like a spreadsheet but it's not!
OpenRefine is very bad at data entry--it's very difficult to add a record or enter lots of new data in a column
OpenRefine is very good at cleaning up existing data
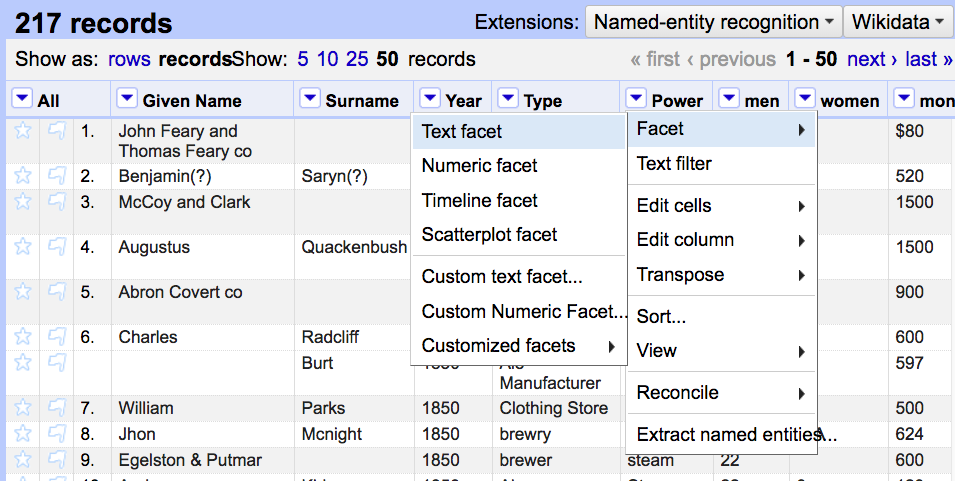
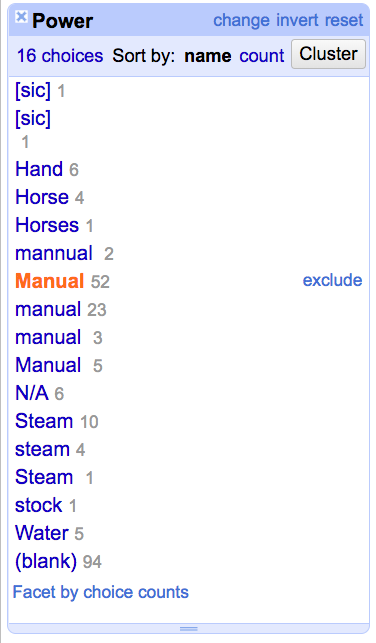
It does this by faceting data. Let's facet the Power column
A facet shows all possible choices within a column, and how many records use that choice
A facet is very similar to a filter and can be used to filter by clicking one of the options
A facet can also be used to edit--hover over "manual" until you see "edit" to the right, and then correct it to read "Manual"
This merges those options and makes it easier to make clean charts in the future!
Faceting Data
For some of these items like [sic] and N/A, that data may not be relevant and we can delete it
(This is why you should always keep an unmodified original transcript!)
What about Steam vs Steam and manual vs manual?
These look the same, what's the difference?