Intro to Tableau
Prepare
Explore
Analyze
Present
Nominal, Textual, Qualitative or Dimensional
- Textual
- Usually categorical
- Usually mutually exclusive
- Can't be quantified
- Can have a controlled vocabulary
- Can't usually be ordered
- Fruit boxes, marriage status, item type, hair color
Ordinal, Numeric, Quantitative or Measurable
- Numeric
- Usually can be counted or measured
- Can't have a controlled vocabulary
- Orderable
Discrete Measure
- Limited number of possible values
- Whole, non-divisible items
- Countable but not measurable
- Usually orderable
- Dates (1808 vs 1809)
- Counts of items (5 children, 4 beavers, 3 skittles, 1 keg)
- Can find a median, average, and sum
Continuous Measure
- Numeric
- Infinite number of possible values
- Can't have a controlled vocabulary
- Always orderable
- Weight, financial cost, distance, time
- Can find a median or average but can't find a sum (average weight of people in class vs total weight of people in class)
Create an account with Tableau Public
Remember this login info, you will need it to save your project all semester!
Content type
Discrete: a category or type of thing. Industry, power type, occupation, educational level, and material are all discrete data because there are separate sub-types which do not overlap
Continuous: a spectrum which is connected. Dates, ages, counts, and money are all continuous data because data can fall on any arbitrary point of a spectrum.
Right Tool for the Right Job
Spreadsheets:
good for data entry, bad for data cleaning and analysis
OpenRefine:
good for data cleaning, bad for data entry and analysis
Tableau:
good for analysis, bad for data entry and data cleaning
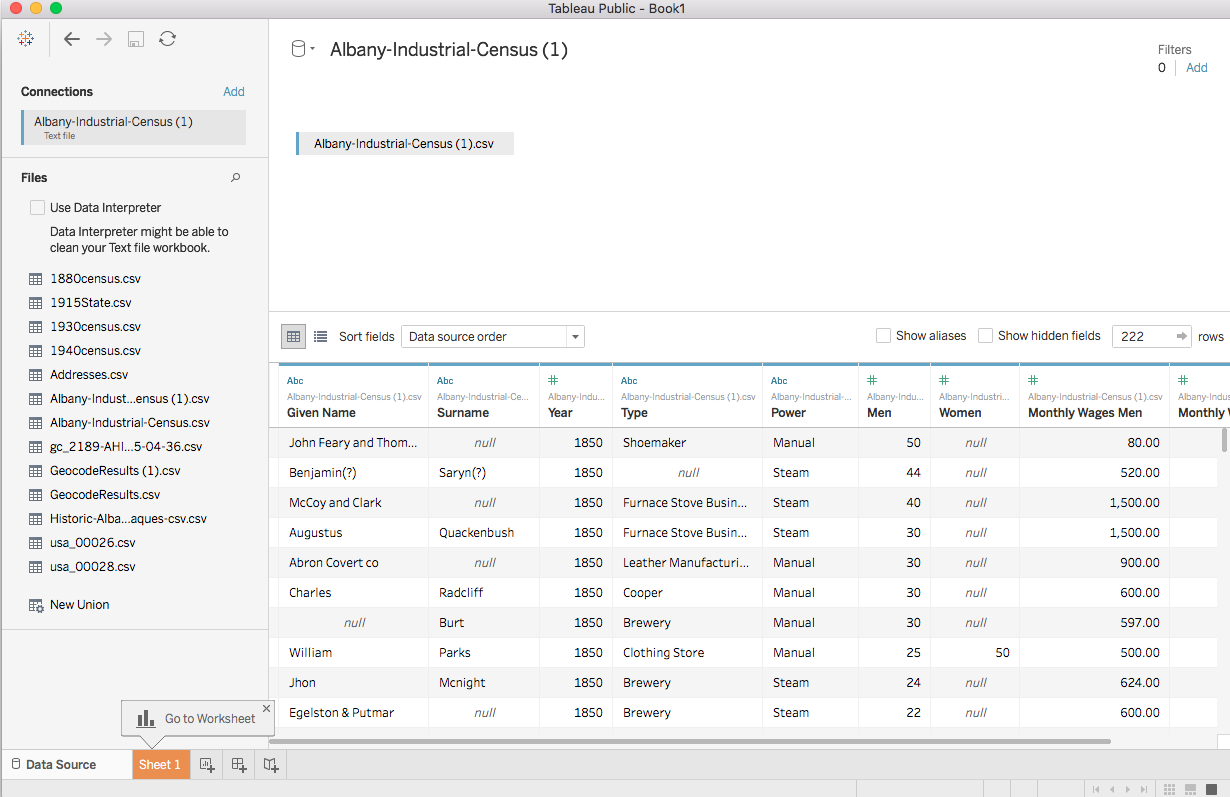
Like OpenRefine, Tableau will preview the data to make sure everything looks good, and like OpenRefine, this looks like a spreadsheet but is very bad for data entry!
In addition to discrete and continuous data, Tableau divides data into dimensions and measures
A dimension is descriptive and is usually discrete.
A measure counts something and is usually continuous
Sometimes a dimension can be continuous, like Year! Sometimes a measure needs to be changed to dimension if we want to use it to describe something instead of count it!
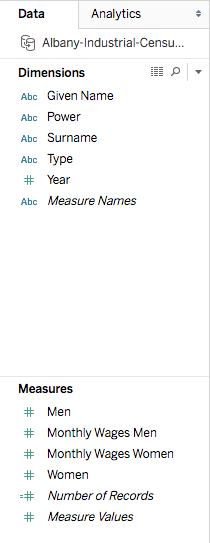
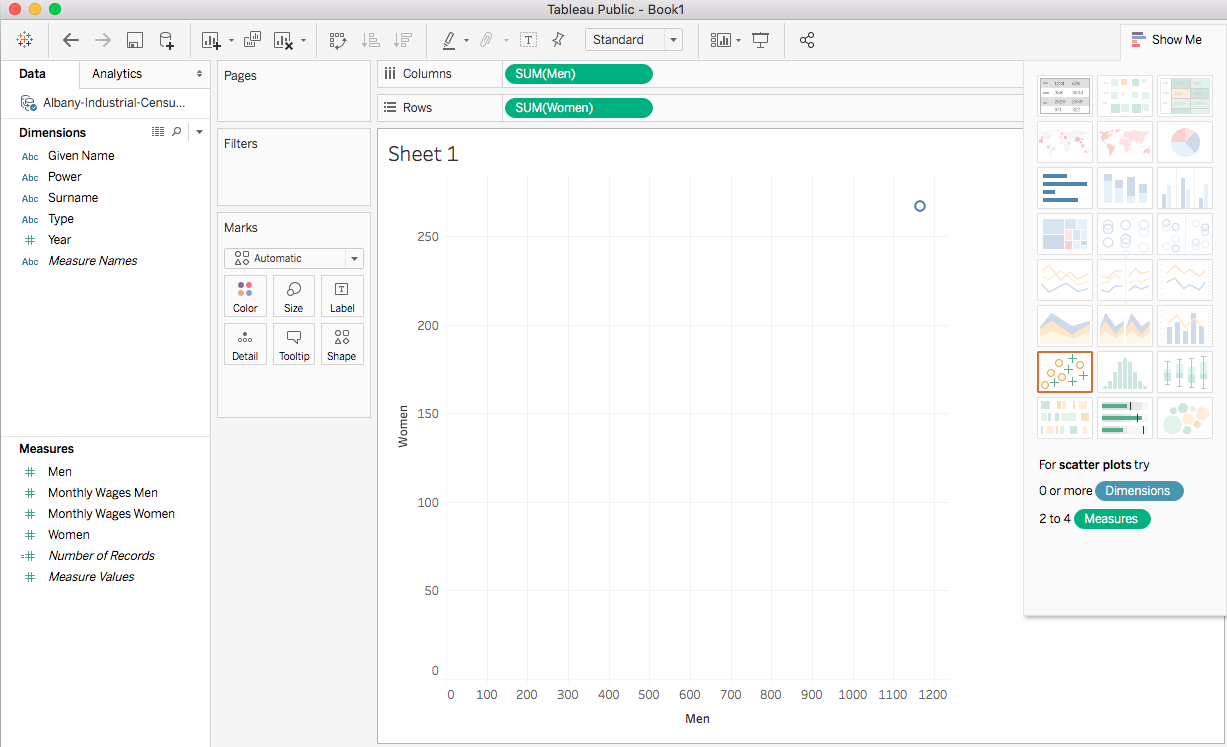
Tableau is not very smart. If you just drag your measures over, it tries to make a guess
With measures, it will usually try to count them
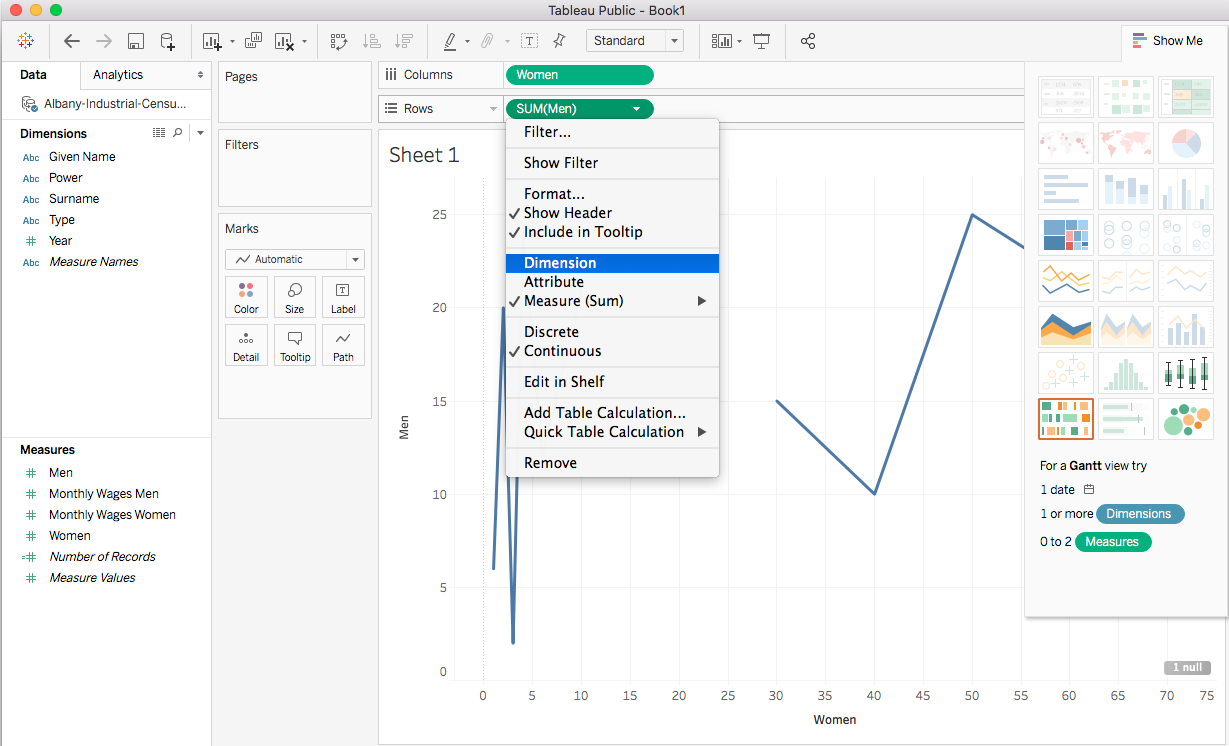
If we change Women and Men from Measure to Dimension, we can compare how many men shops employed vs. how many women they employed
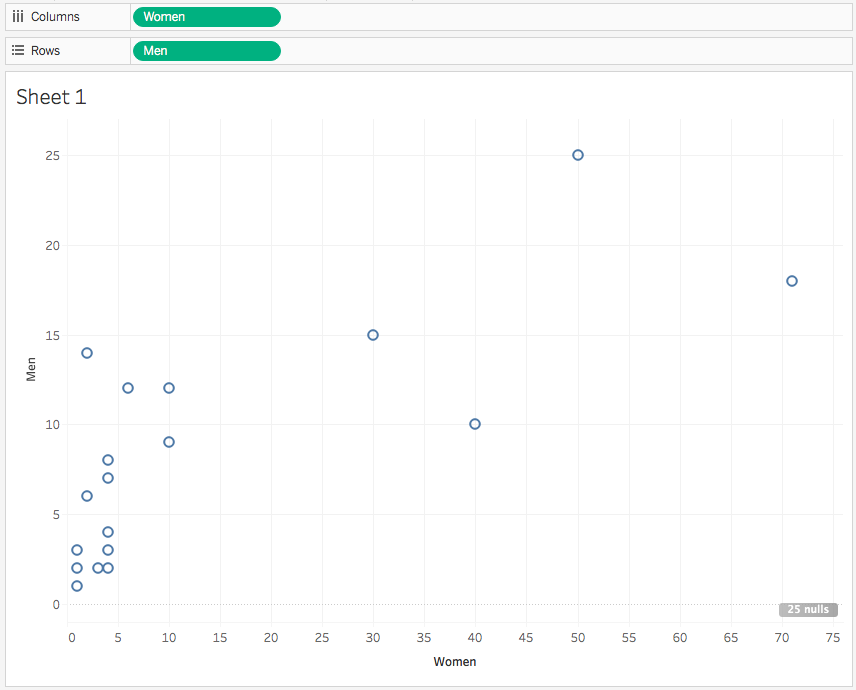
Think of dimension vs measure as an instruction to Tableau:
Dimension says I want to compare two qualities that happen to be numeric, measure says I want to count up the values in this column

By default, Tableau excludes records with no data. Sometimes this is what we want, sometimes it's not. Click "25 nulls" at the bottom right to include shops with no women employees
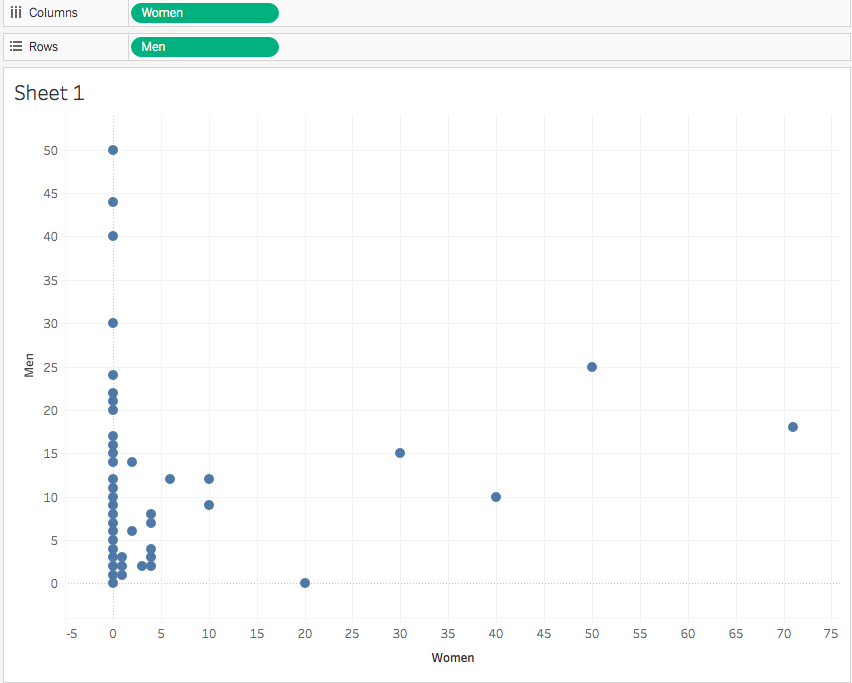
Including null data can make a big difference! We have to use our historian's judgement to determine if showing shops with no female employees matters to the story we're telling
For now let's say it doesn't matter and hit the back arrow at the top left to undo
To see the trend in our data, click the Analytics tab and drag "Trend Line" over the chart, dropping it on "Linear"
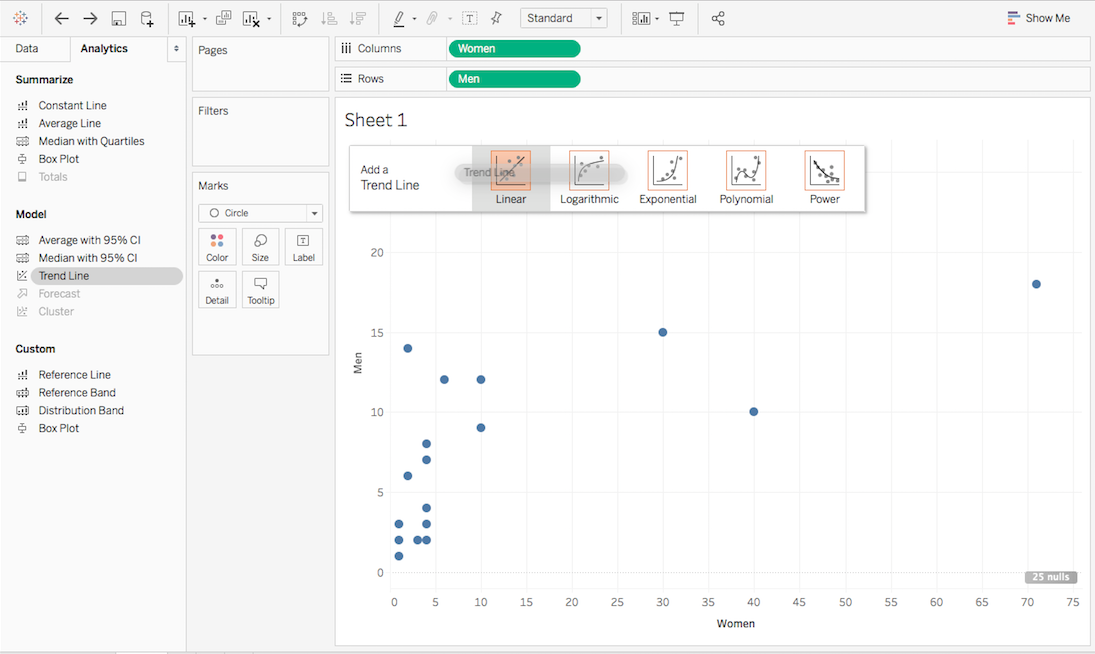
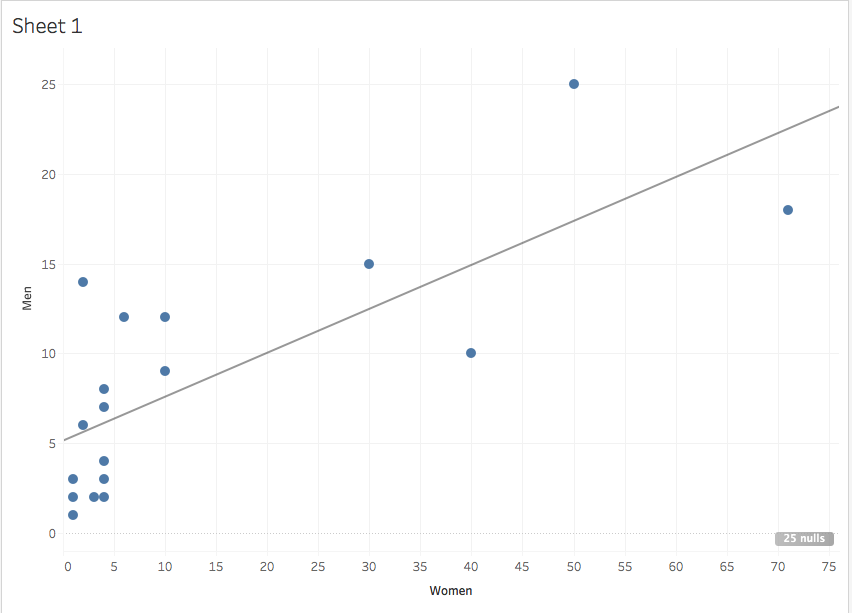
This helps us see that in shops that employed both men and women, the trend was to employ roughly equal proportions of men and women
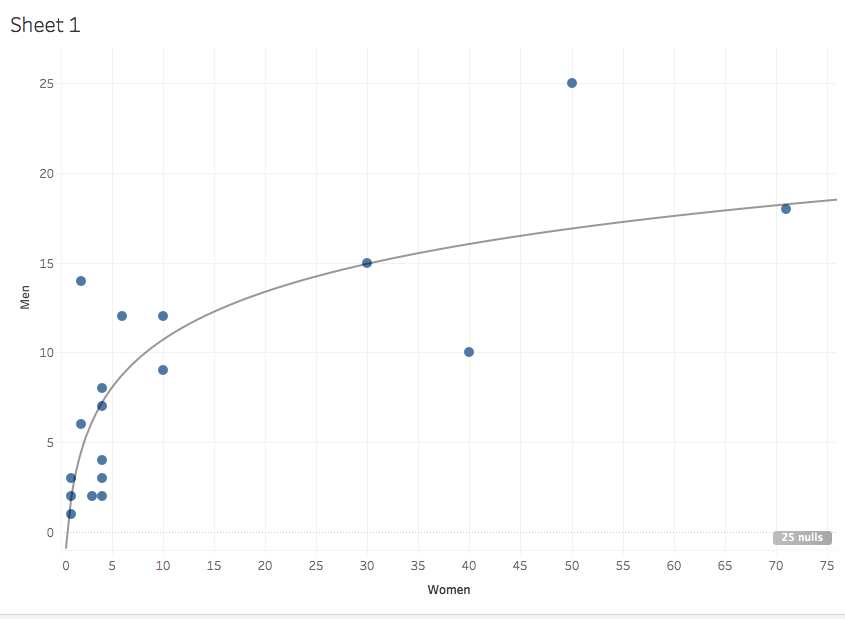
Logarithmic trend line
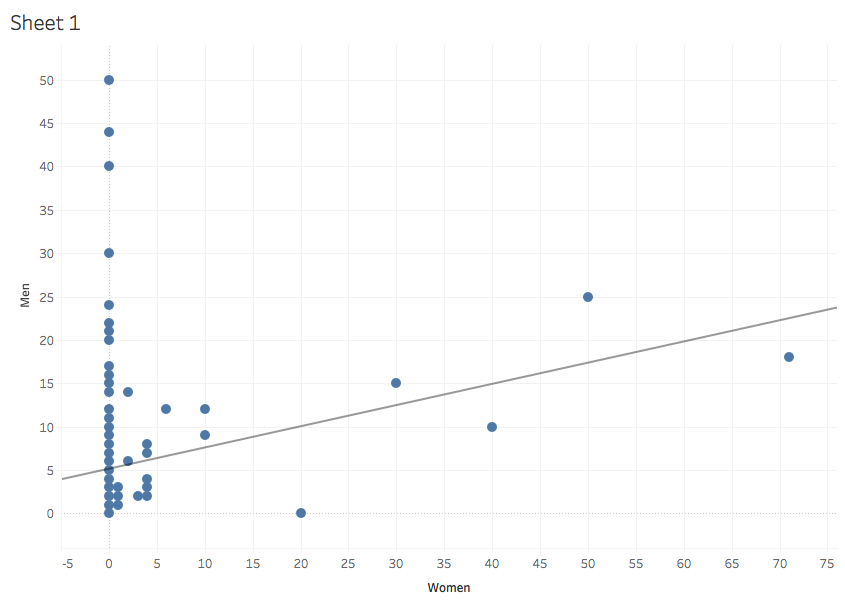
Linear with null values
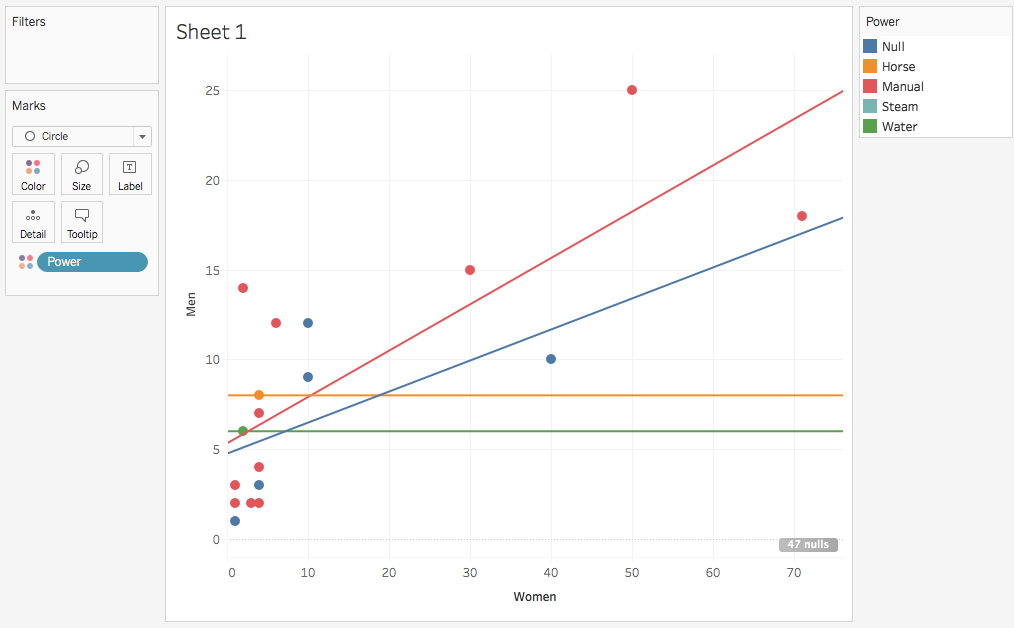
If we drag Power from dimensions to Color, we can see that there are different trends in different kinds of shops
(This might not be significant, though, because there's only one Horse and Water shop each in the data!)
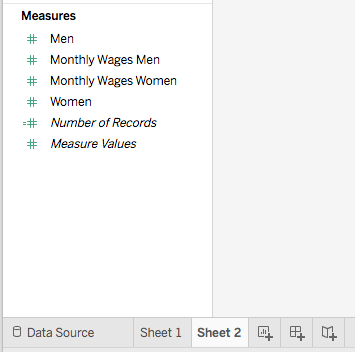
Tableau has multiple sheets like a spreadsheet program. Let's add another by clicking the little chart icon next to "Sheet 1" in the lower left
These sheets can be renamed to keep them straight! Just right click to rename

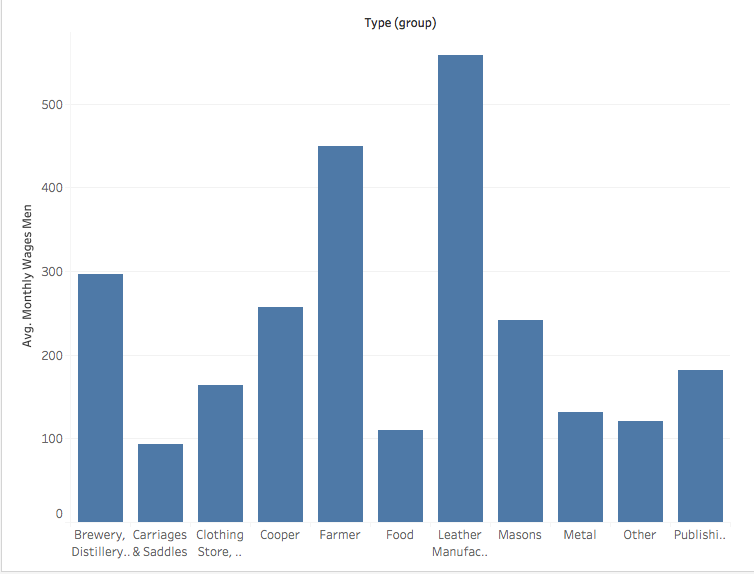
Drag Type to Columns and Monthly Wages Men to Rows to make a bar chart
This is adding together all the wages paid
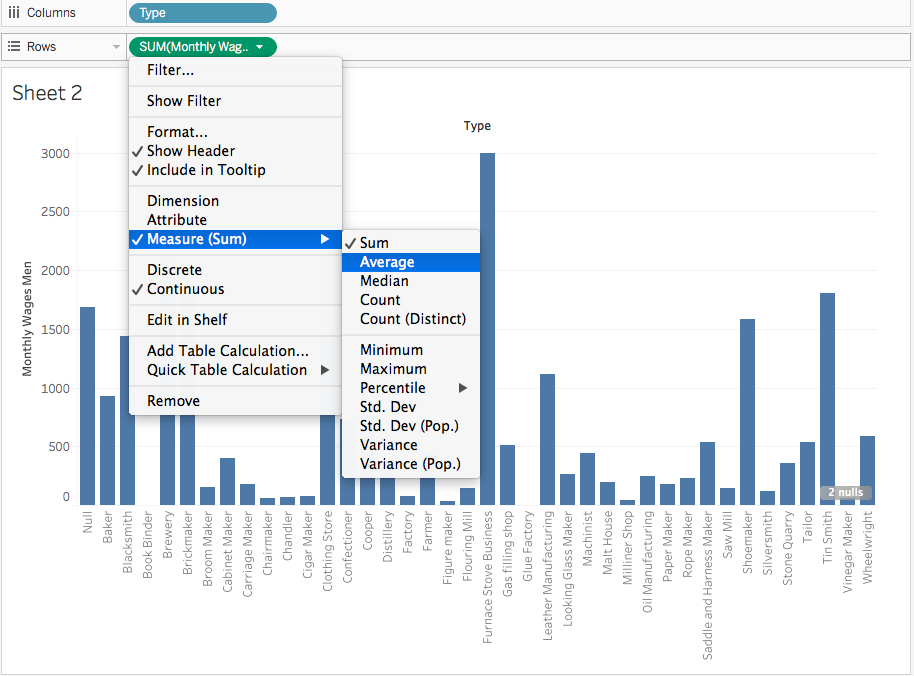
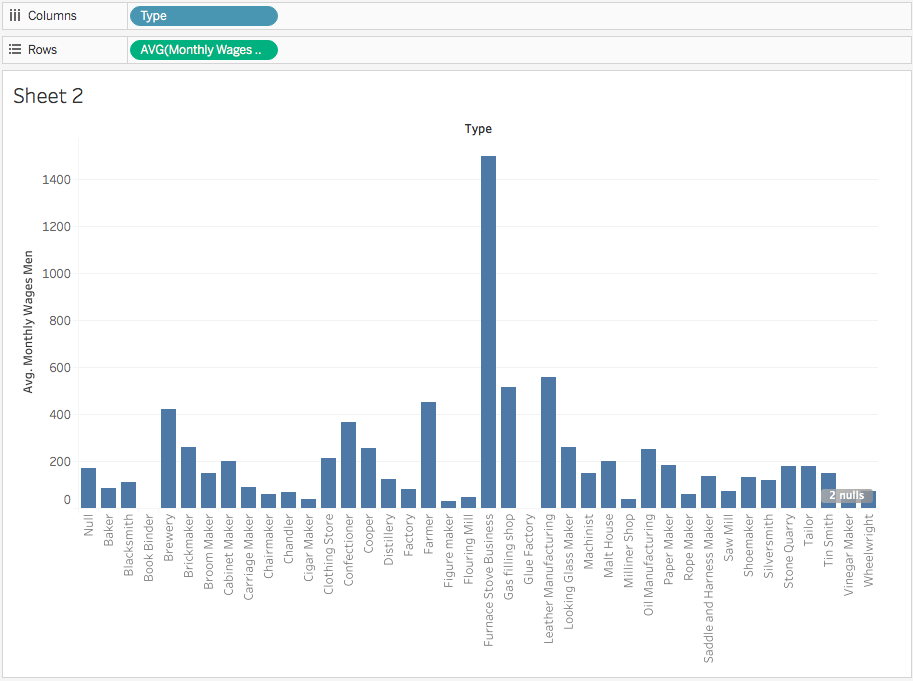
Instead of adding together the wages paid, let's get the average per shop
You have to use your historian's judgement: what's the story you want to tell? Is it about the amount spent on wages in an industry or the average spent on wages in certain shops?
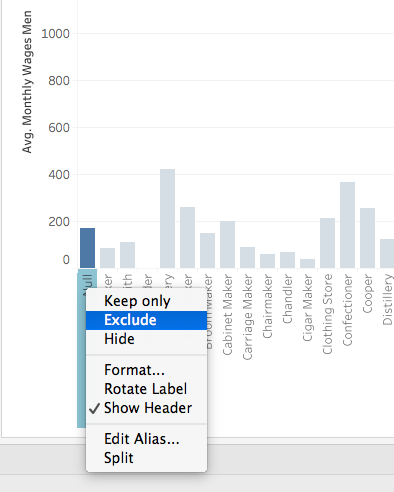
Sometimes we don't want to show some data. Let's get rid of nulls by right clicking and selecting Exclude.
This will add a filter similar to a spreadsheet filter or OpenRefine facet
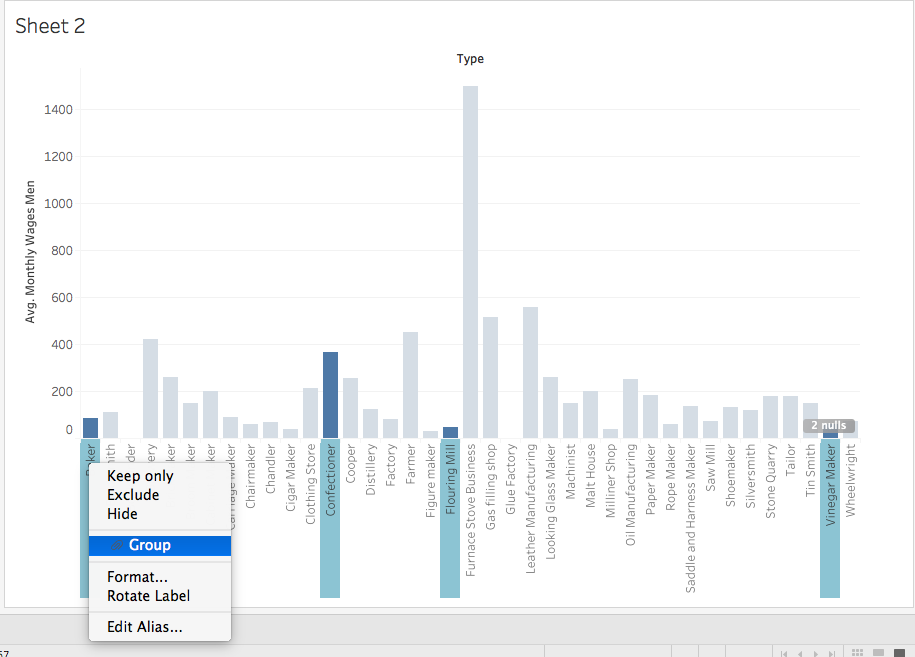
Grouping data
To group columns together, command-click/Windows-click on several columns (try all food-related shops) and then right-click one to select Group
This creates a new dimension in the Data tab
Grouping several shops together into industries and excluding the outlier Furnace Stoves gives us a better idea of the average
Groups can be renamed by right-clicking the bar and selecting "Edit Alias"
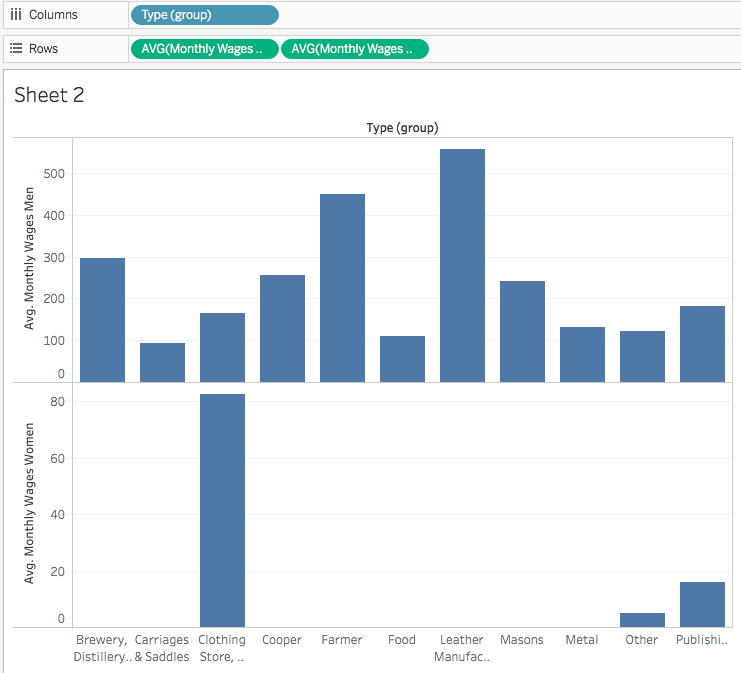
To compare men's and women's wages, we could just drag Monthly Wages Women to Rows, change Sum to Average, and compare the two charts visually
But this doesn't look good and is hard to read--the labels are far from the data, and it's hard to compare men's and women's wages
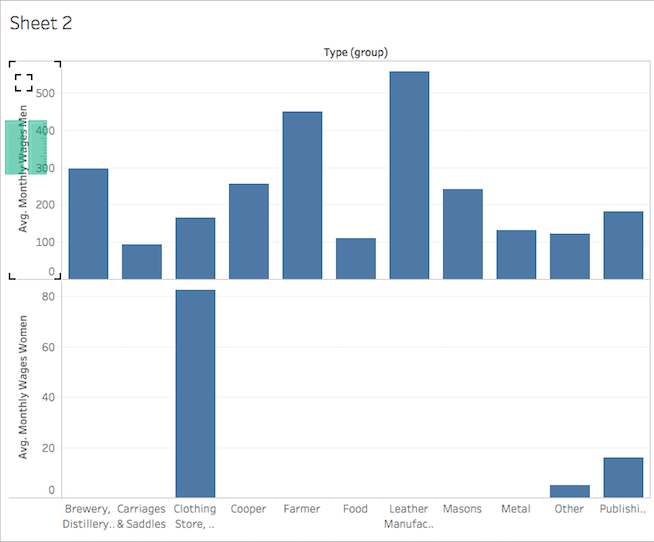
To combine the charts, hover over the Avg. Monthly Wages Women until a small triangle appears, grab the triangle, and drag it up into the Avg. Monthly Wages Men pane
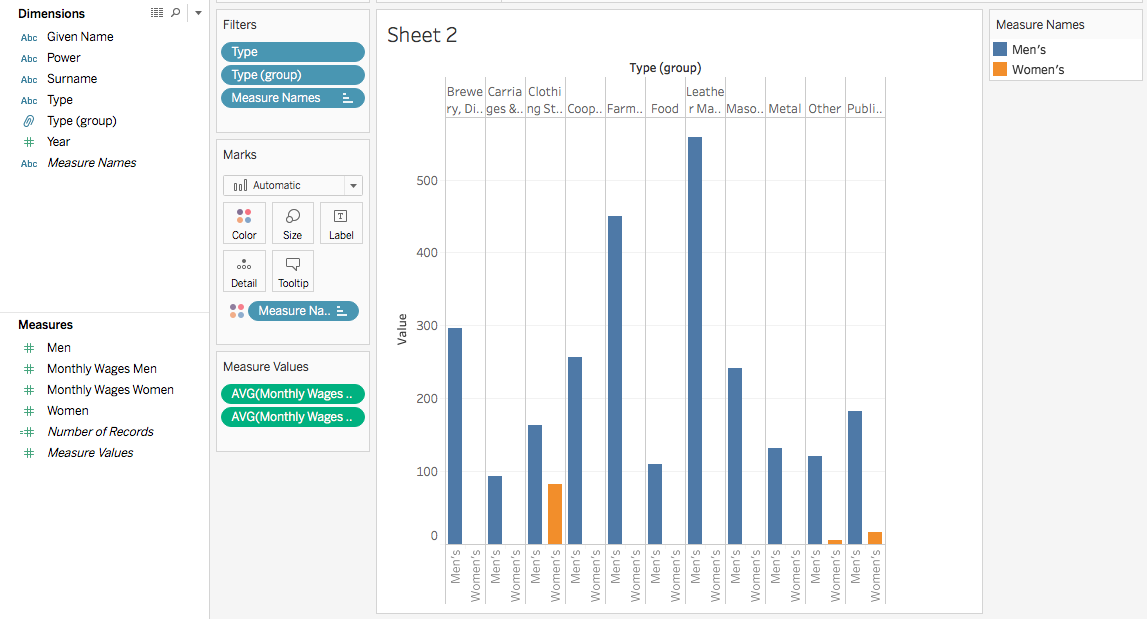
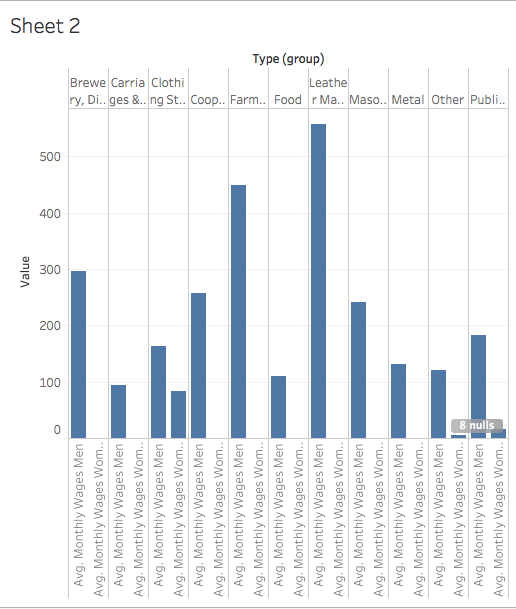
To color the bars by gender, drag "Measure Names" from the Dimensions pane to the Color card in the Marks pane
This will create a legend, where you can right-click to Edit Alias
Right now our chart looks good but it doesn't actually tell us much--shops with more employees pay more wages, because our data only reports wages paid to all employees per month. How much did each employee make?
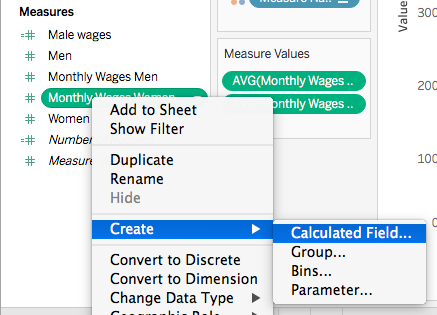
Time for some math. Right click "Monthly Wages Women" and select Create > Calculated Field
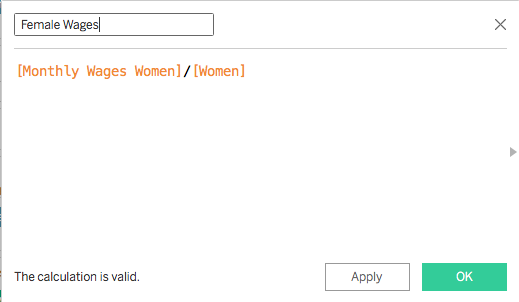
To get wages per person, we need to divide the total wages paid by the number of employees in a shop. Start typing for a measure name and Tableau will find all matches and correctly format the formula if you click on the correct name.
Give the new Calculated Field a nice name and hit OK. Do the same for men's wages.
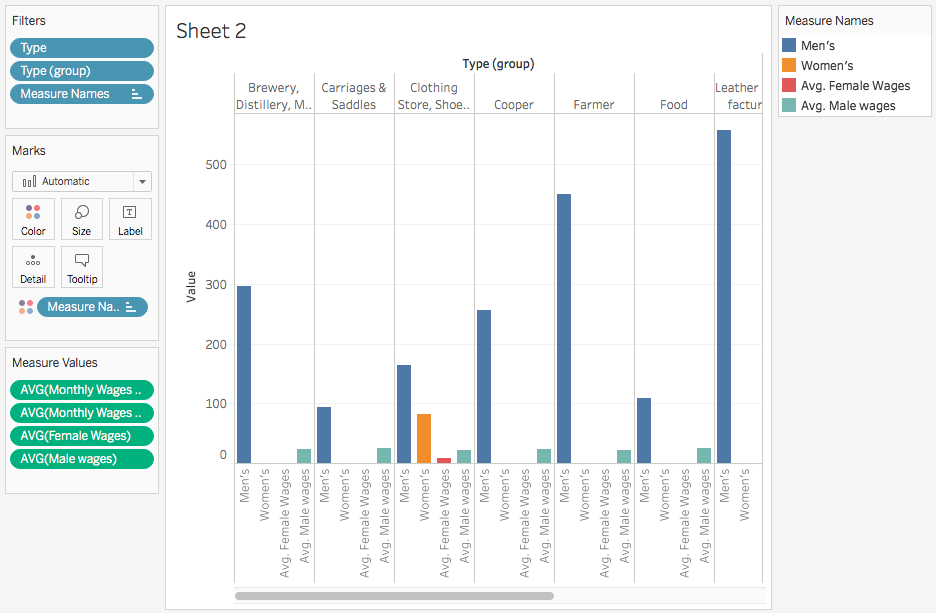
If we drag the new fields over to "Measure Values", this makes for a bad comparison of apples to oranges. Let's get rid of AVG(Monthly Wages) for men and women by right-clicking and selecting Remove
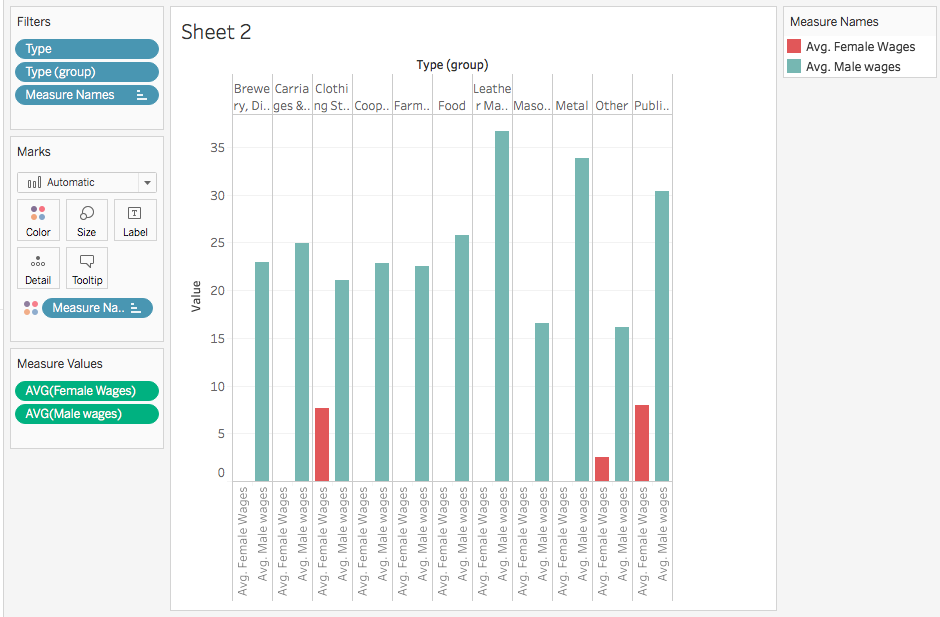
Now we can see that female employees on average were paid less than male employees in the same shop, and that men employed as masons made much less than brewery workers
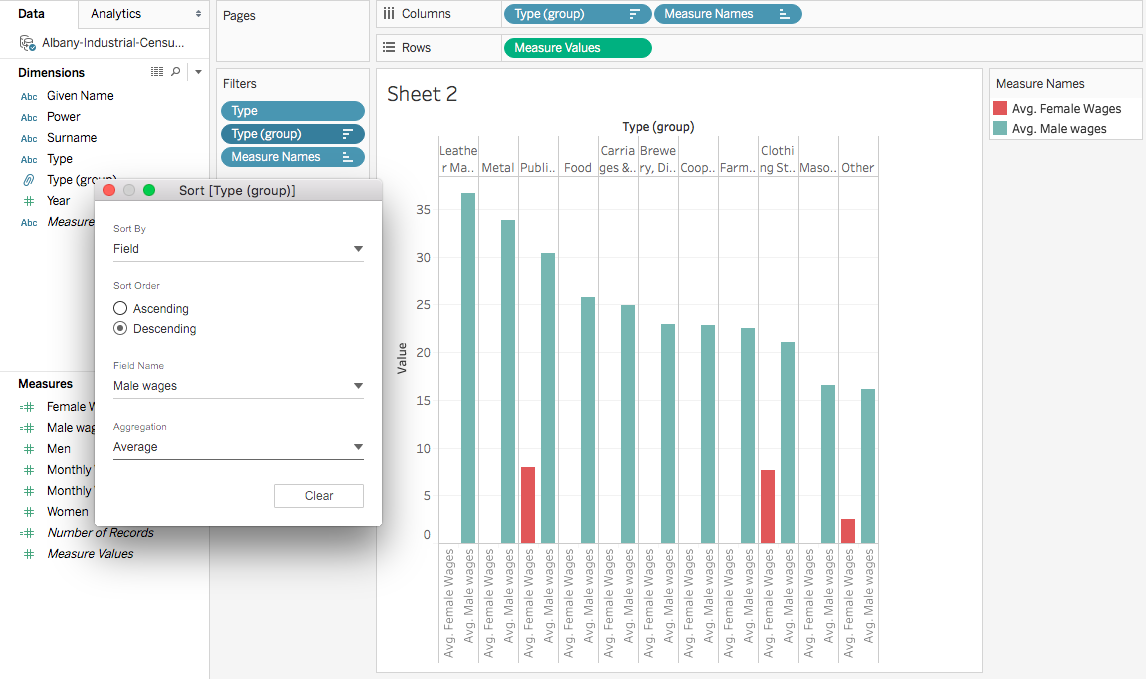
To make our chart more readable, let's right-click Type (group) in the filter pane, then Sort by Field, descending, with Field Male Wages and Average
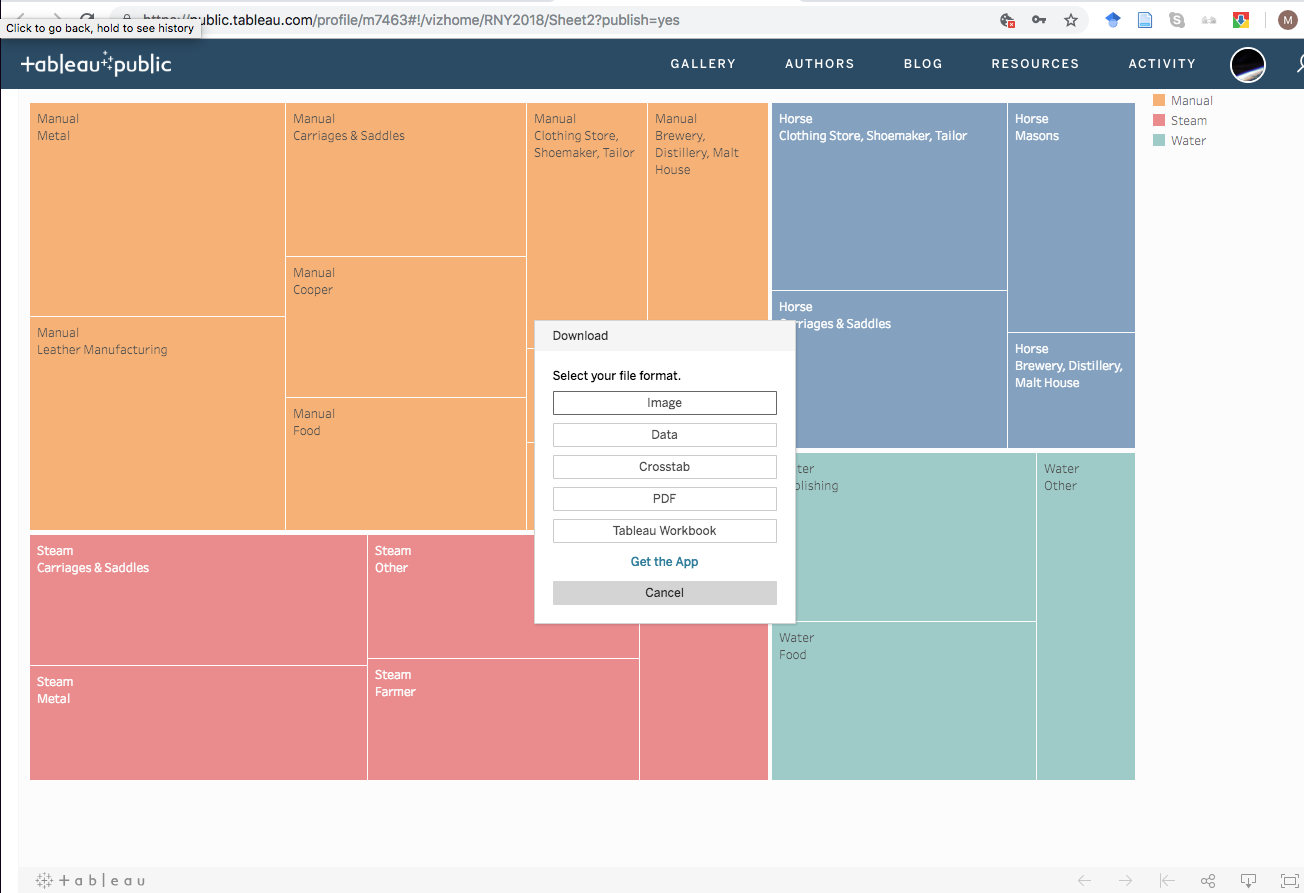
The major downside of Tableau is it stores all your data online and you have to download images or embed the interactive graph in a web page
Mapping Data
Download the 1815 City Directory file and create a new Tableau project
This dataset was cleaned with OpenRefine and the Latitude/Longitude coordinates obtained using the free software QGIS. QGIS is beyond the scope of this workshop, but ask if you're interested!
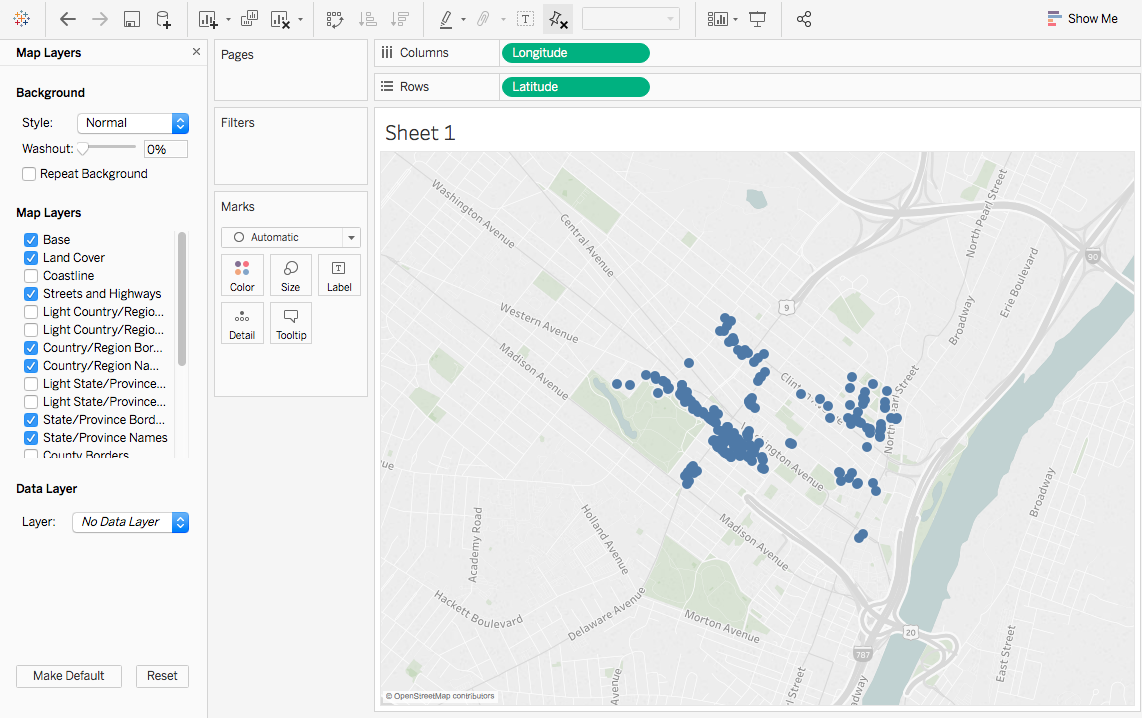
If we drag Longitude to Columns and Latitude to Rows, we get a nice map!
We might need to select Map > Map Layers and customize to get roads to show up
With so many points, it's hard to see individuals
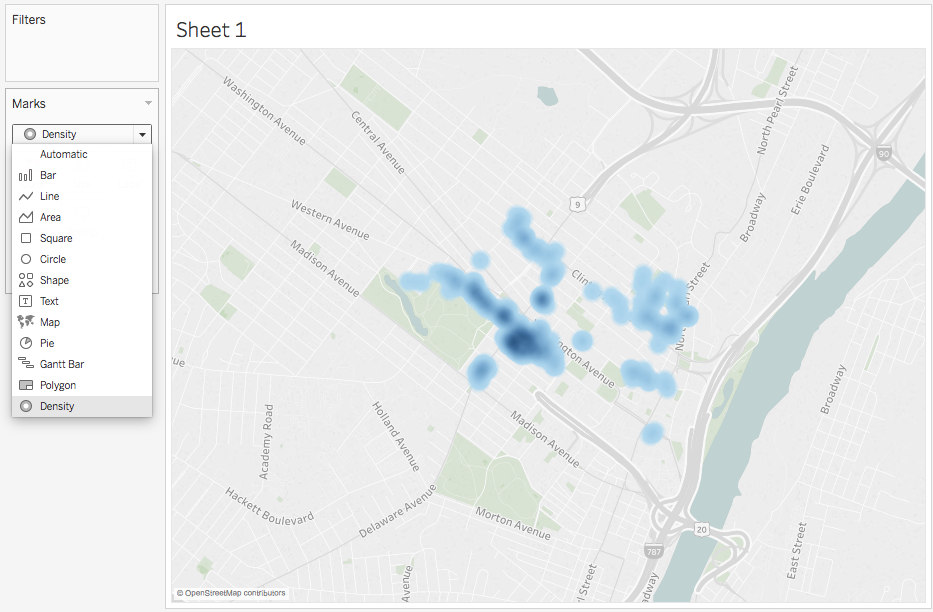
If we select Density under Marks, we can see where there are more plaques clustered
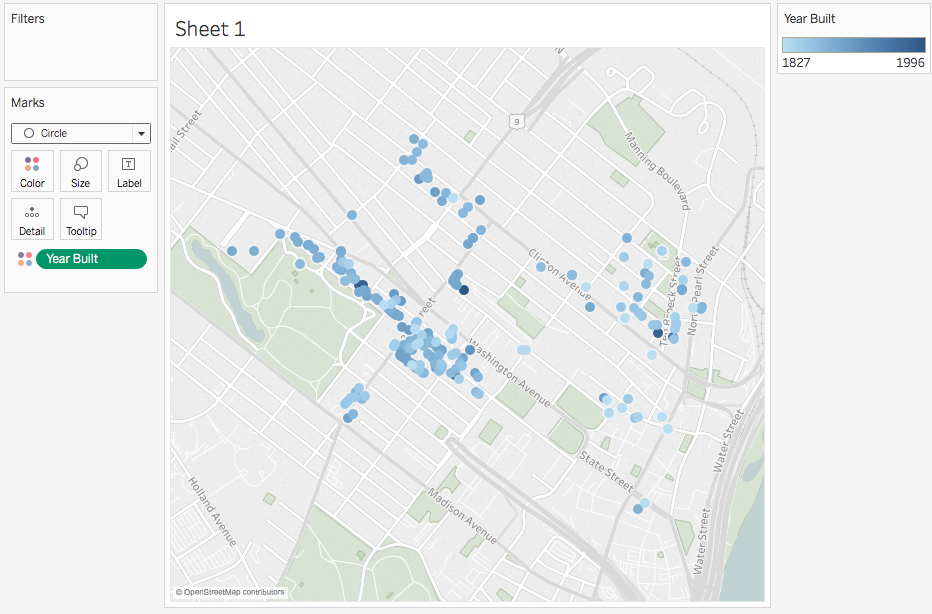
Or if we change Mark to Circle, we can drag Year Built to Color and see where older homes cluster
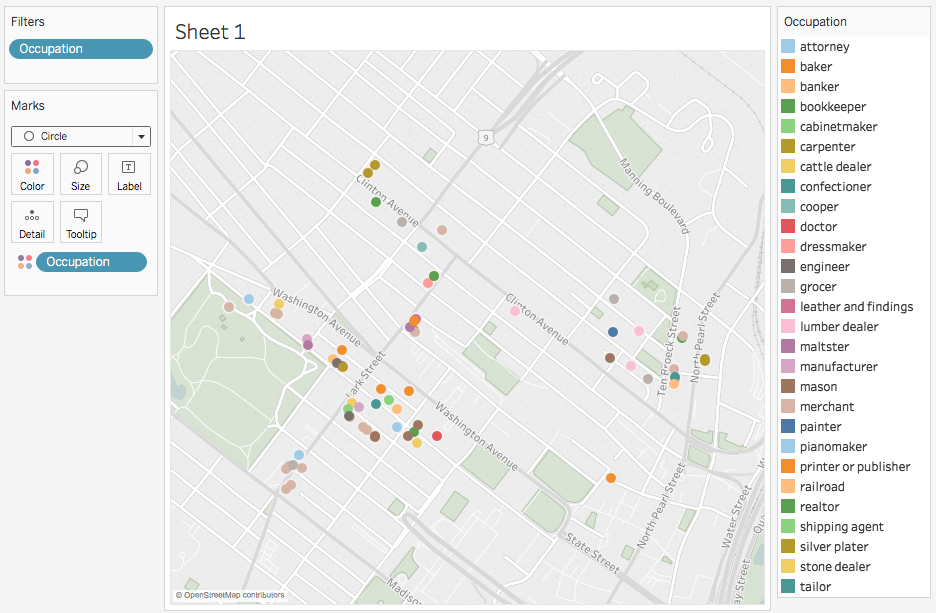
We could also drag Occupation to Color and exclude Null to see if homes cluster by profession