


Pablo Bravo
PhD Candidate in Quantitative Biosciences at GeorgiaTech. I am interested in biofilms, and how their topography evolves and what we could learn about their development by looking at them
YunkerLab, Georgia Institute of Technology
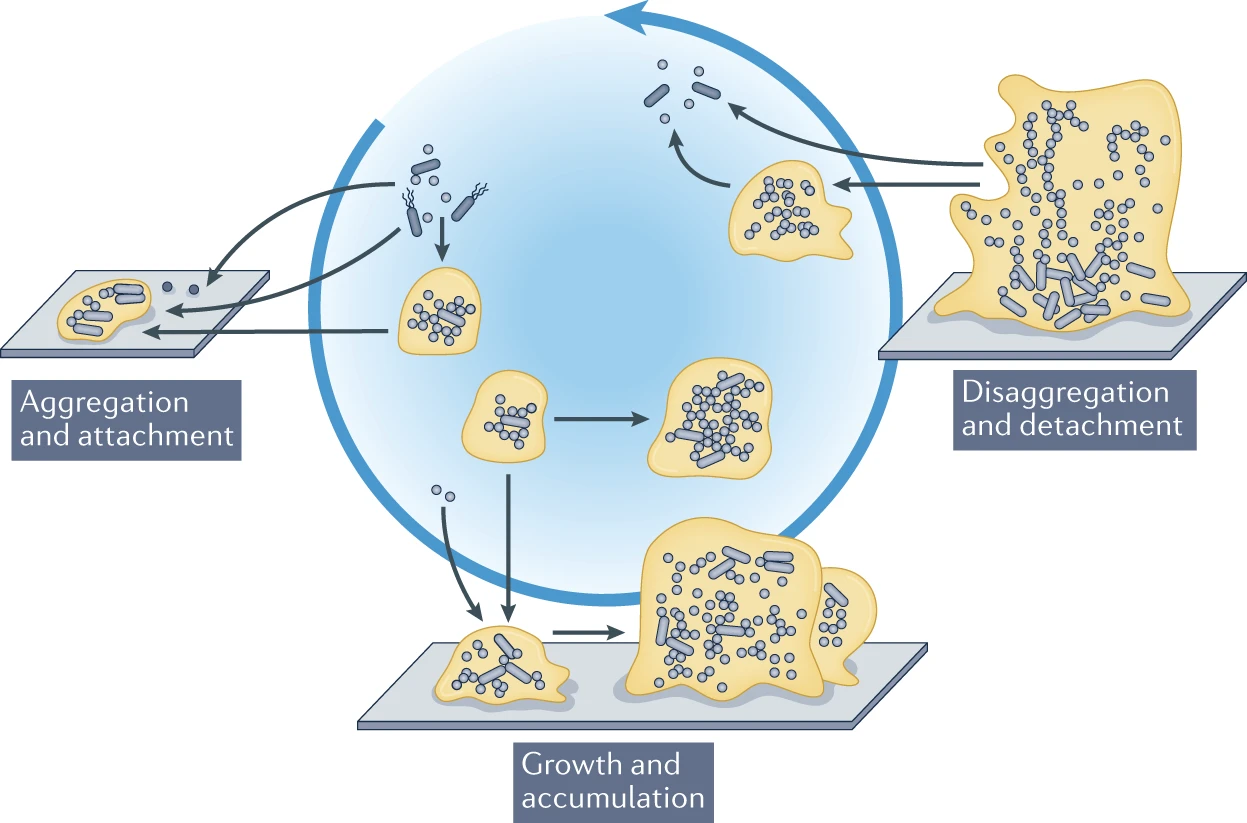
Extracellular matrix formed of polysaccharides, DNA, and proteins
Surface
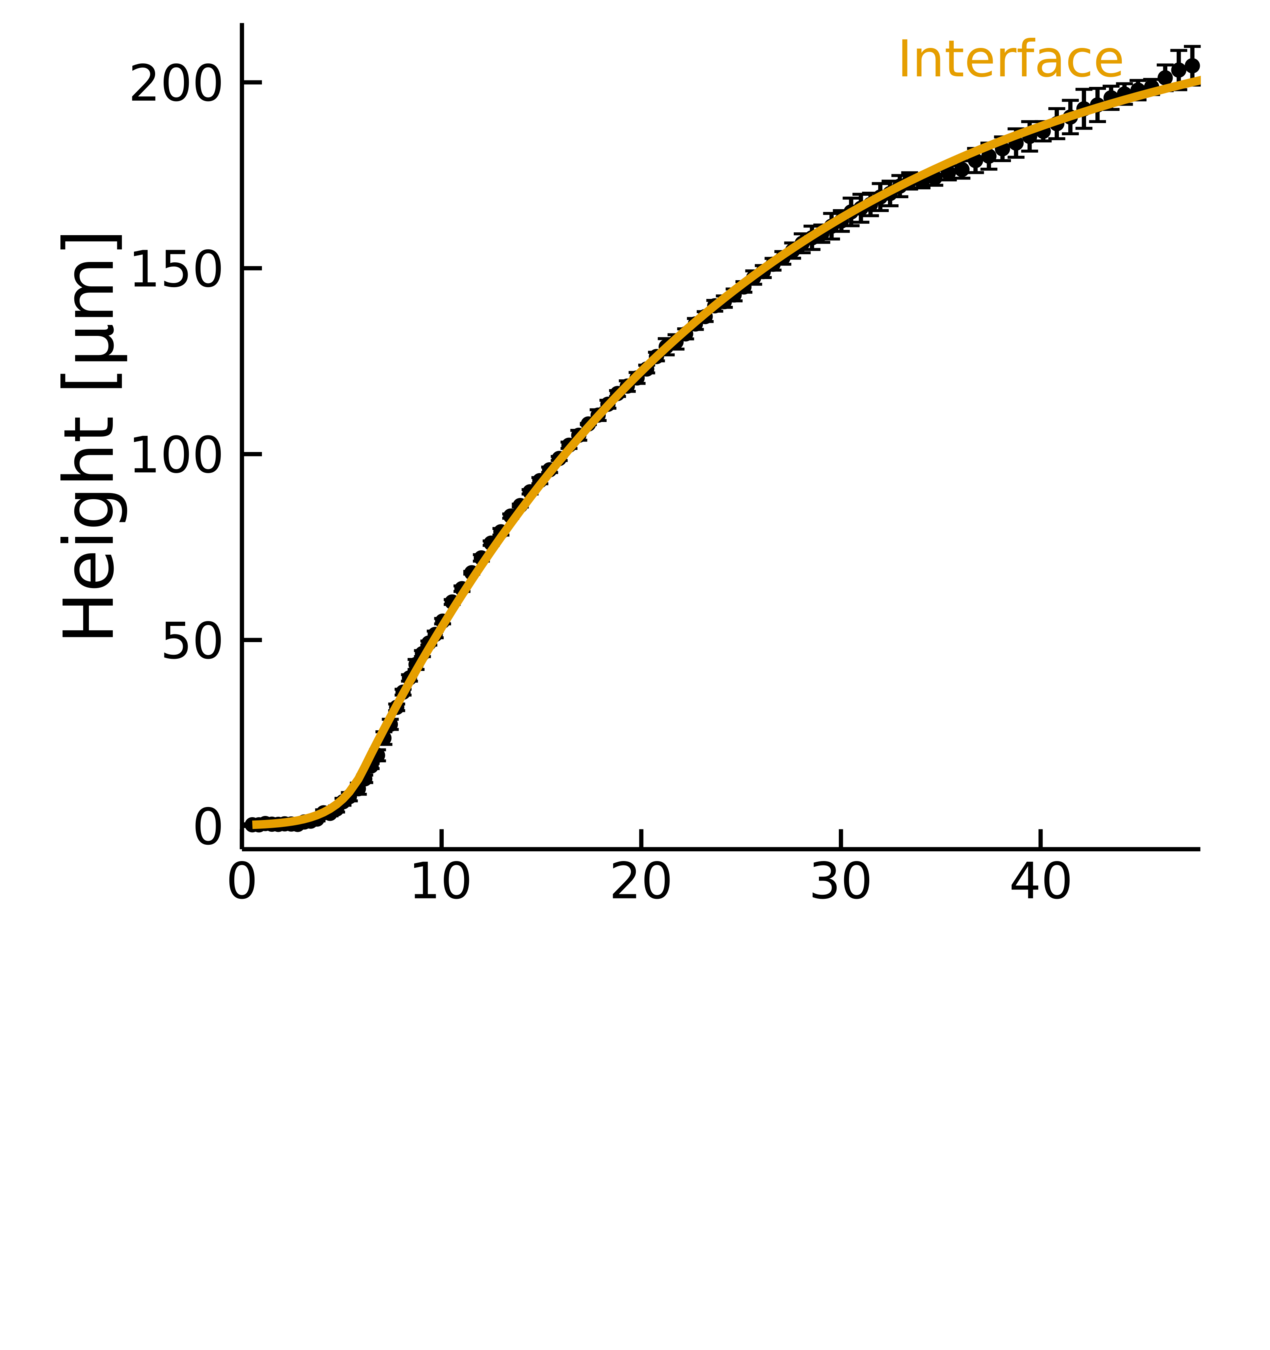
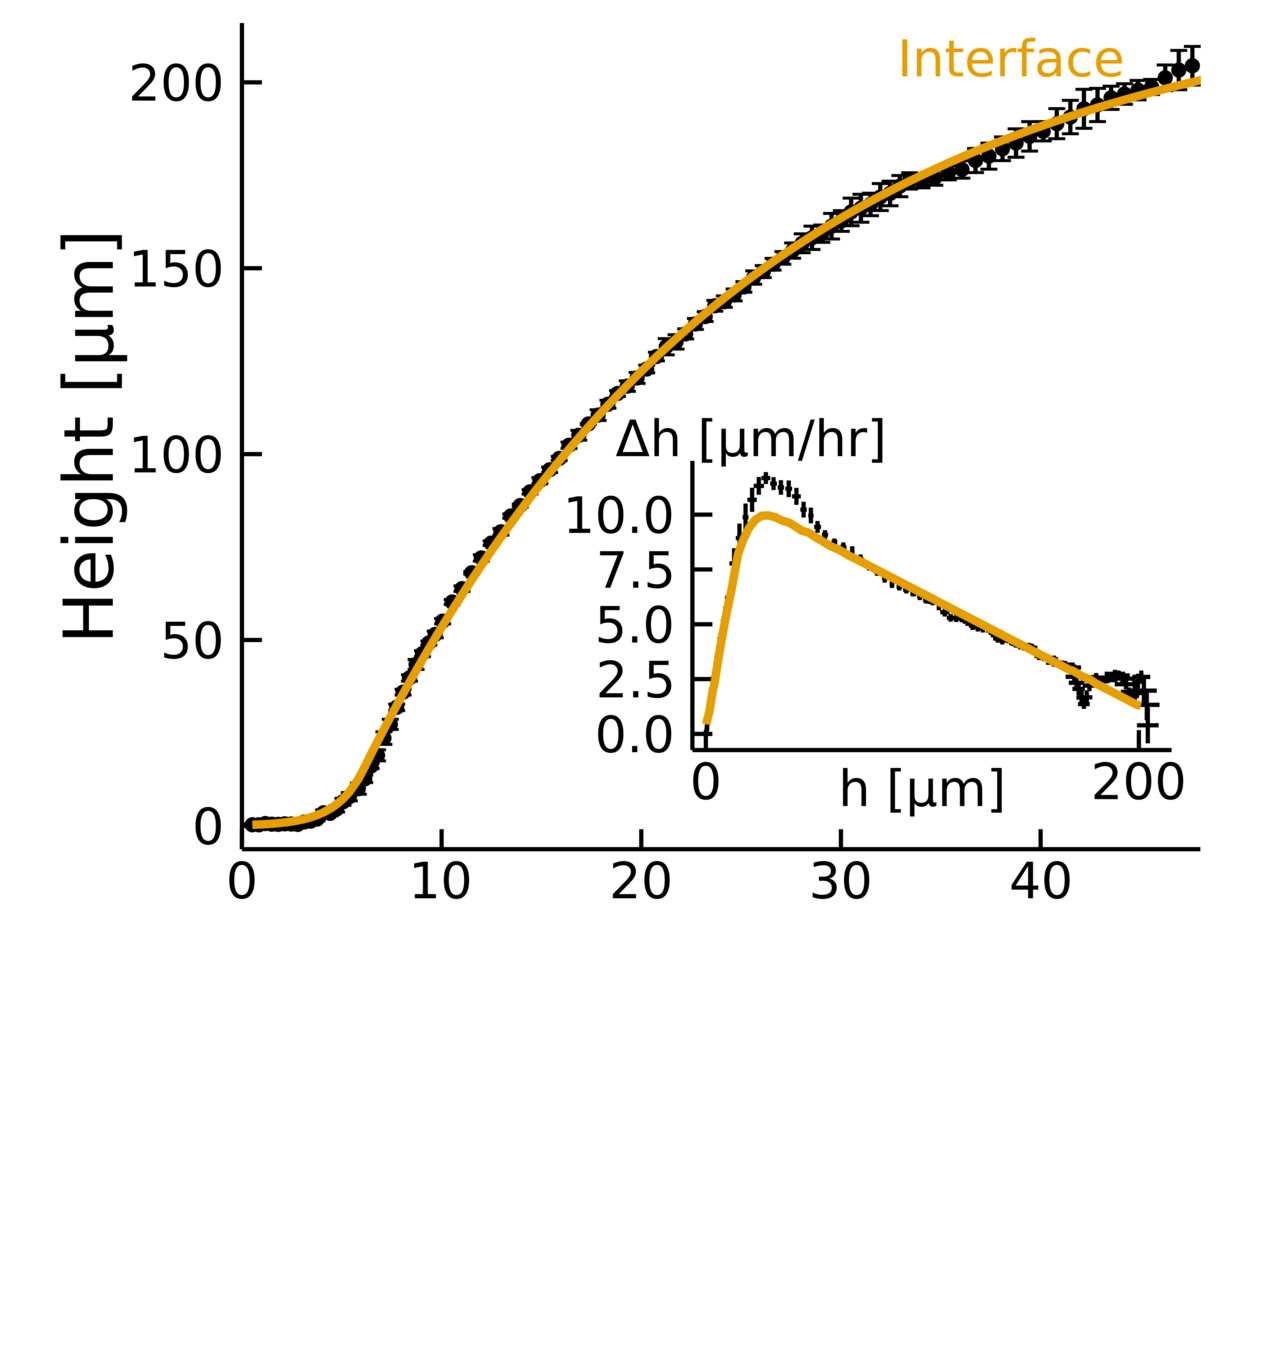
Interface
Cells
Horizontal Growth
Vertical
Growth
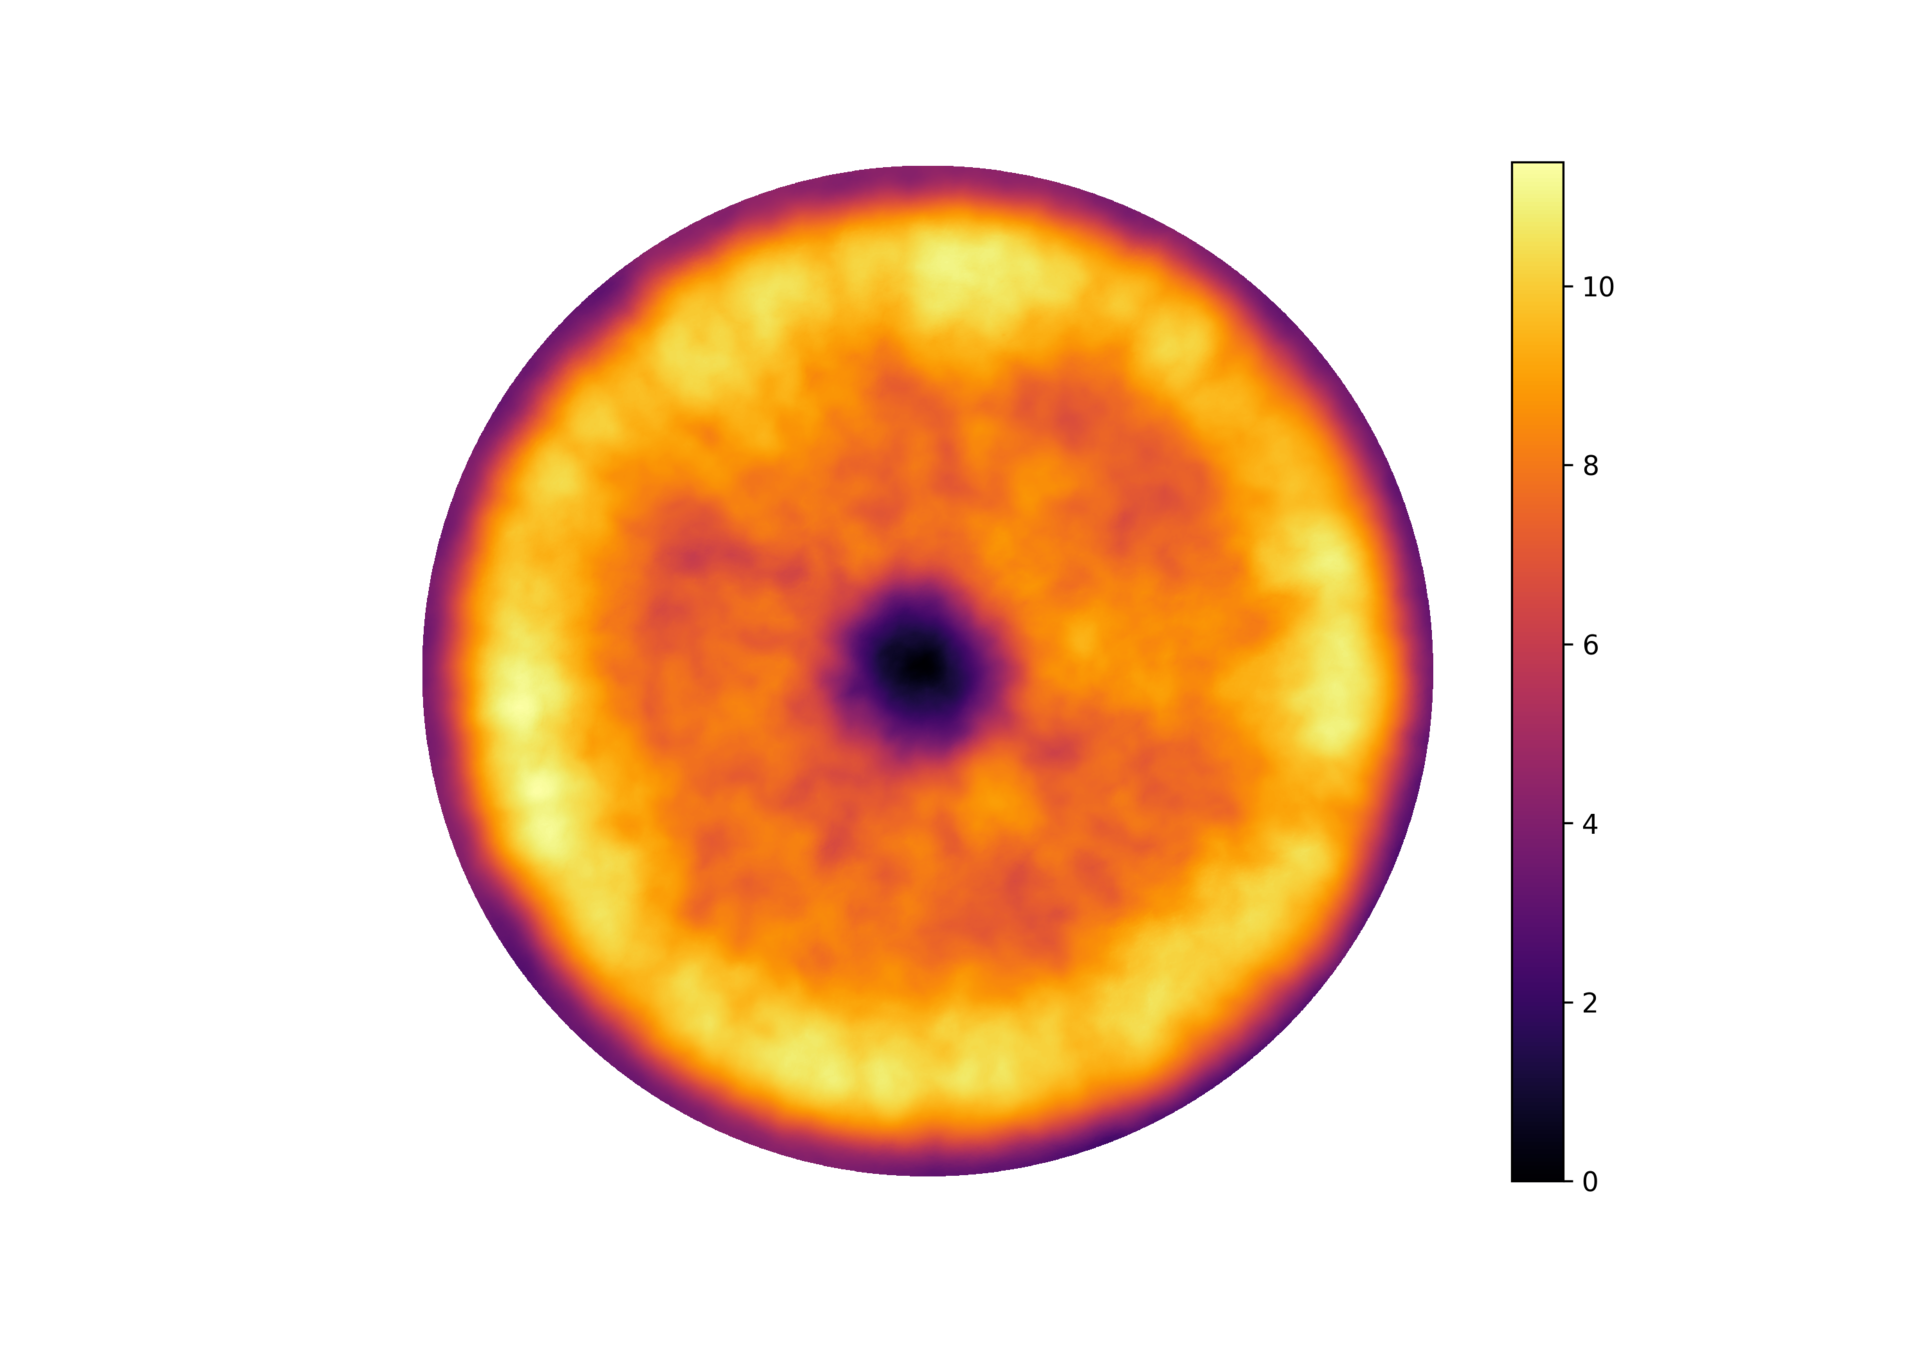
\( 0.5 mm\)
0
2
4
6
8
10
\(\Delta z\) (\( \mu m\))
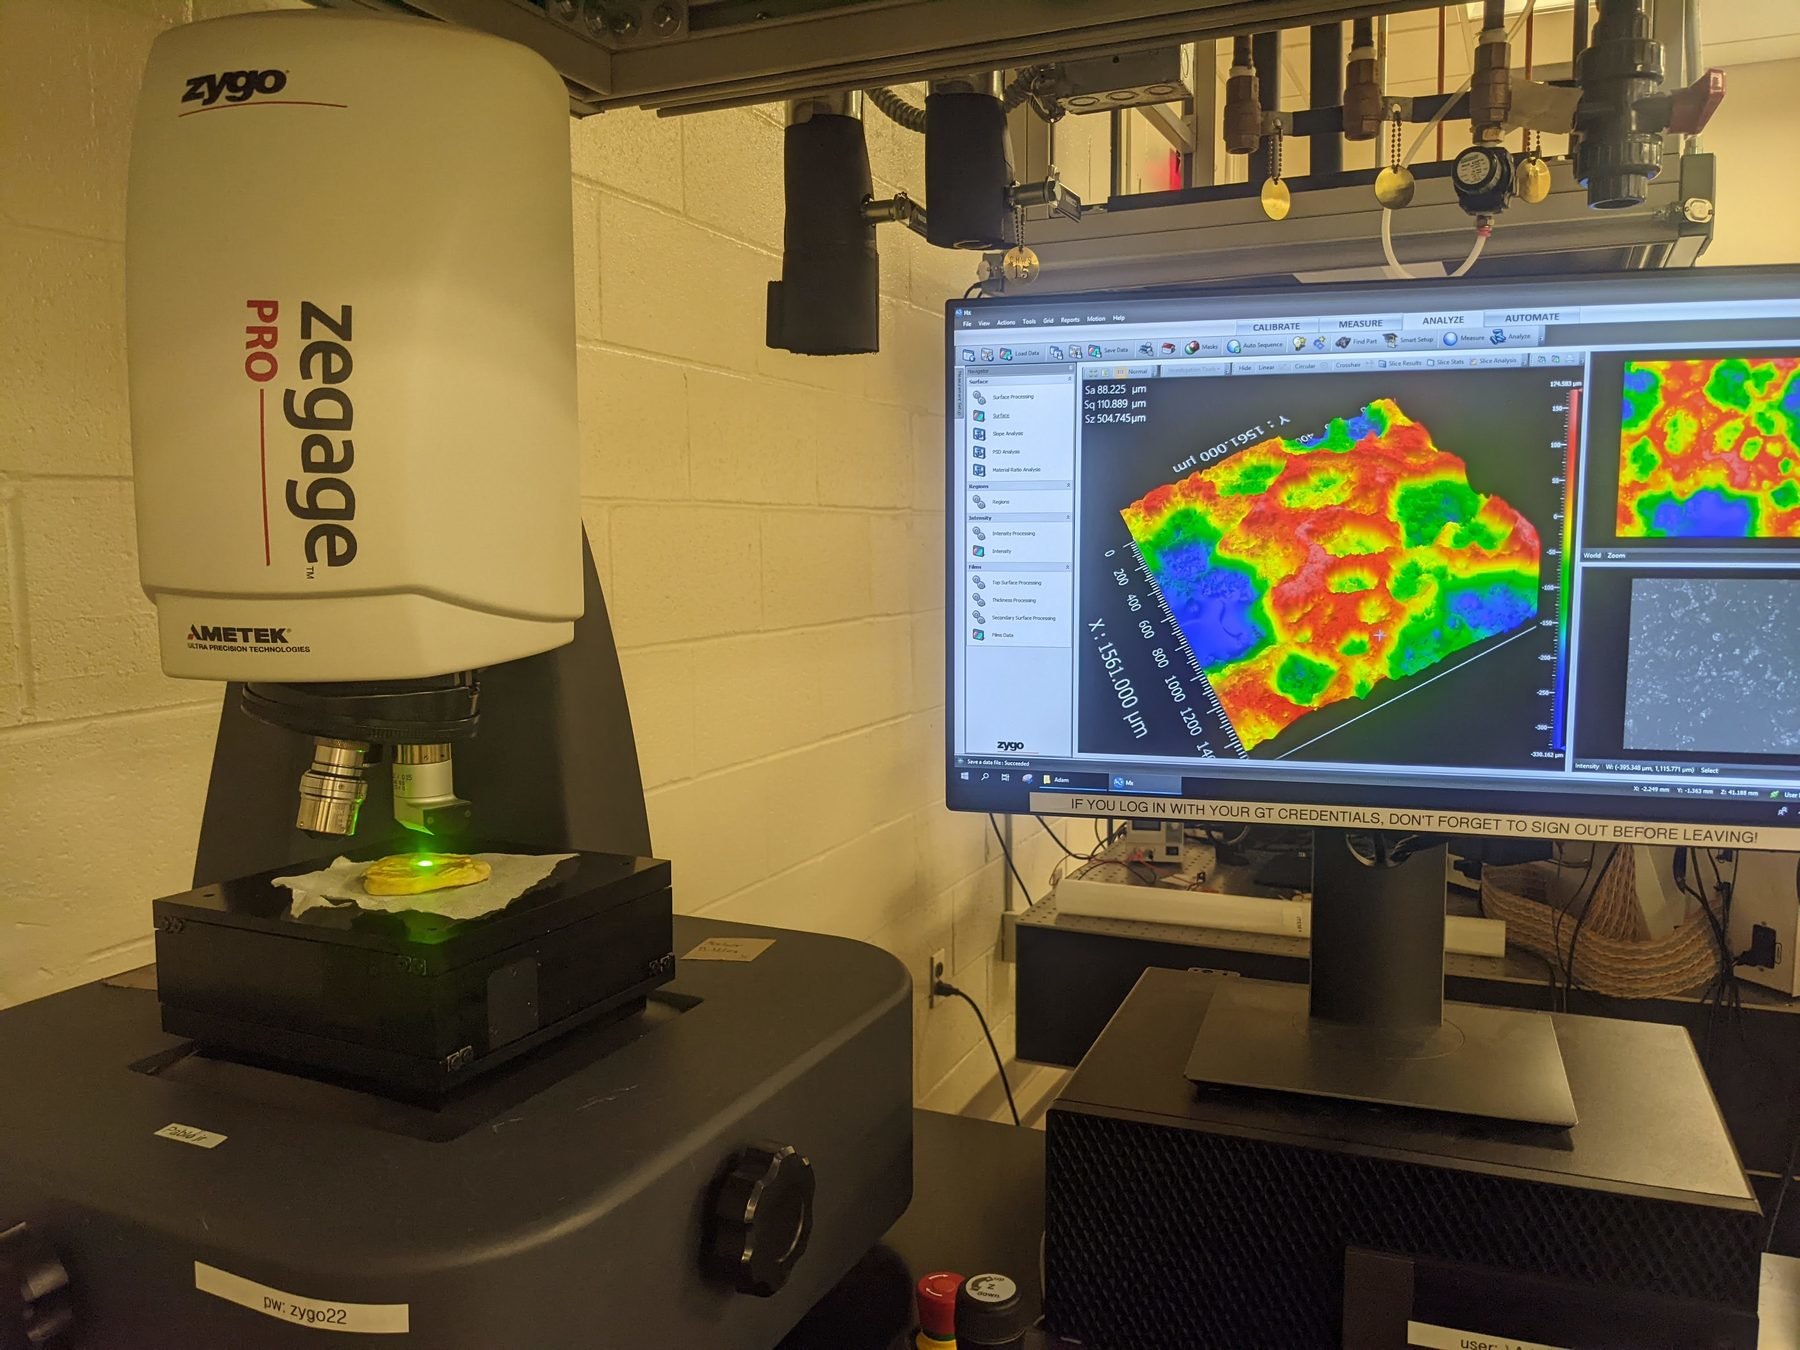
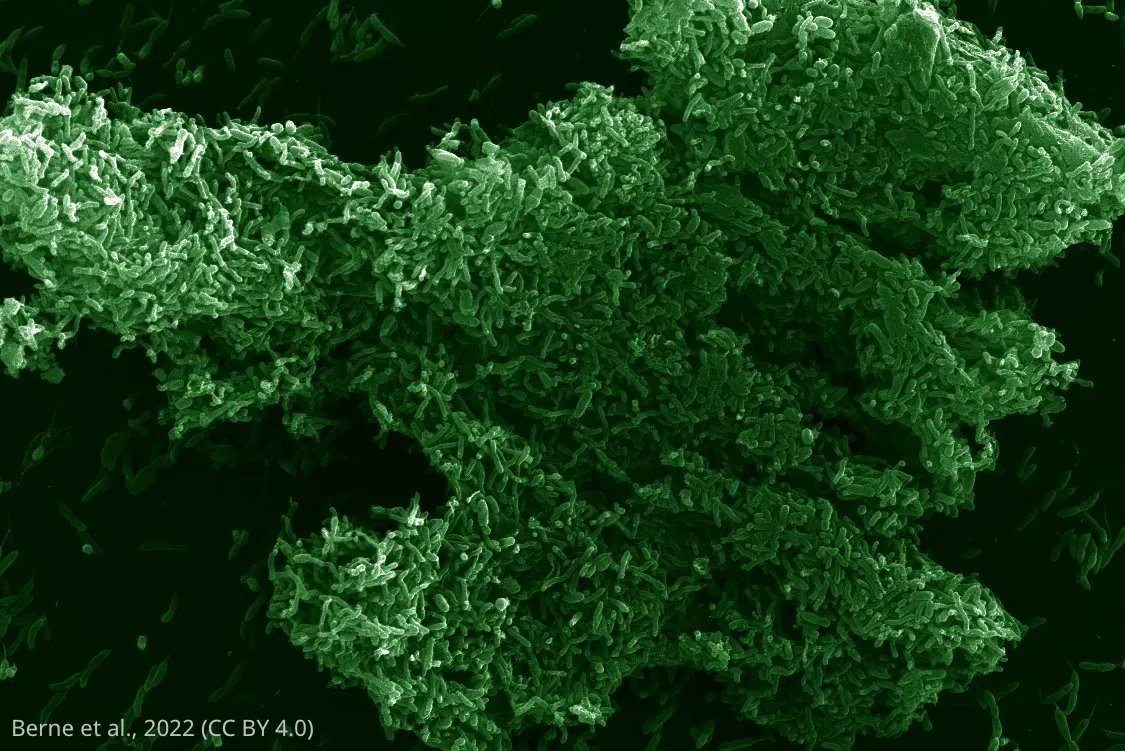
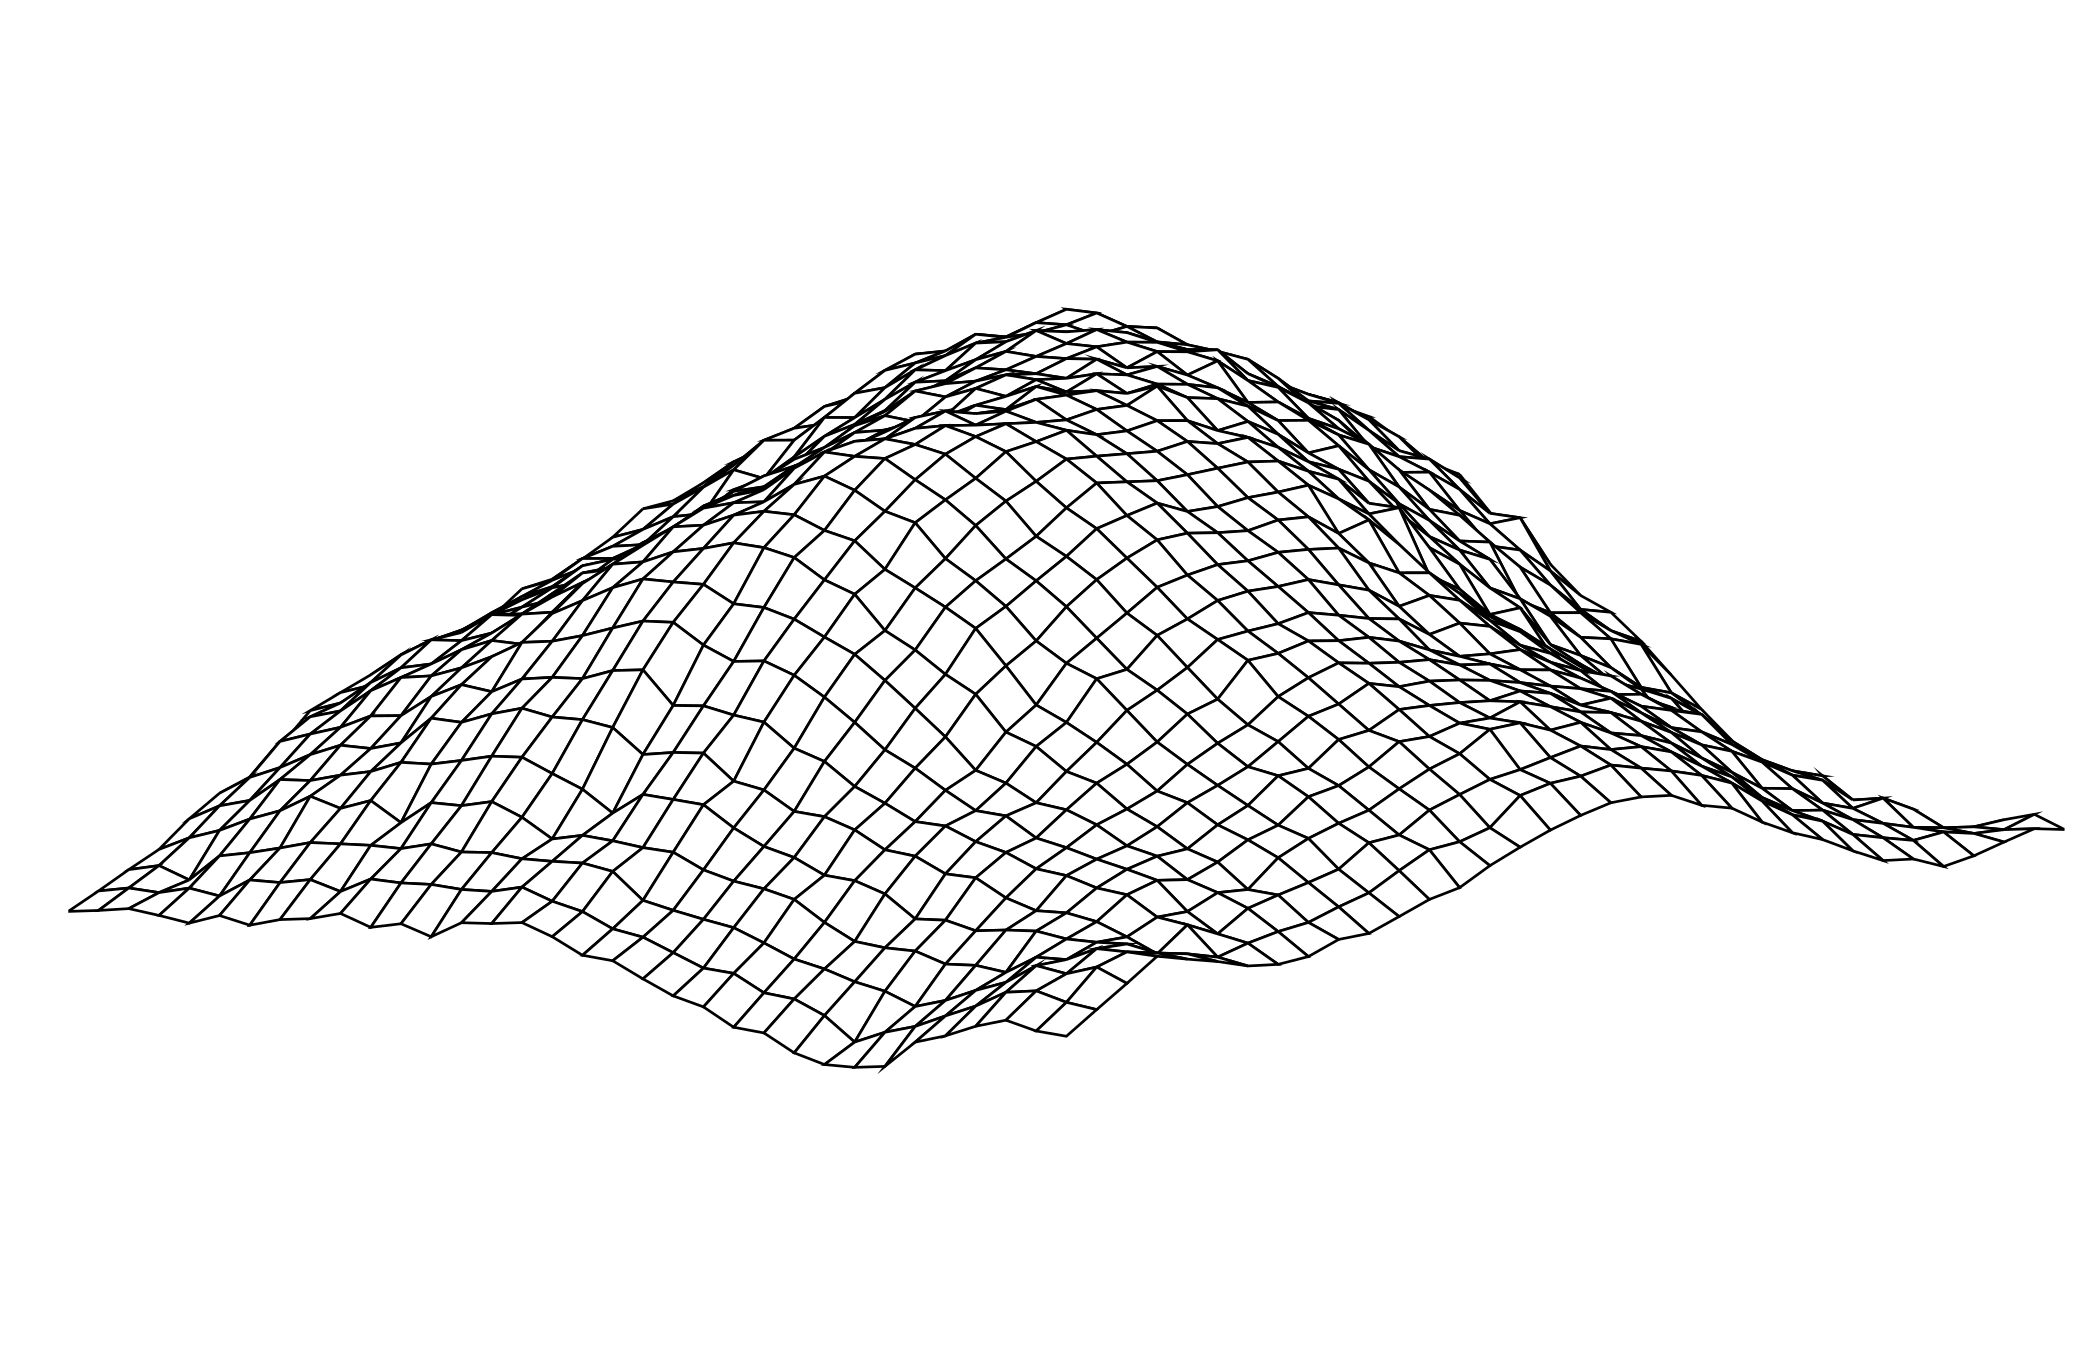
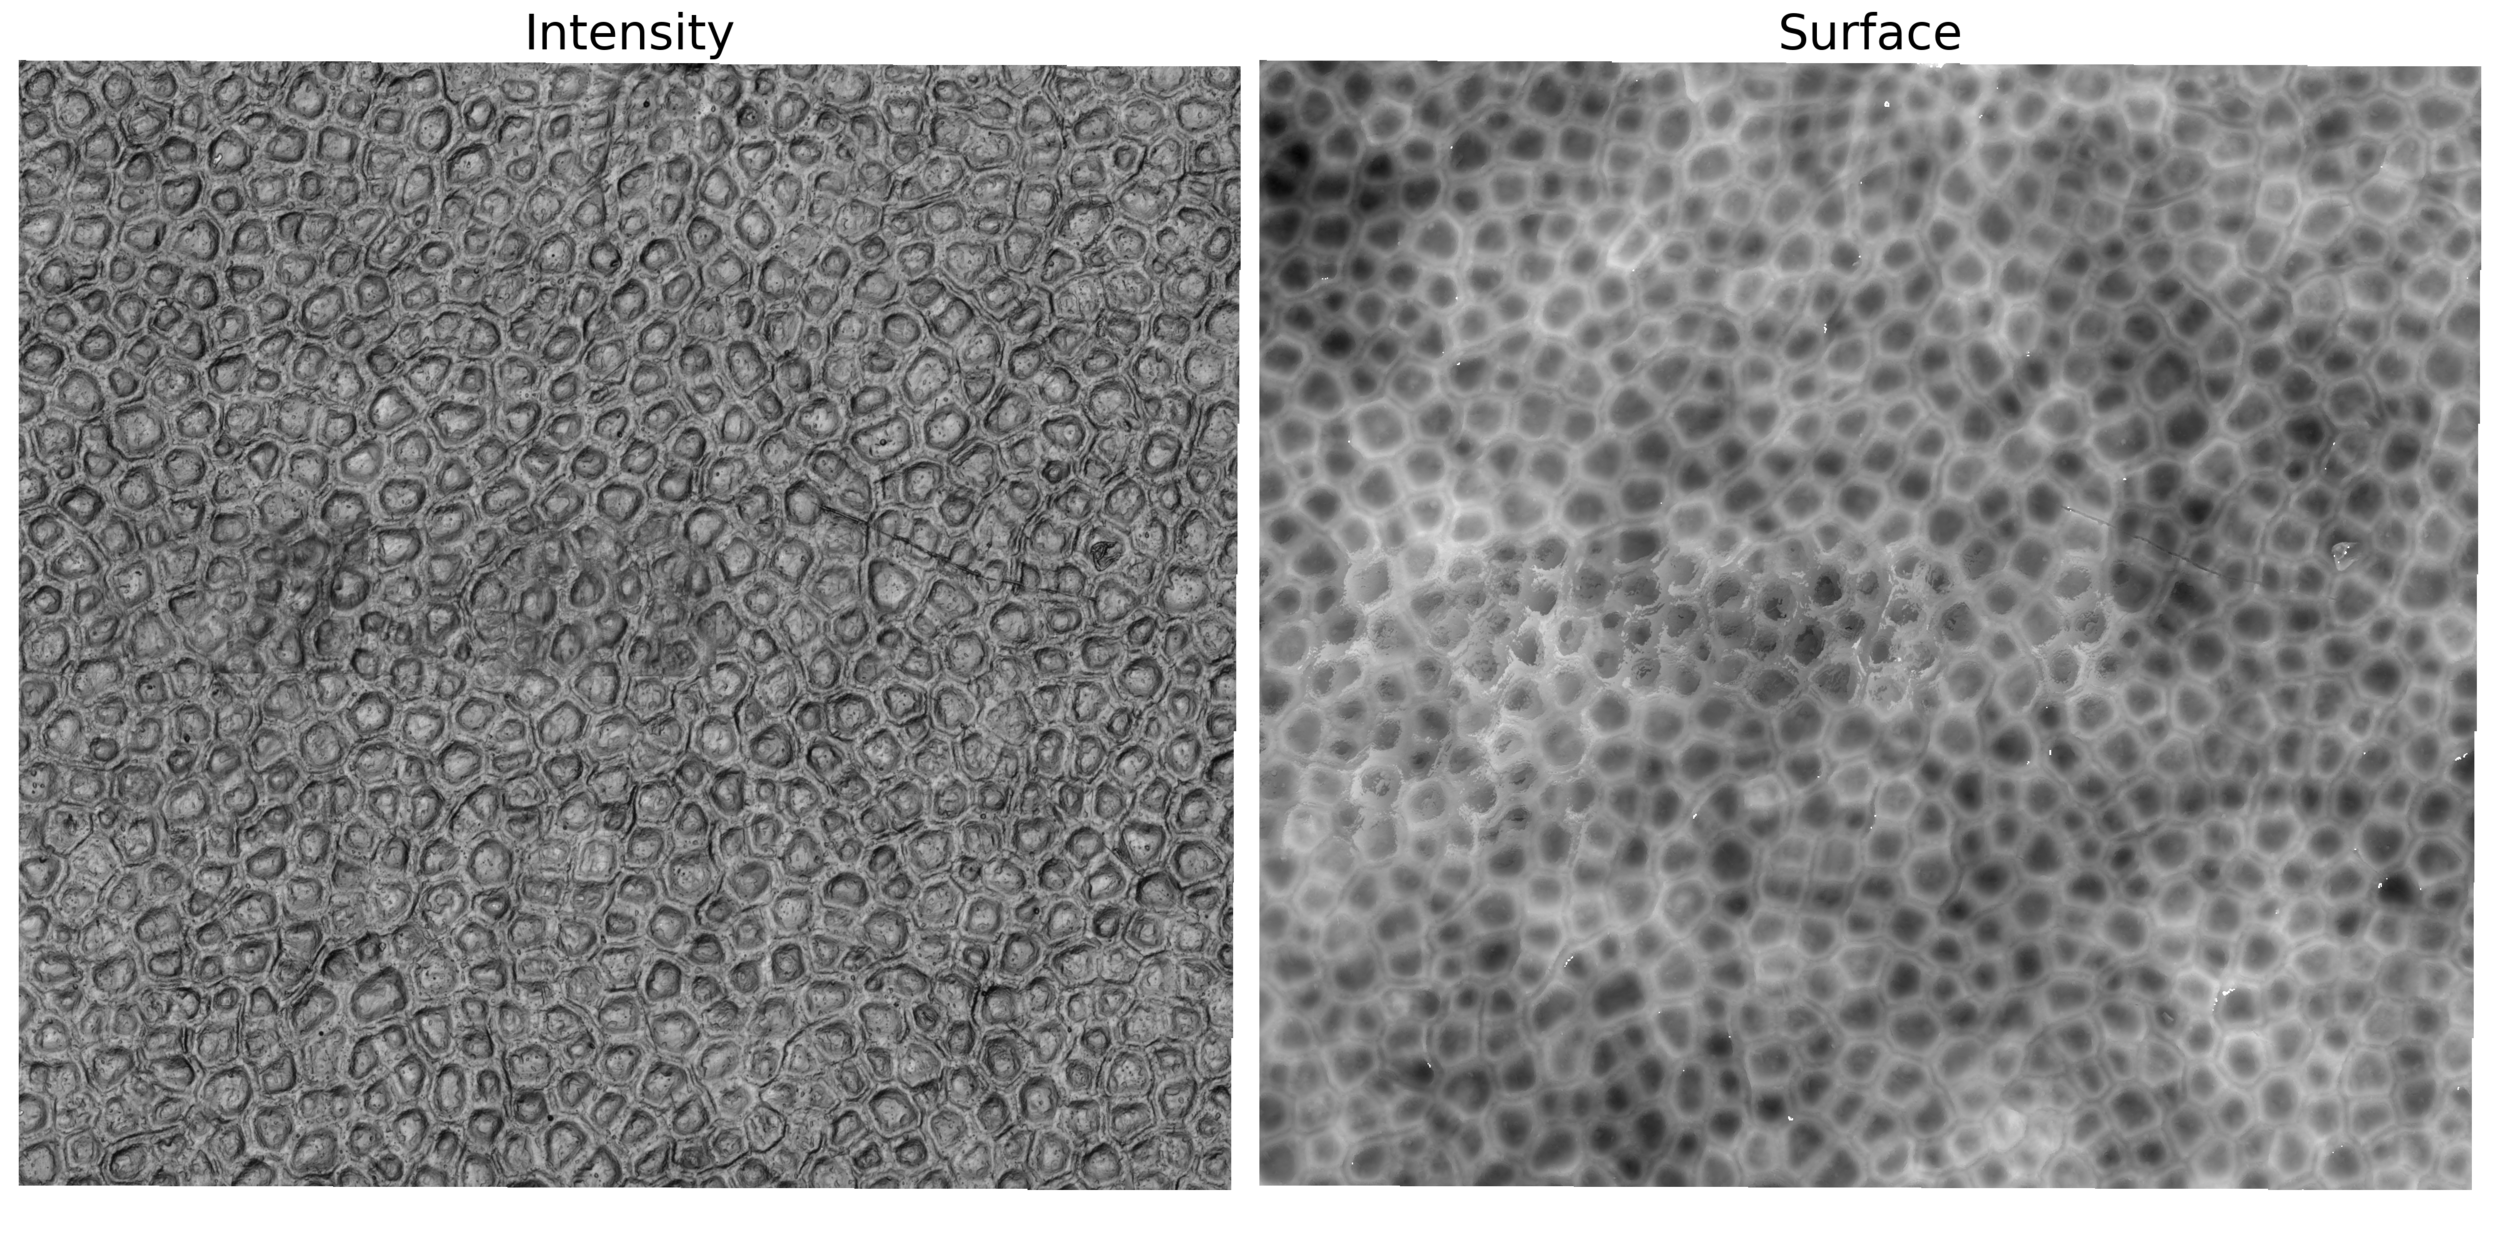
Central region of a vibrio cholerae biofilm
Surface topography + intensity!
Homeland
Agar
Coffee Ring
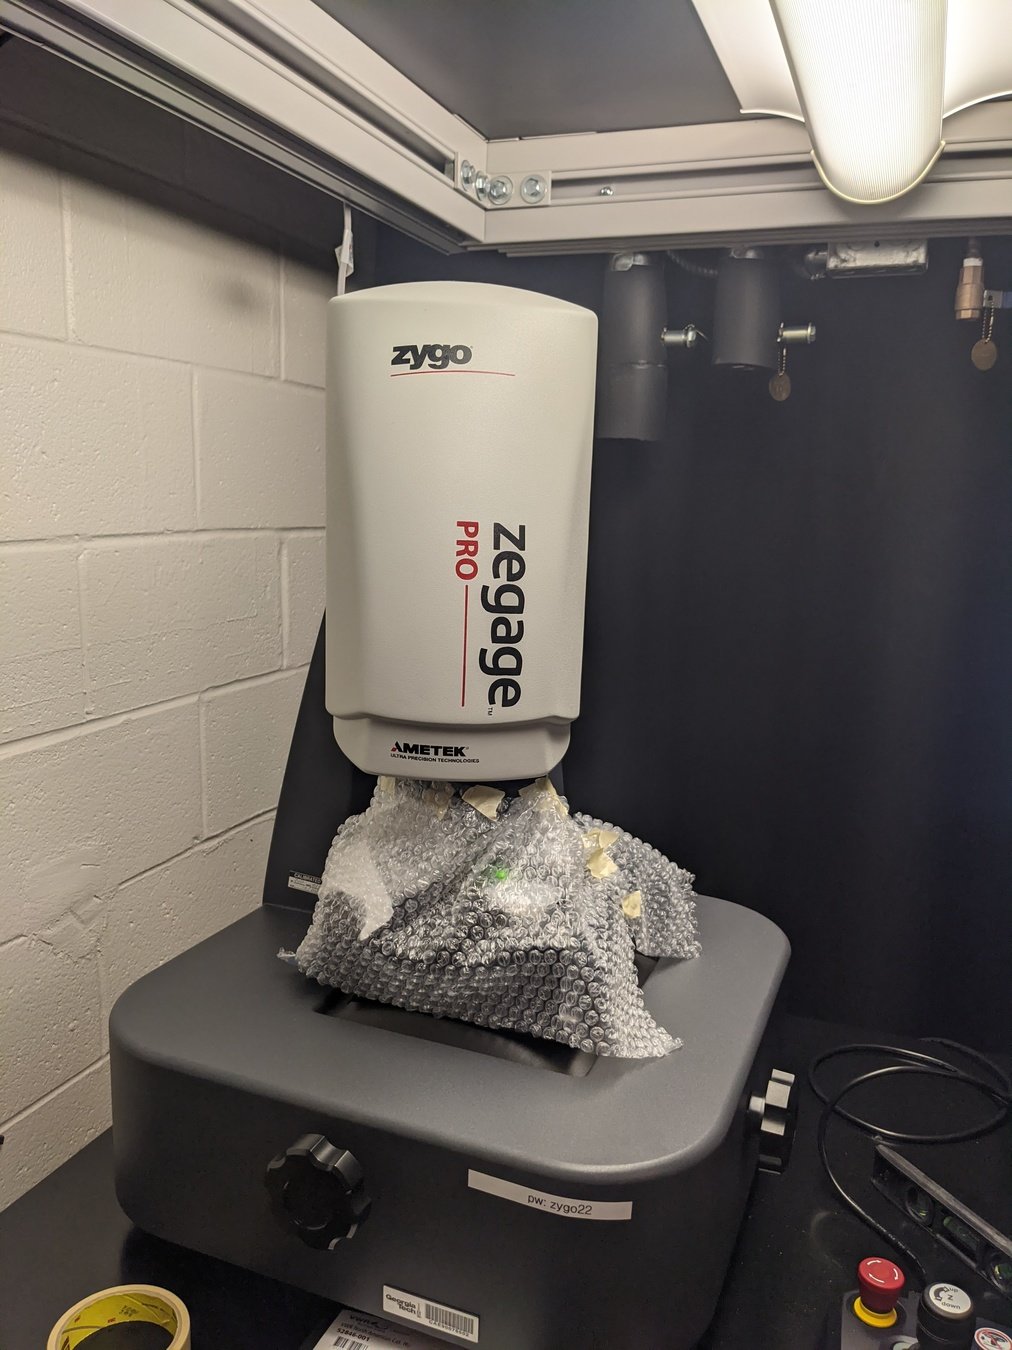
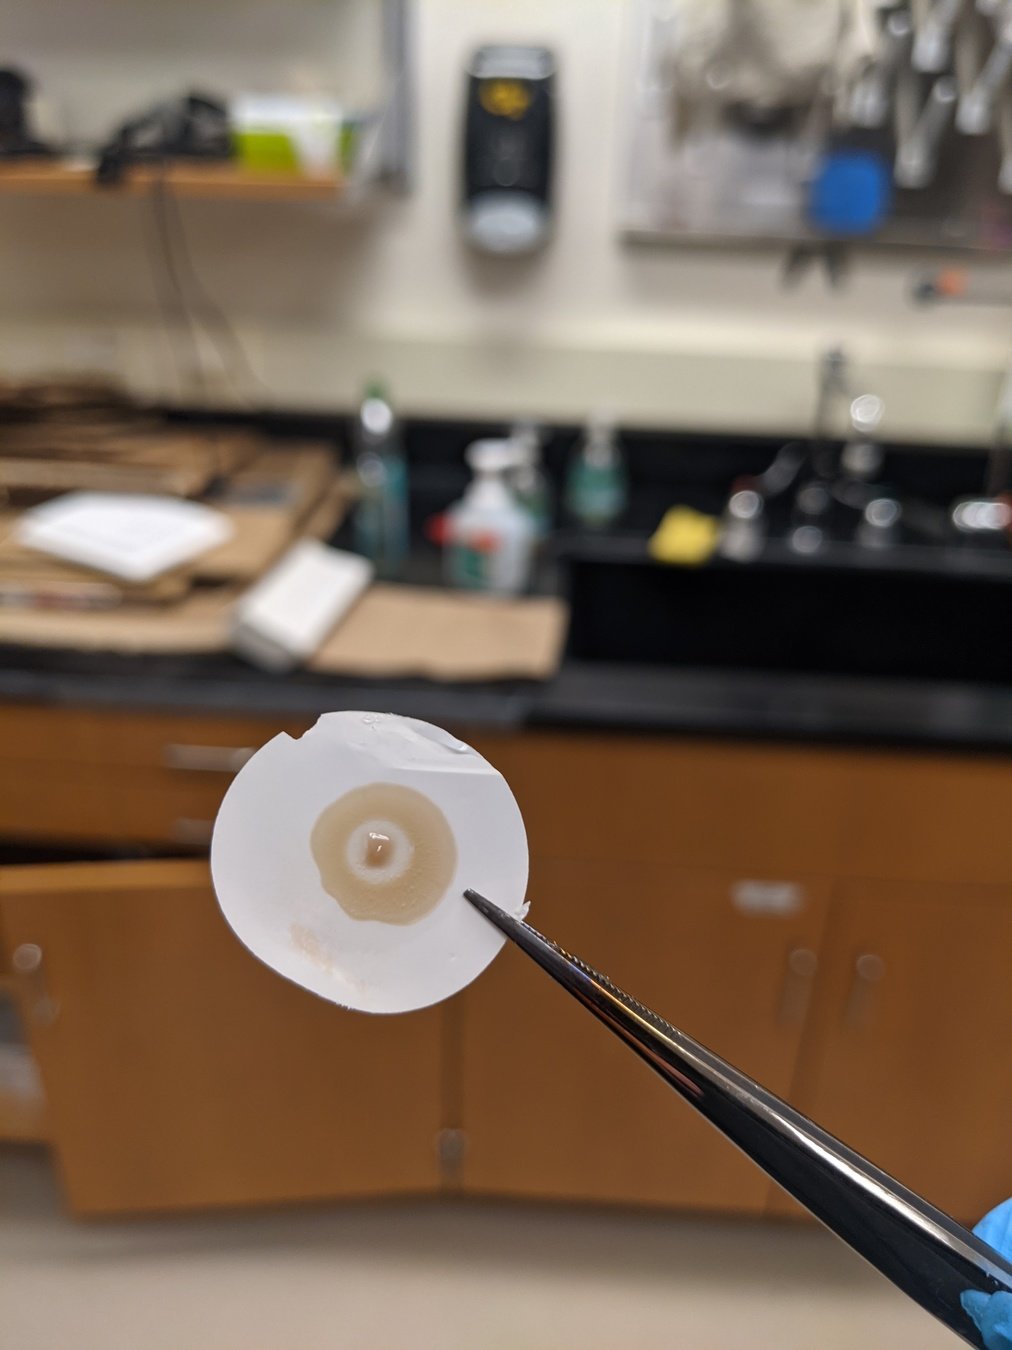
Things didn't go quite well the first ~10 attempts
Hours
0
48
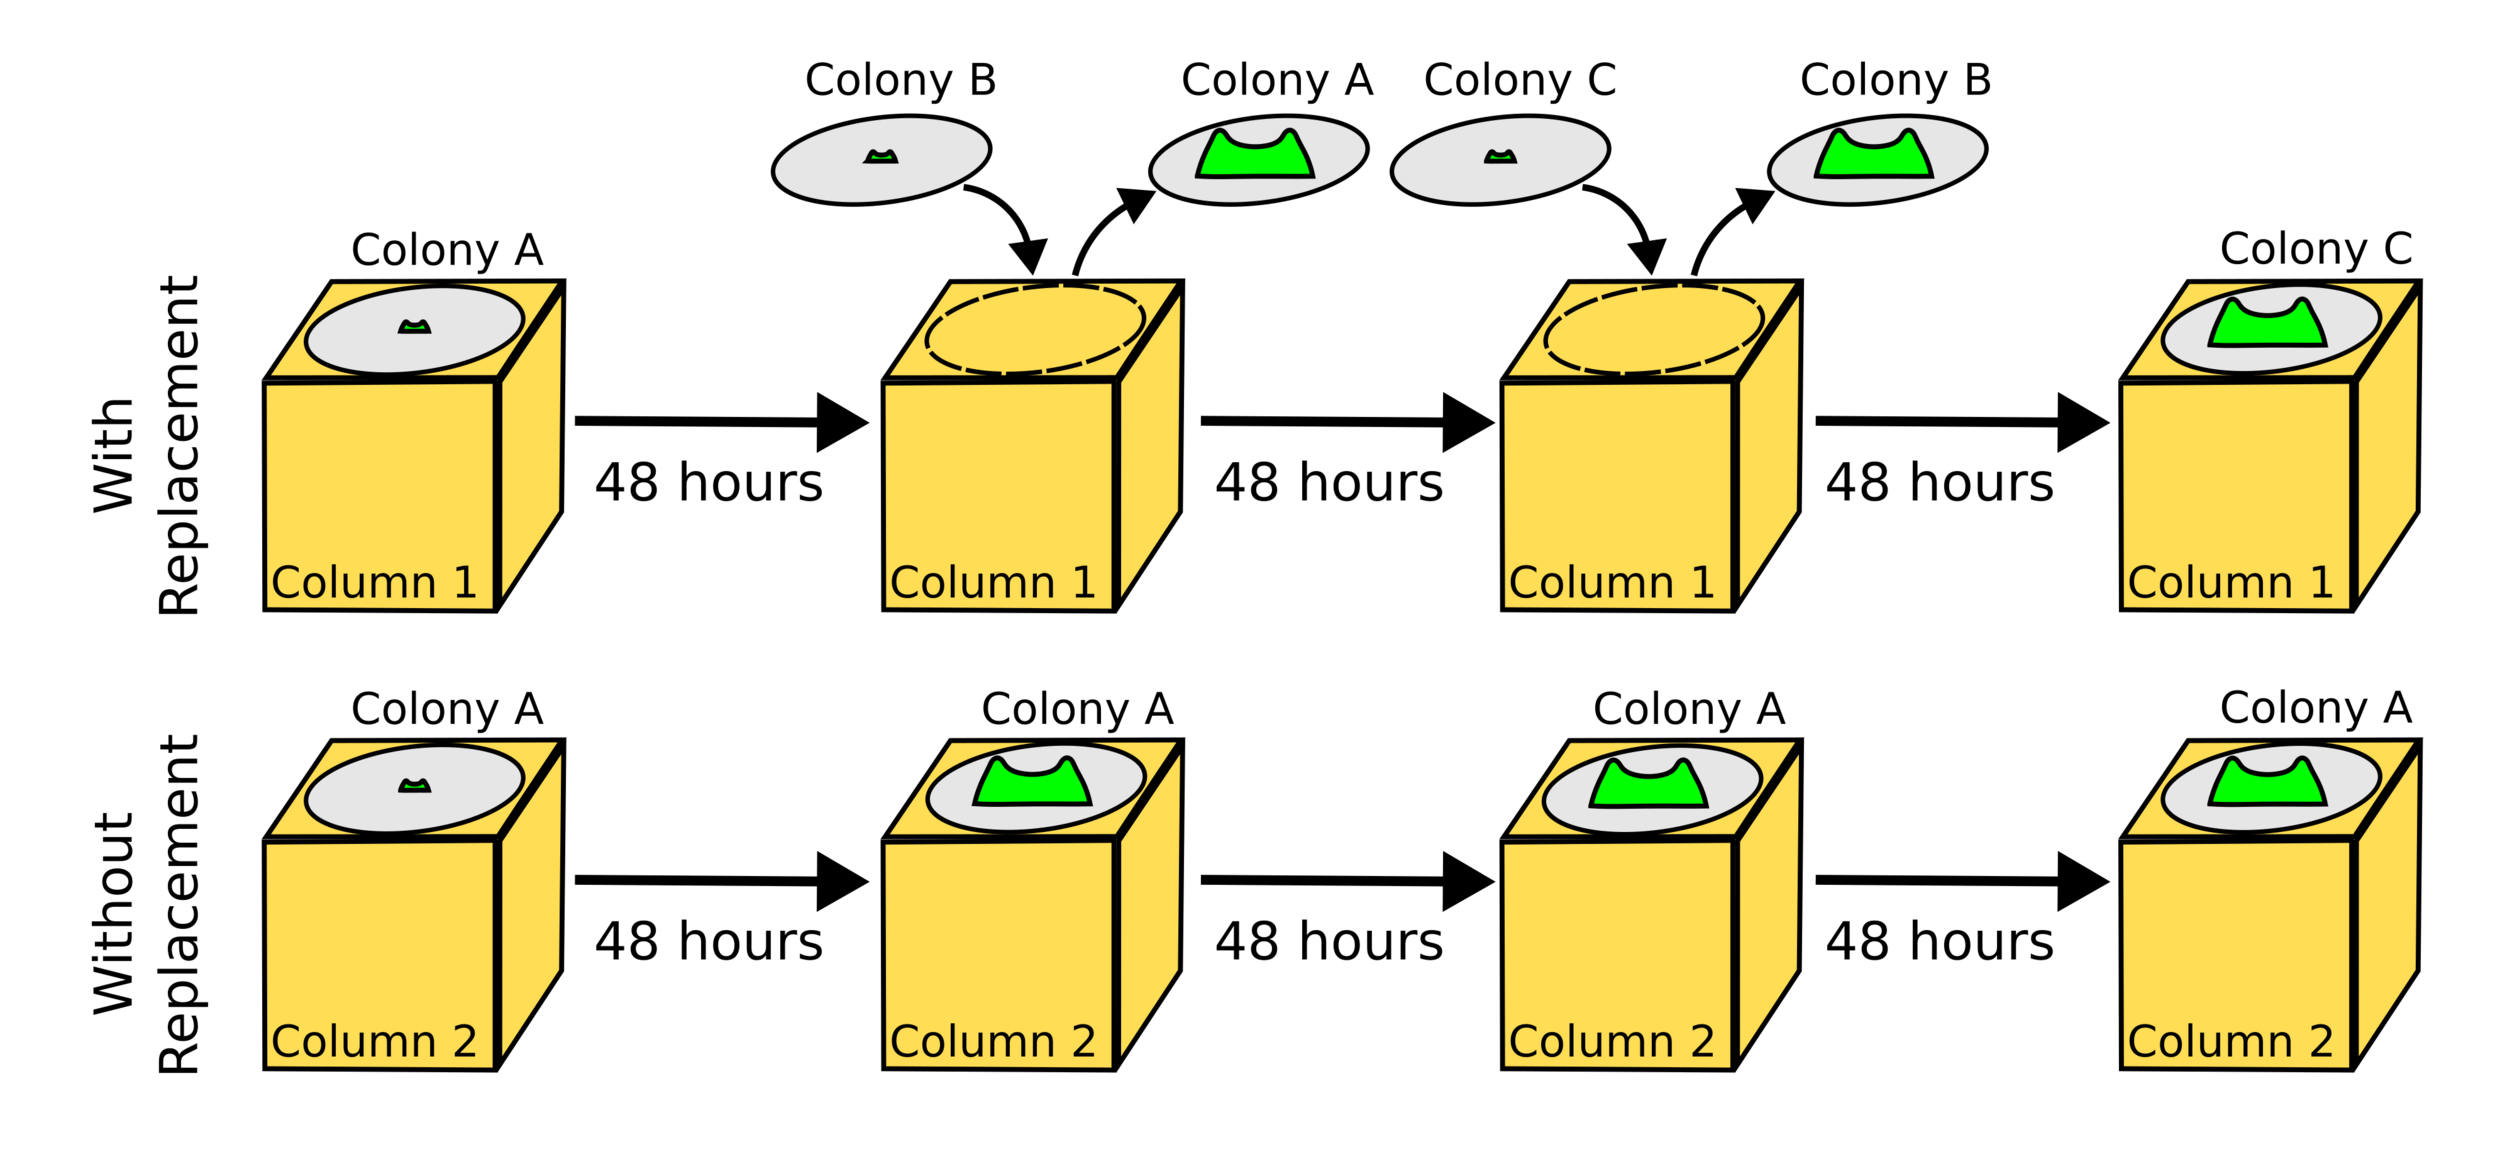
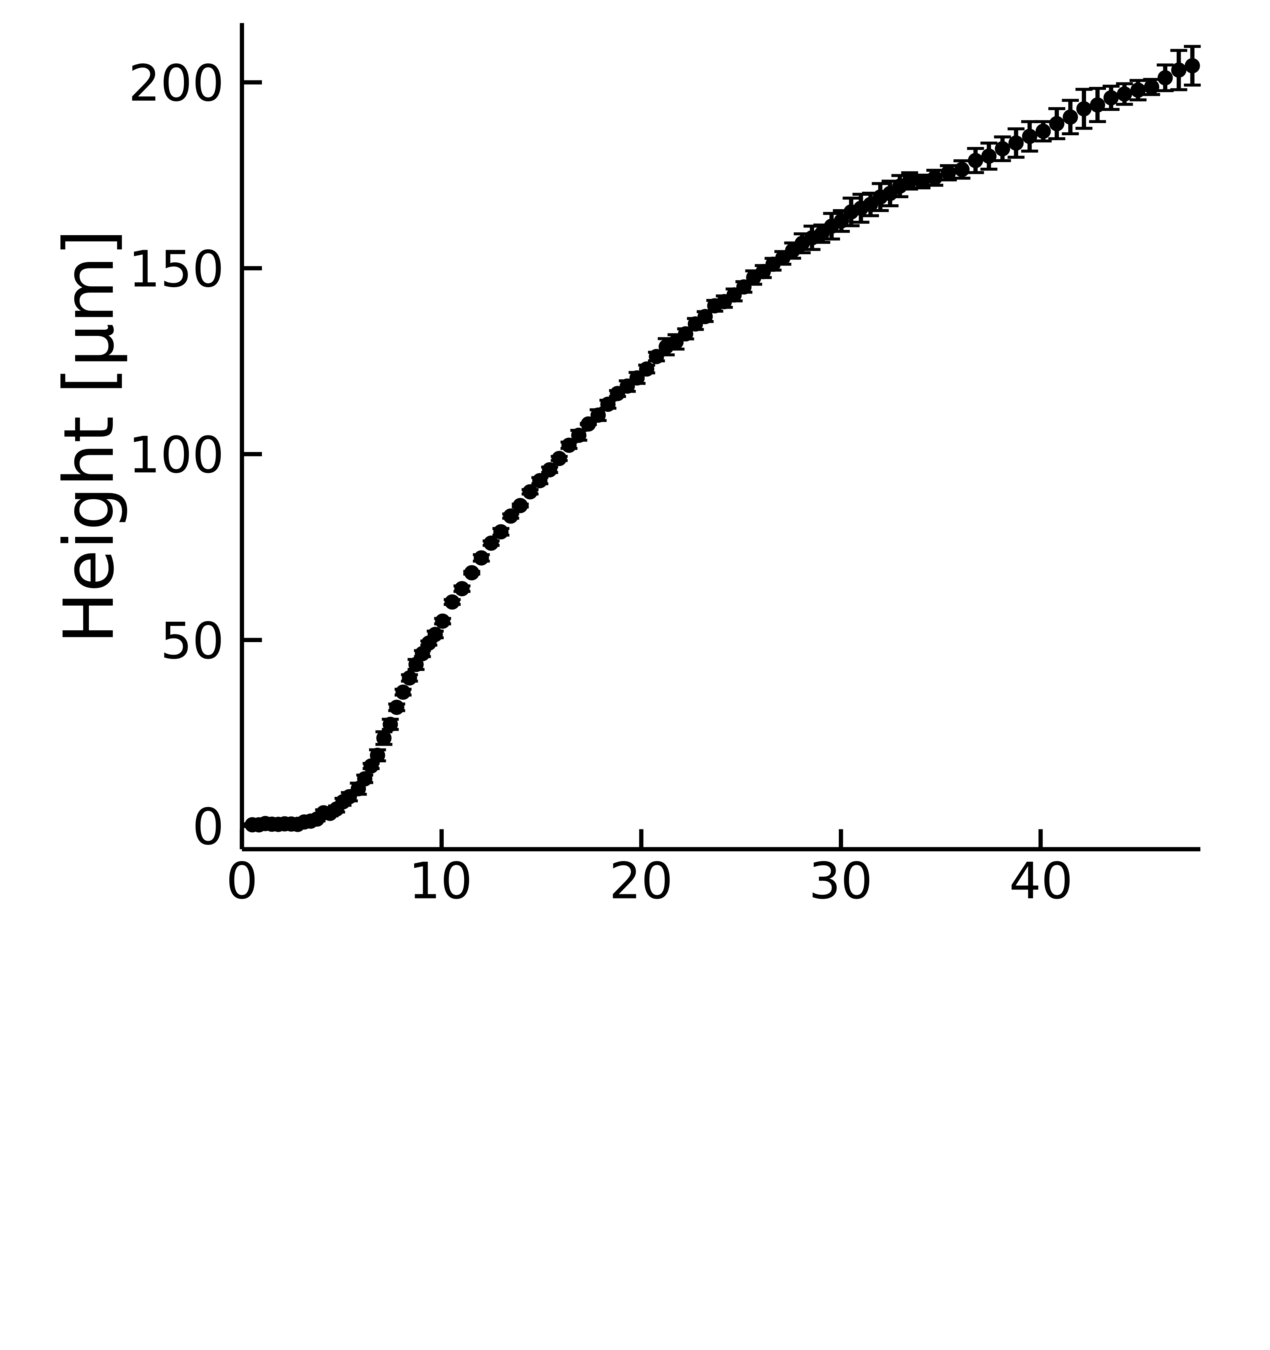
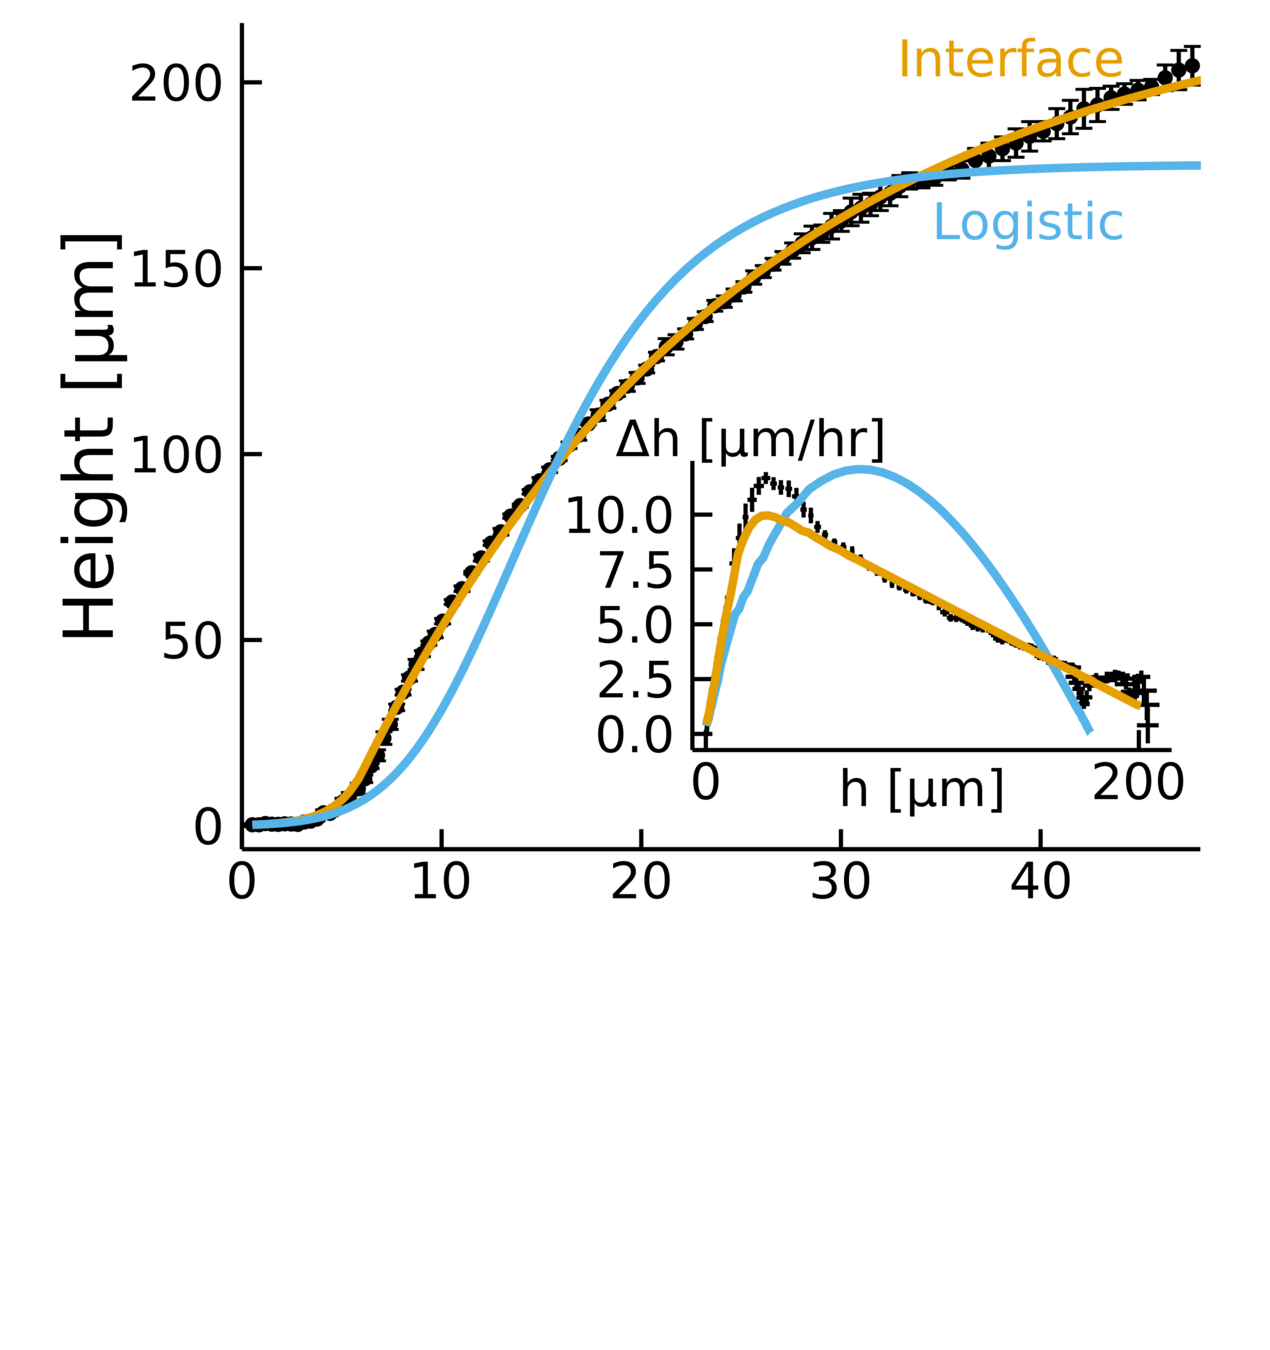
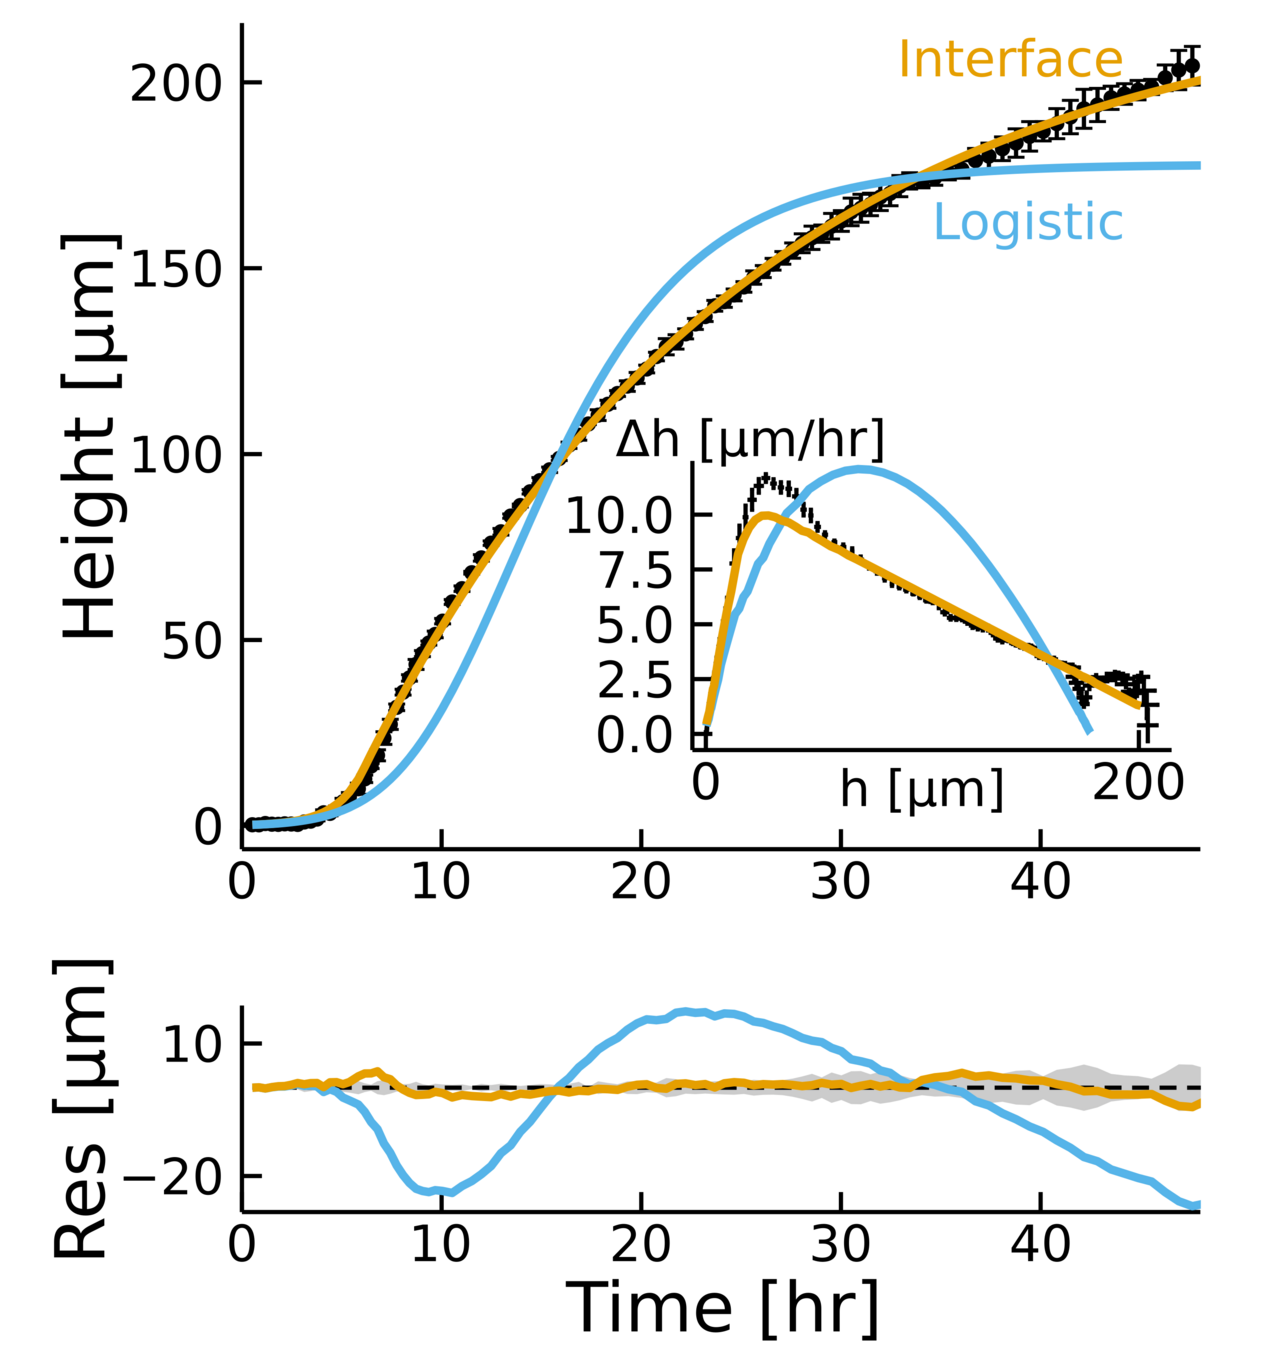
Two regimes in which vertical growth depends with the height of the colony
linearly
Agar is not running out of nutrients!
Colonies must be slowing down for a different reason
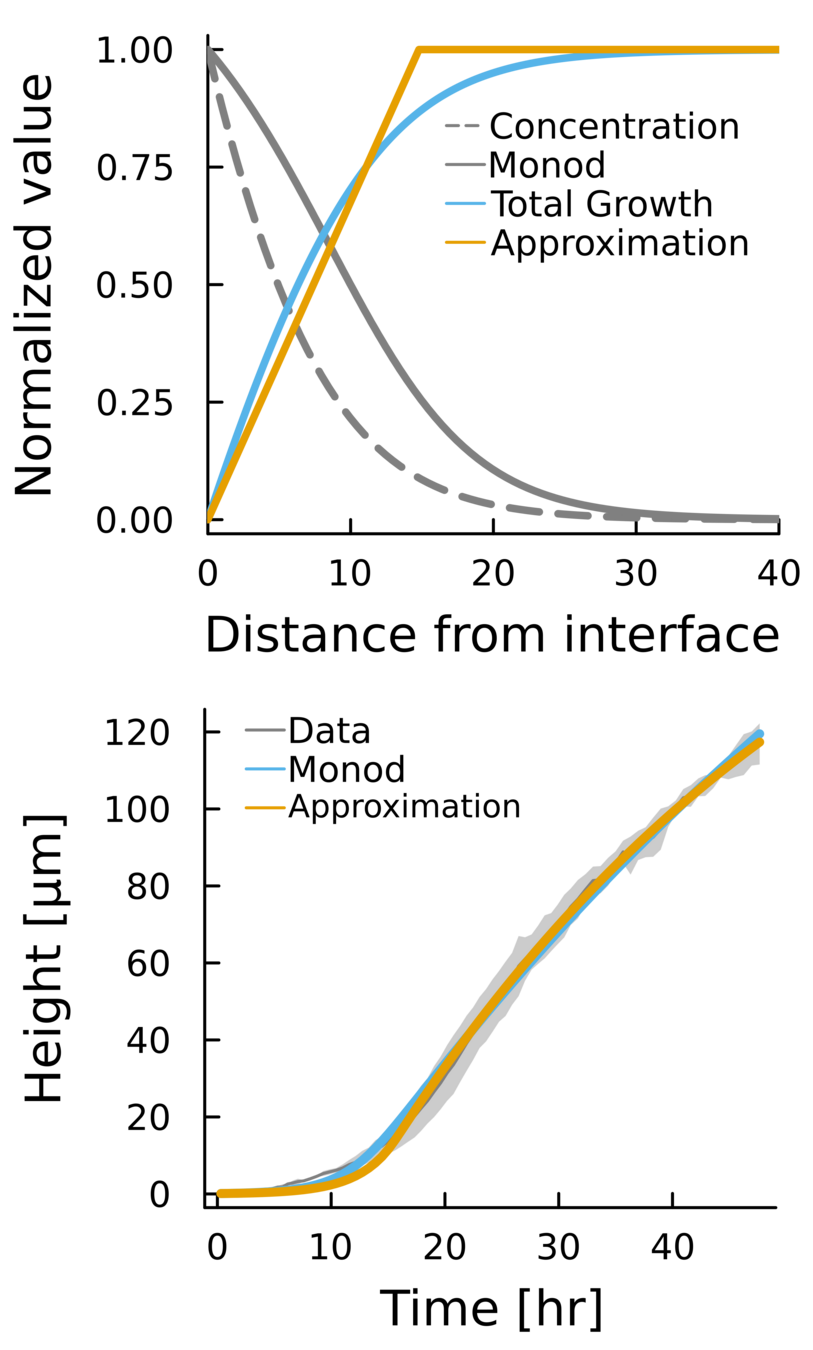
\(z\)
Diffusion constant
Consumption rate
Monod constant
Concentration in the substrate
No flux in the top
Region where cells can grow is finite
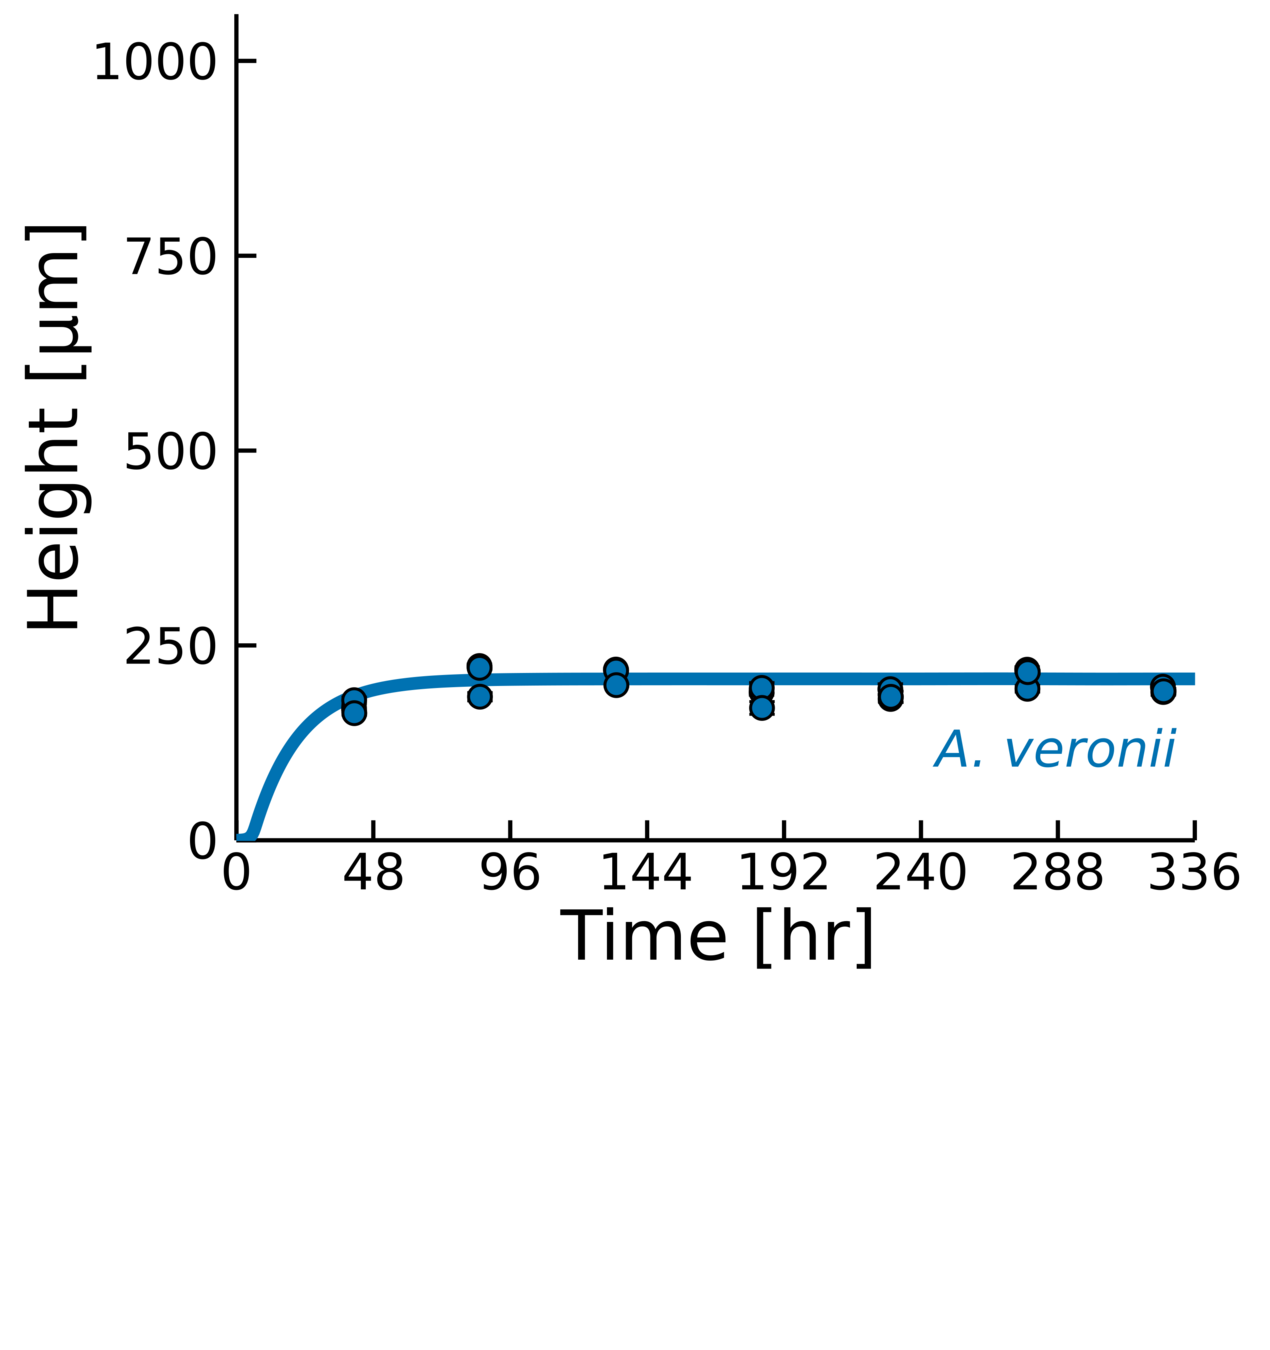
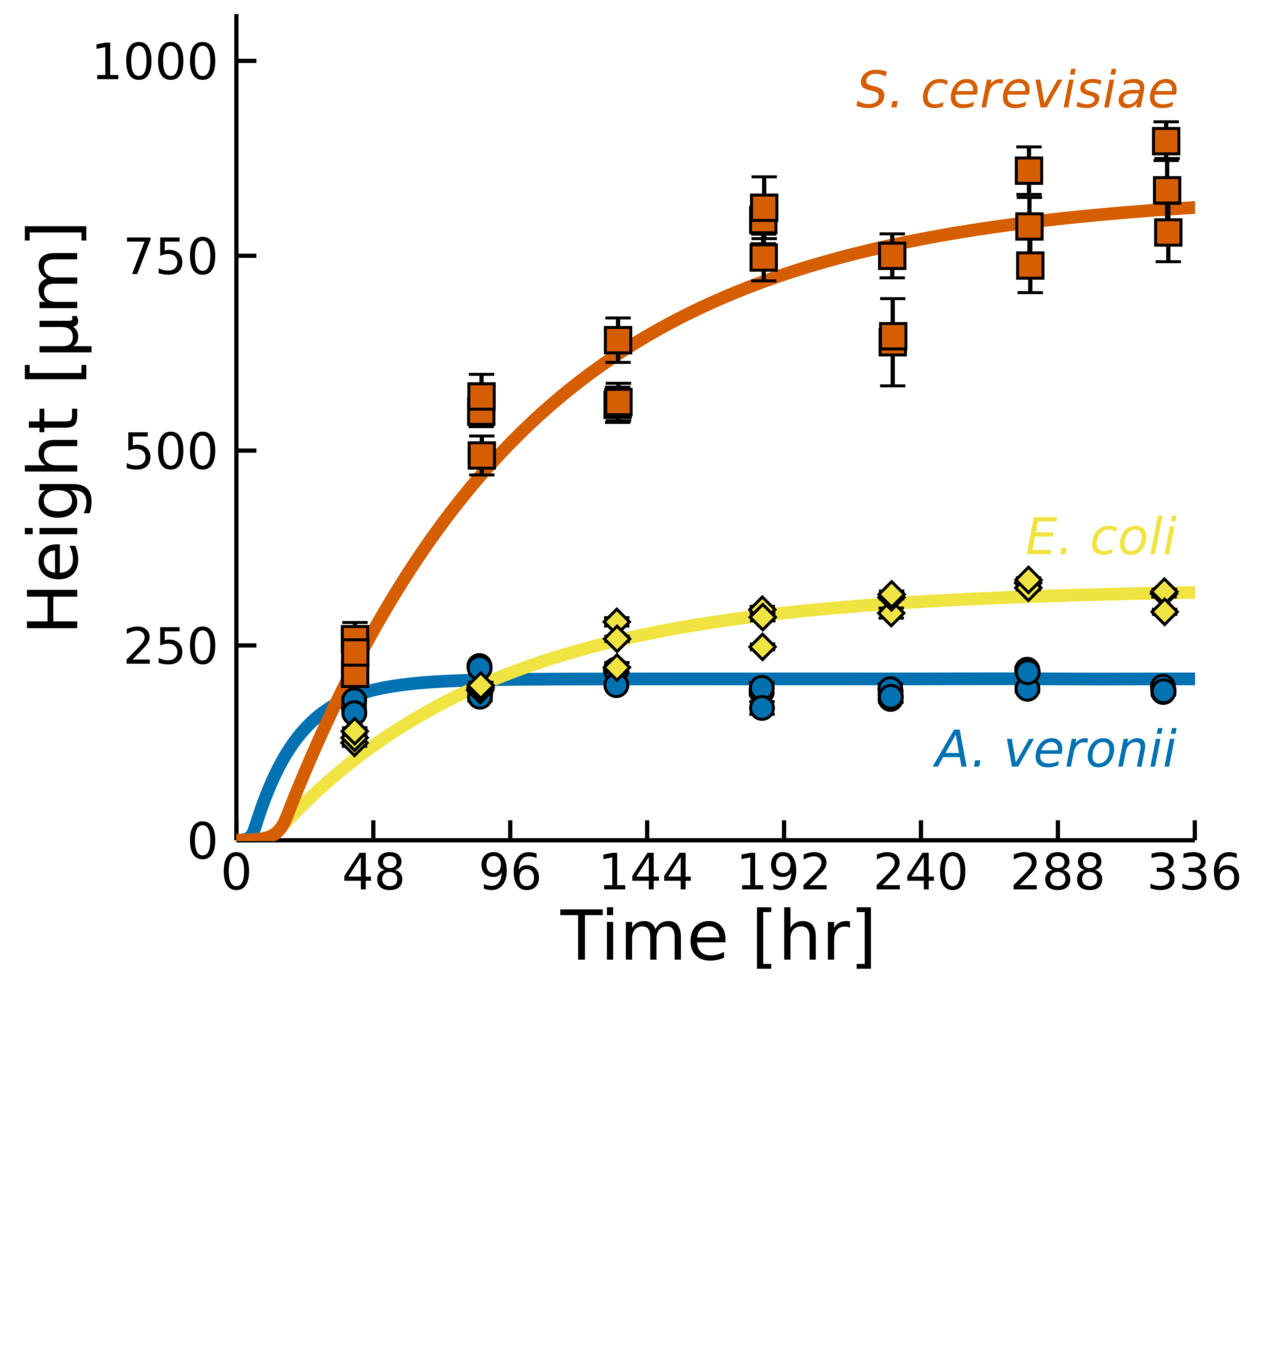
of a colony saturates once they reach a critical length \(L\)
Total growth
Empirical data + biophysical insight:
Growth rate
Decay rate
Diffusion length
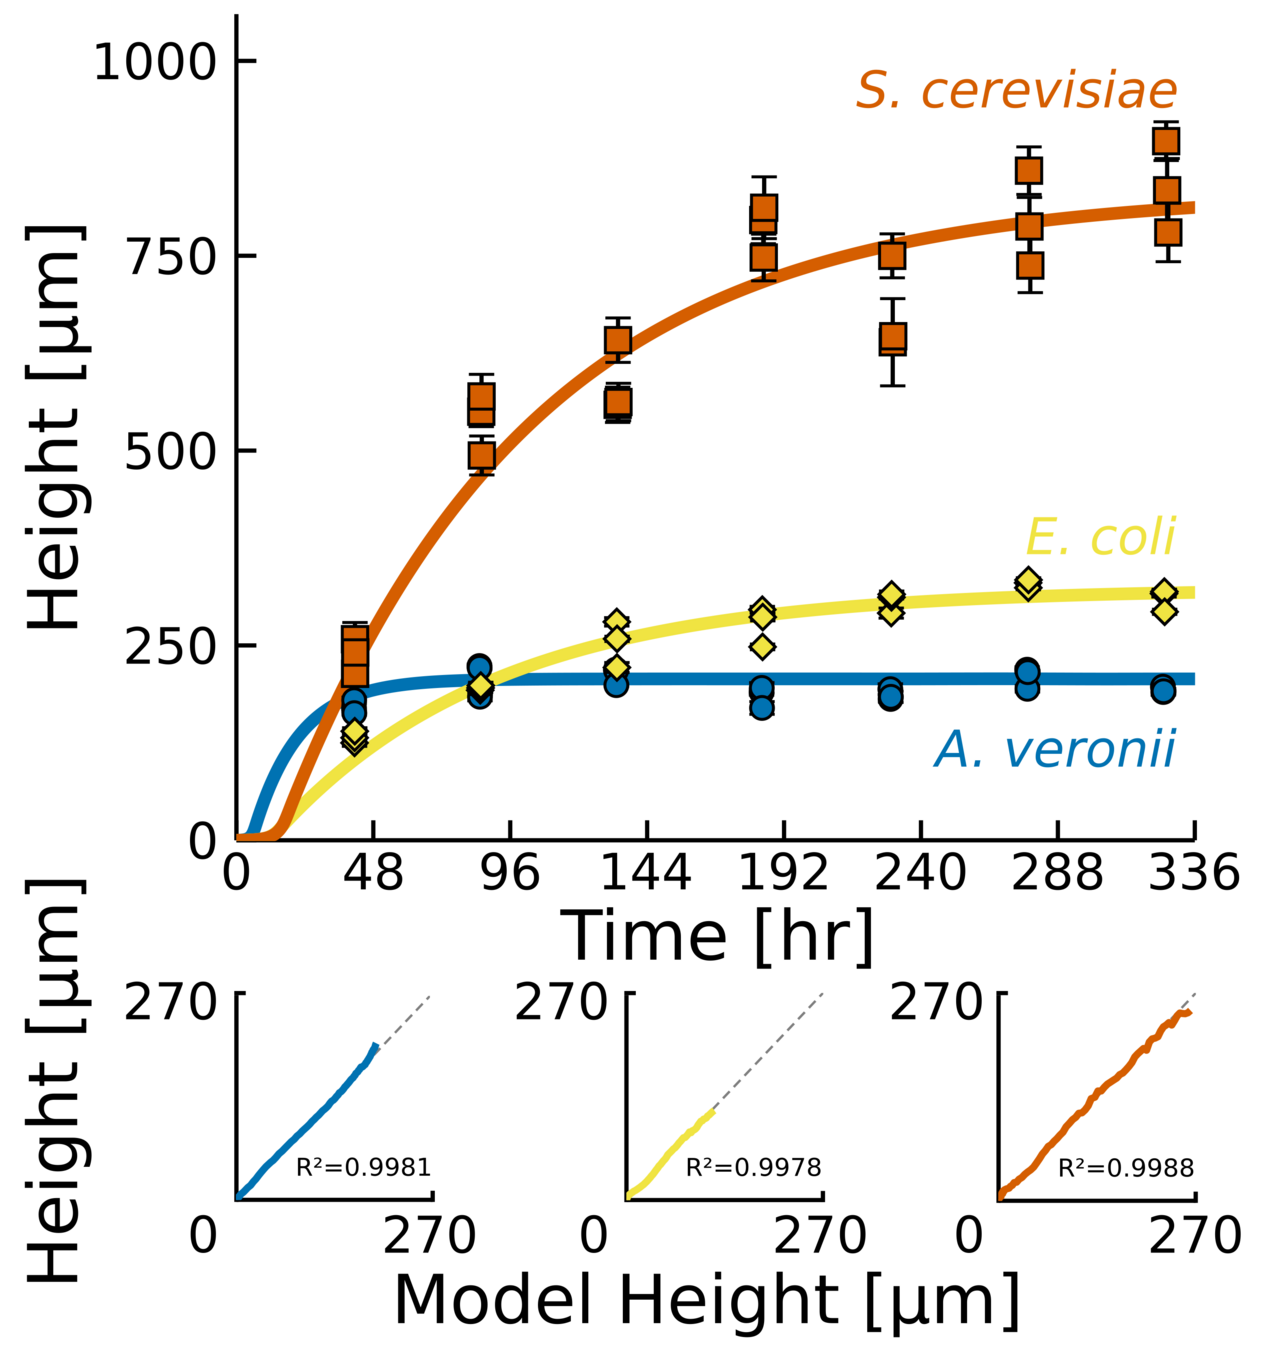
Model height prediction:
\(h_{\text{max}} = \frac{\alpha L}{\beta}\)
Same behavior, different parameters
Good agreement even early!
Experiments across a large cohort of microbes
Cool way of getting
numbers from growth in solid media
biologically relevant
\(800 \mu m^2 \cdot s^{-1}\)
\(38 \mu M\)
\(1.3\cdot10^3 \mu M \cdot s ^{-1}\)
Eschericia coli growing in agar -> limited by L-serine
Using literature parameters we obtain
\(L = 14.8 \mu m\)
And using the interface model
\(L = 14.3 \pm 1 \mu m\)
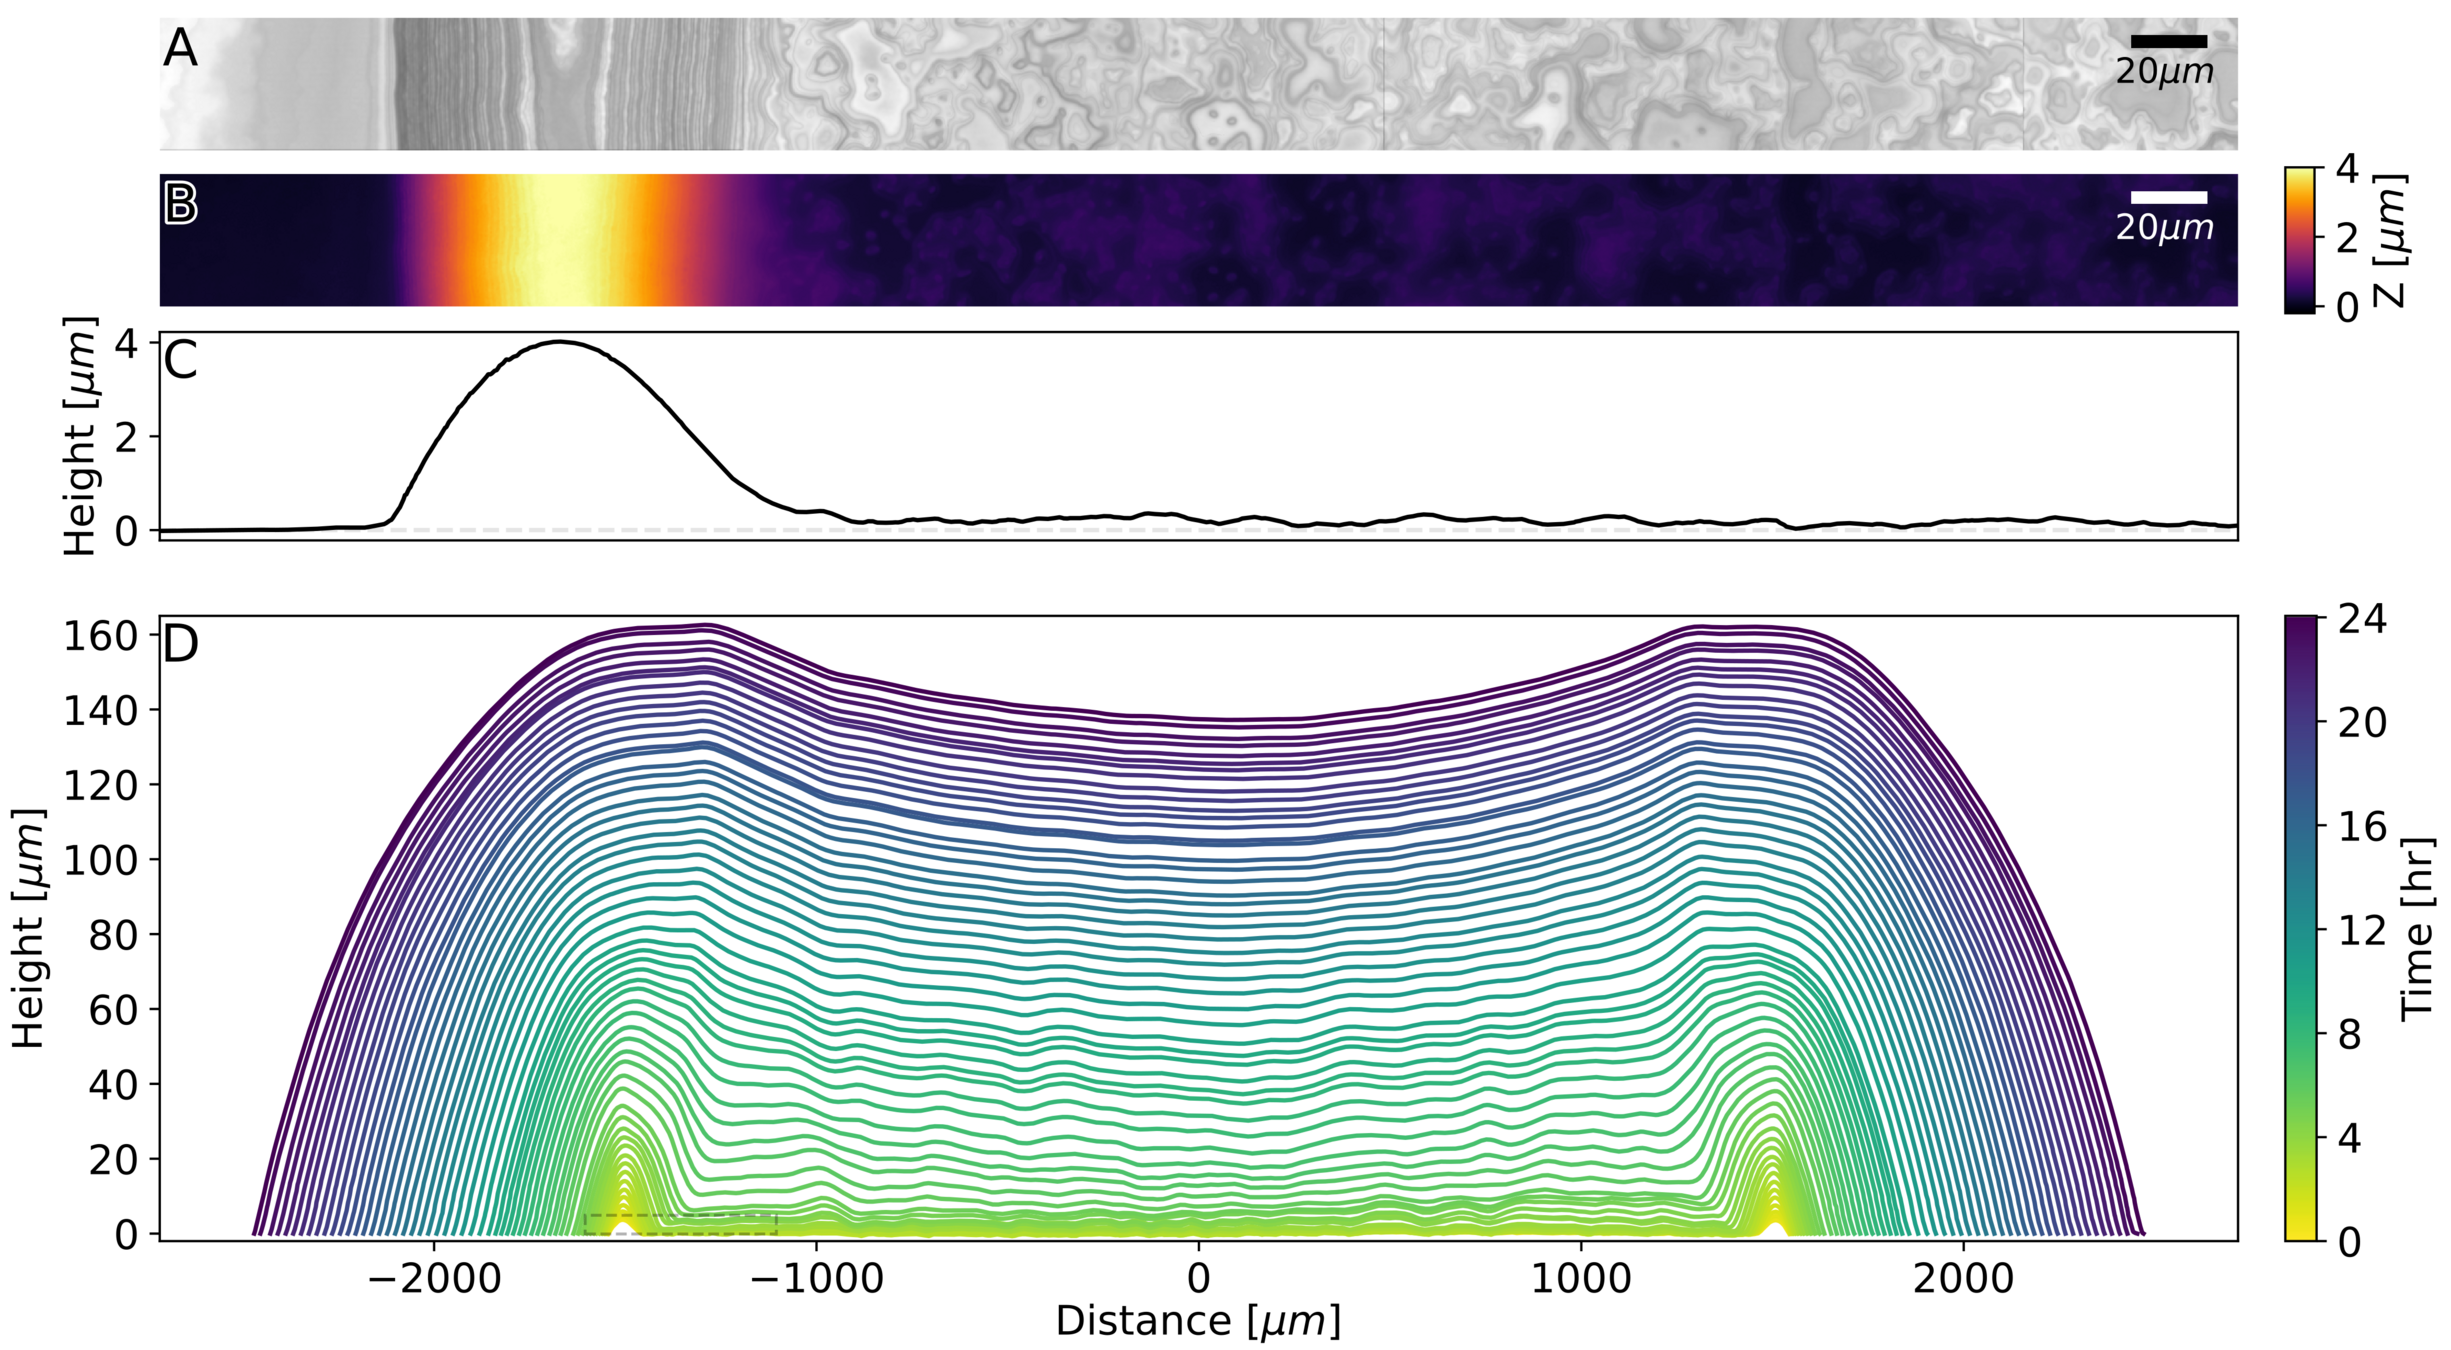
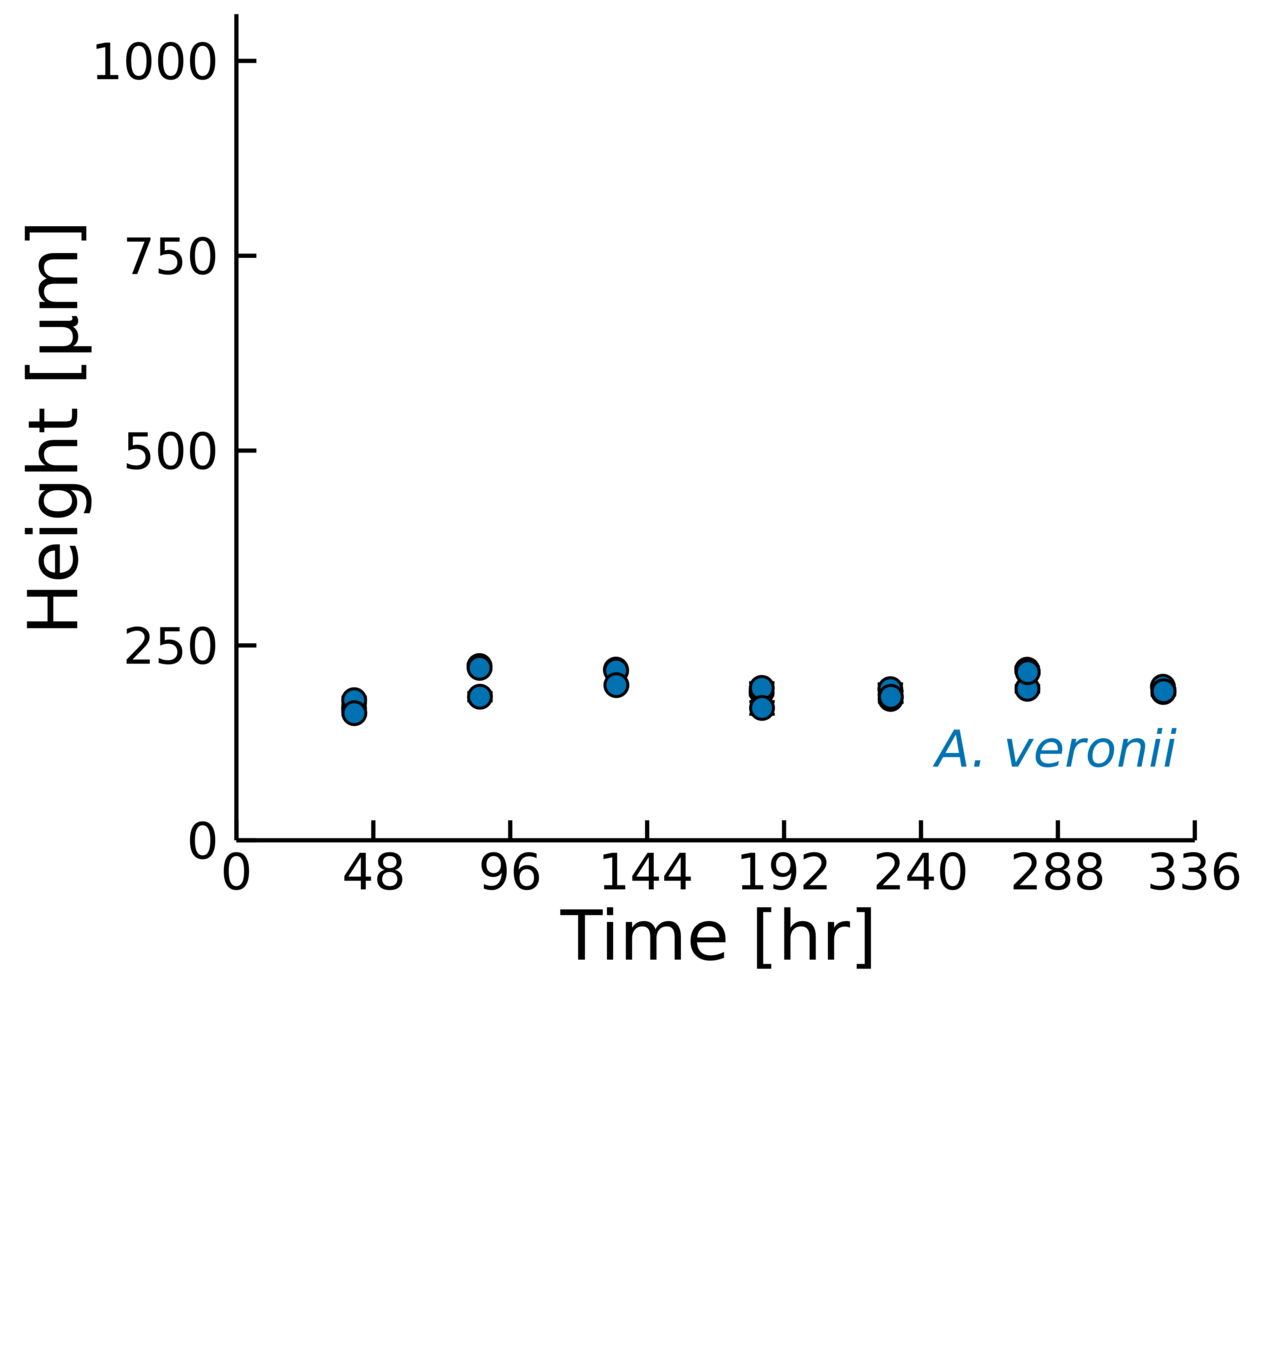
Profiles are flat. A few cells in amplitude, over thousands of micrometers!
\(500 \mu m\)
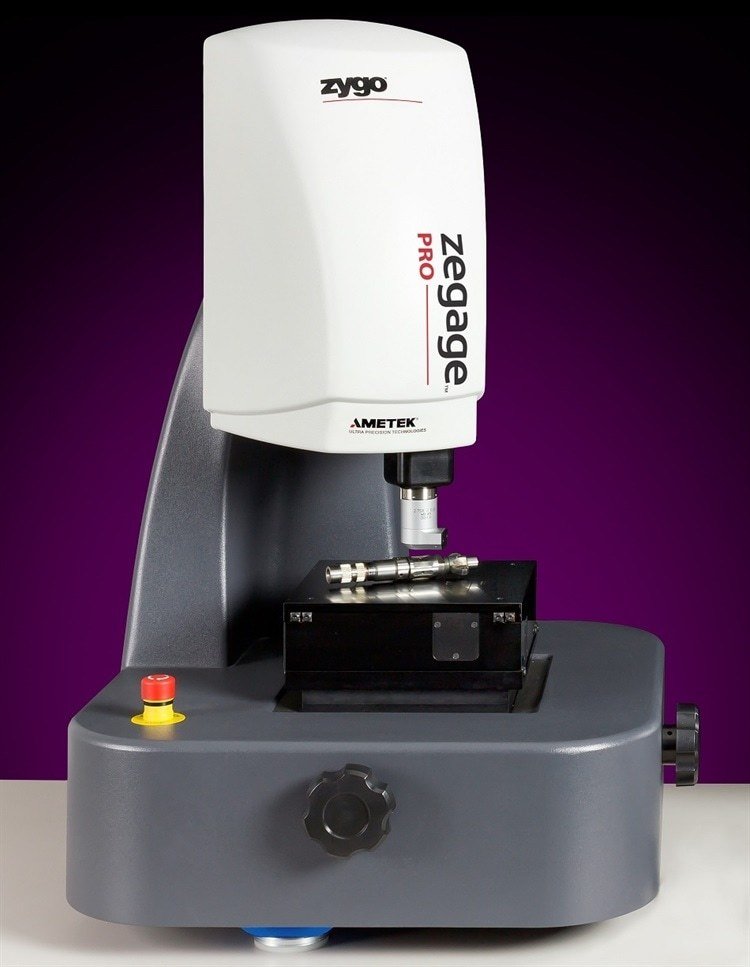
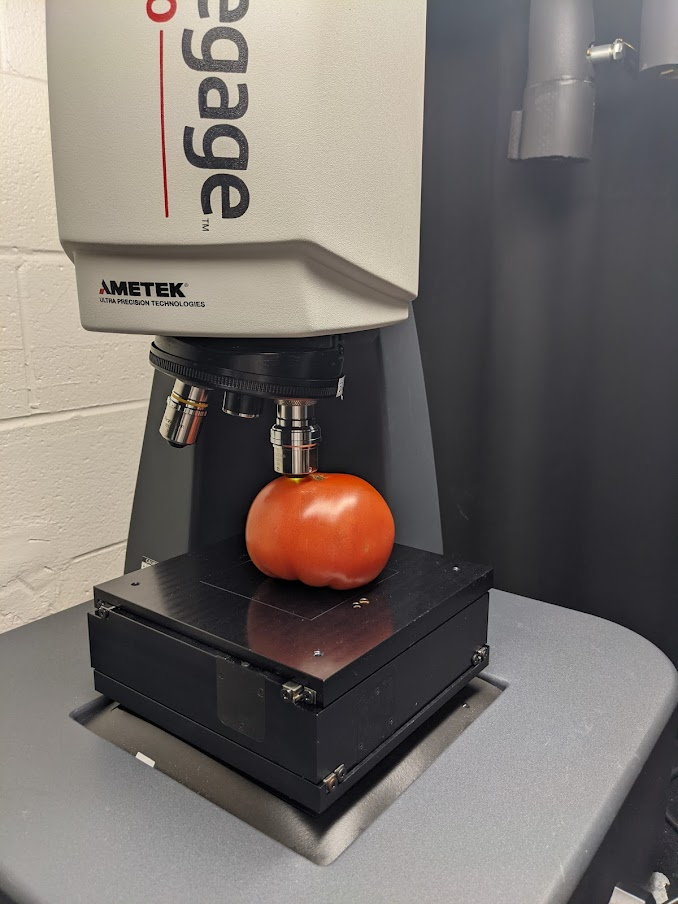
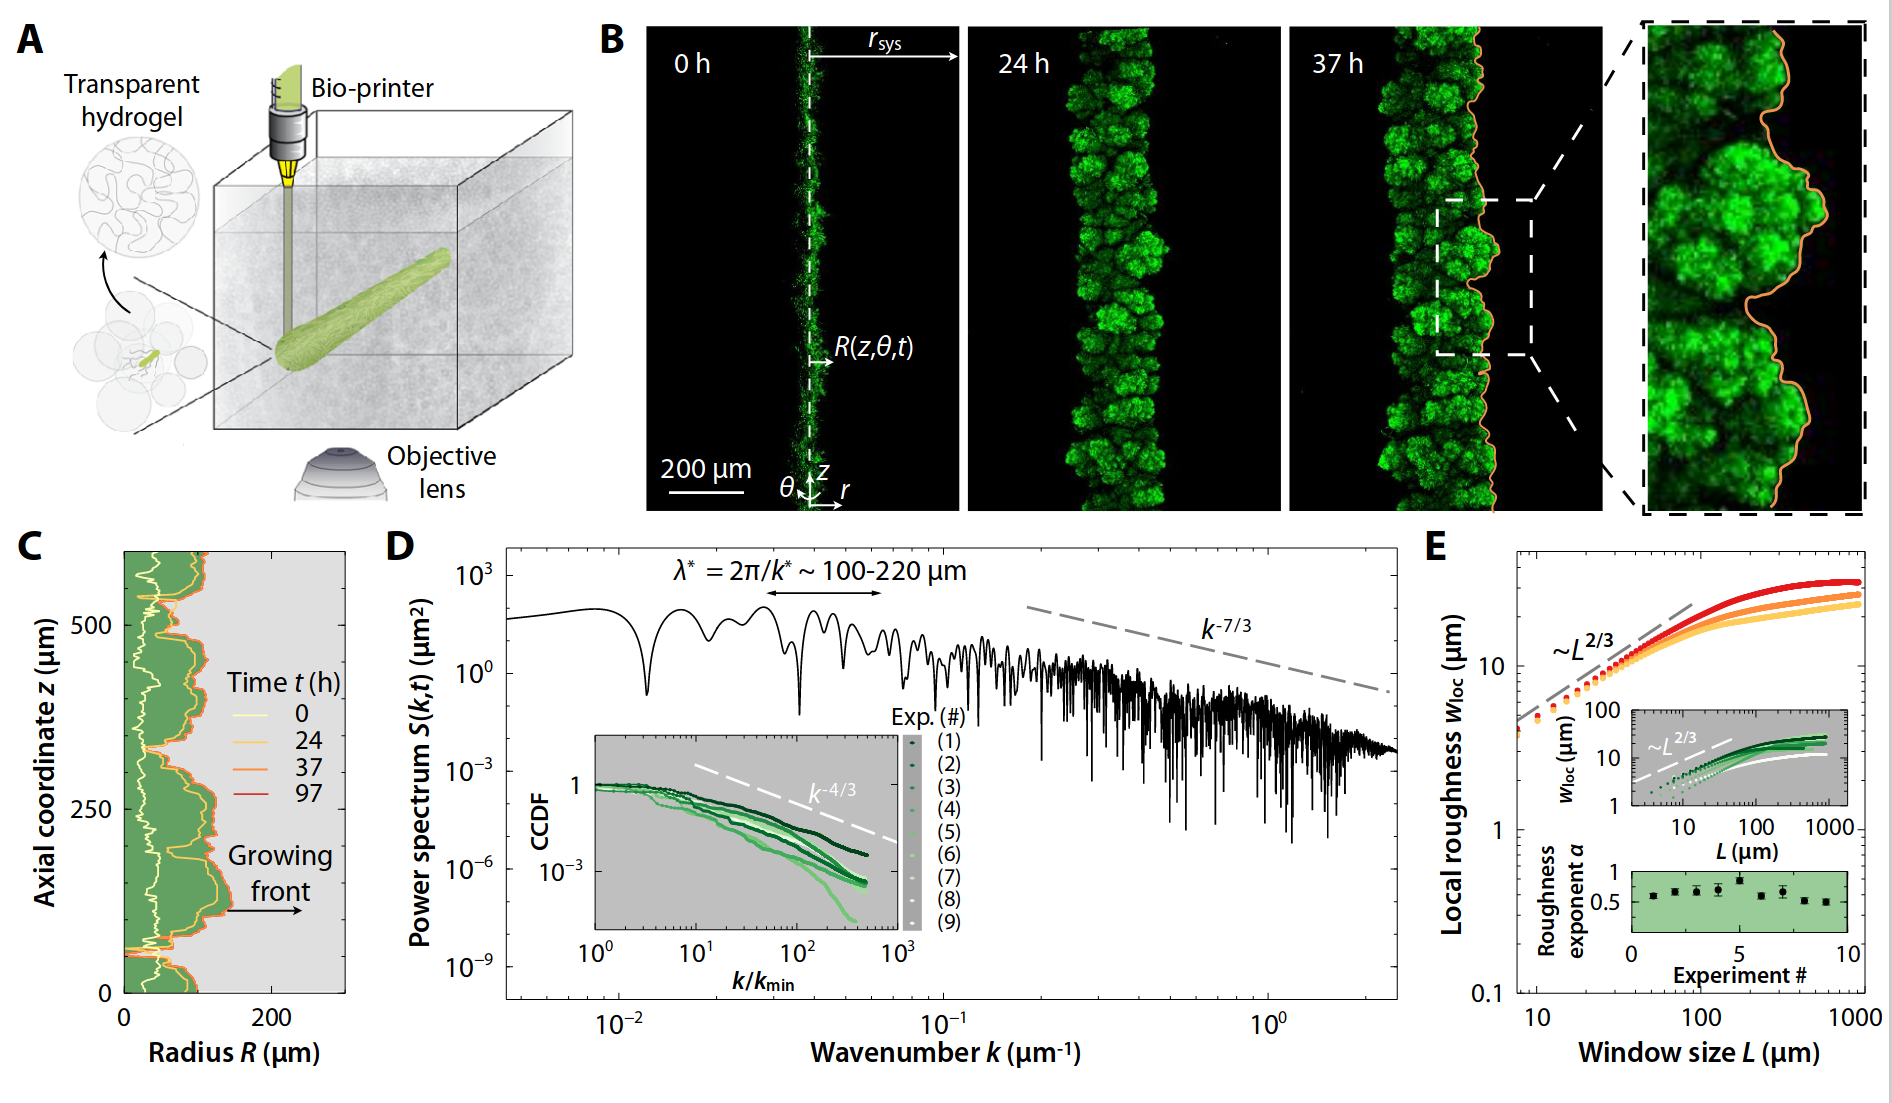
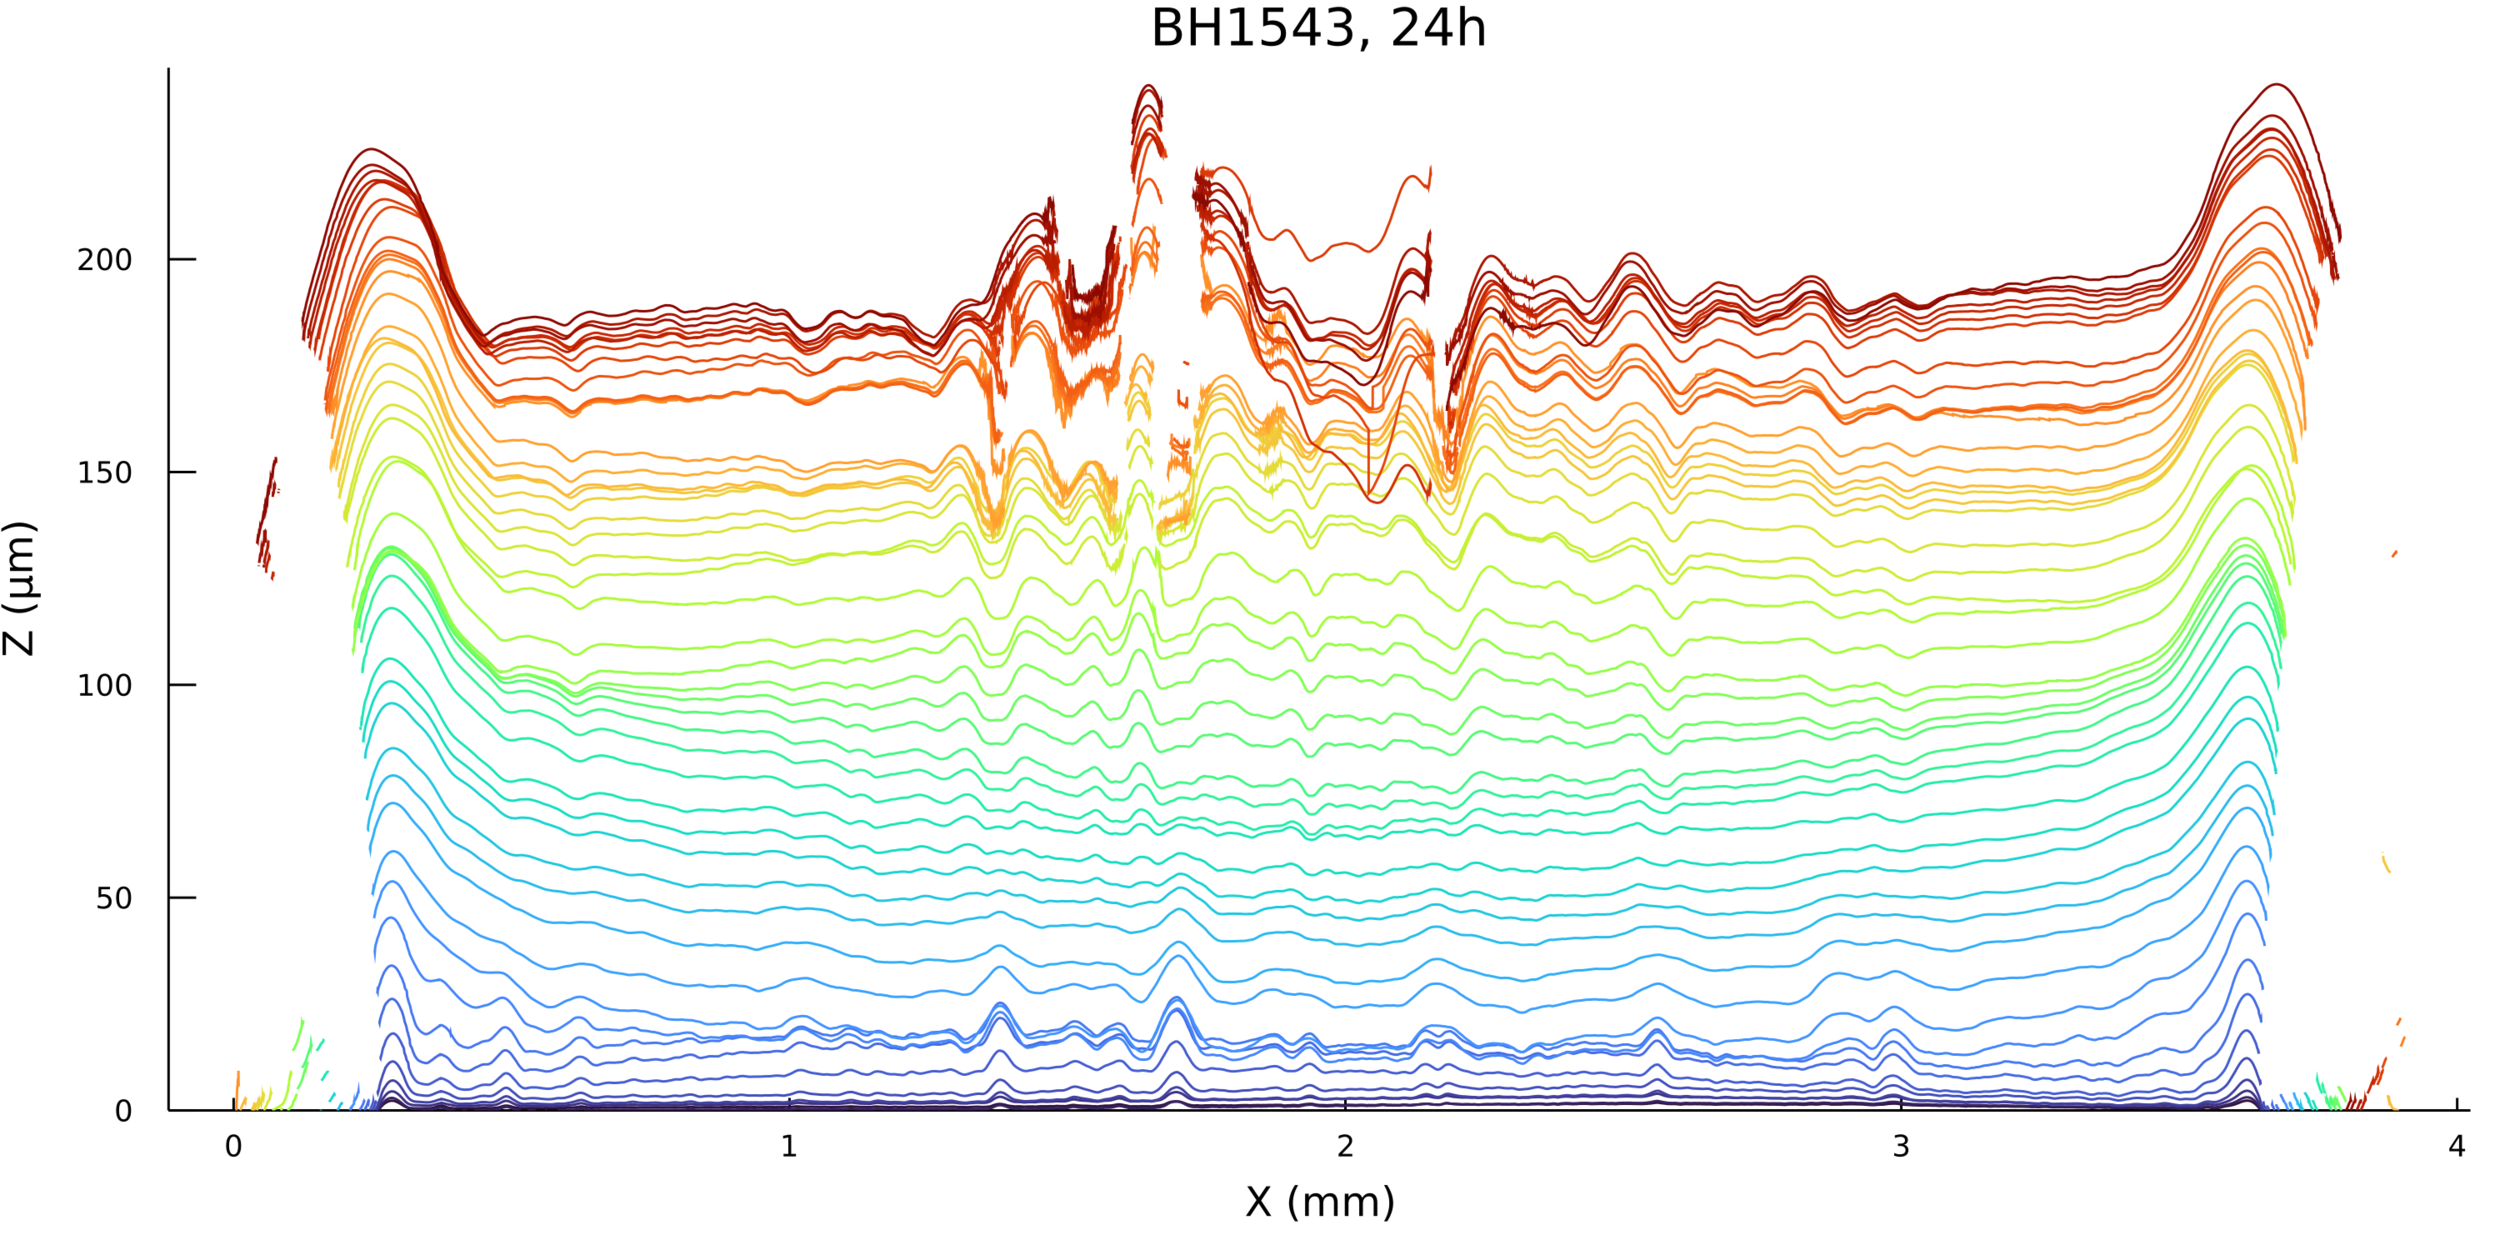
Using white-light interferometry, we can capture the profiles of a growing colonies for extended periods of time
Staphylococcus aureus
Bacillus cereus
Eschericia coli
\(2 mm\)
\(8 \mu m\)
Time since inoculation [hours]
\(0\)
\(24\)
\(48\)
Aeromonas veronii
Eschericia coli
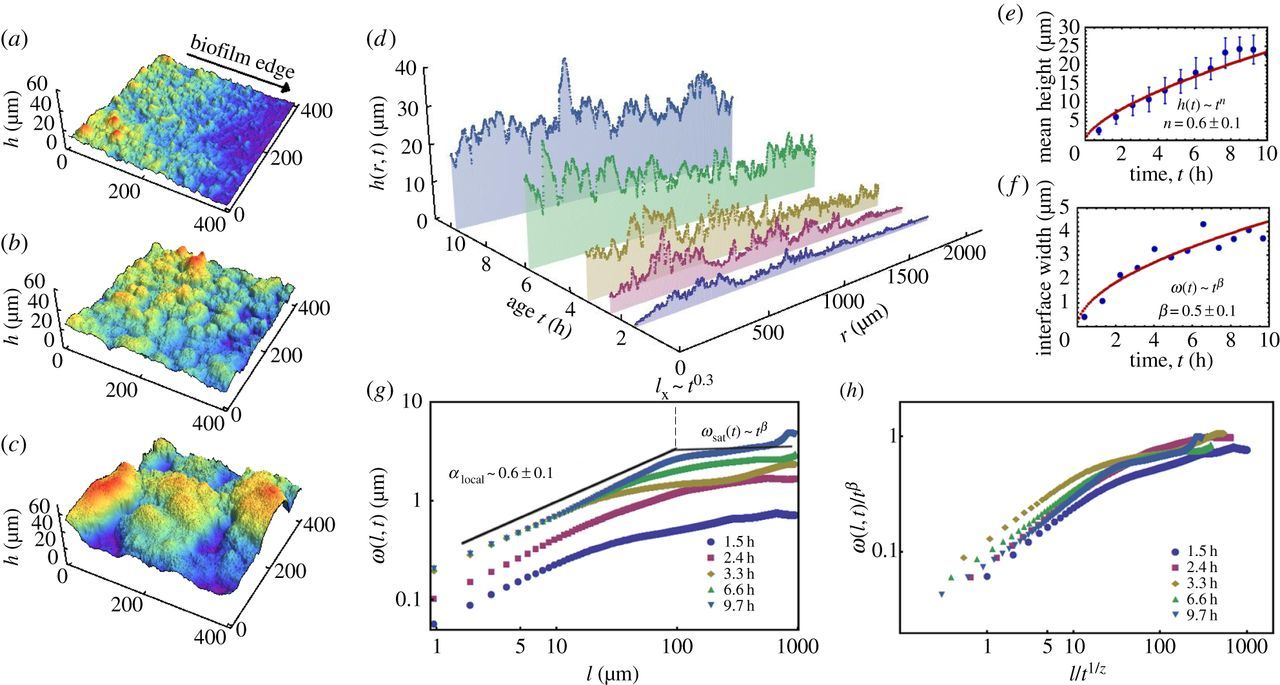
\(w_l(t) \propto l^{H} \)
Dervaux, et al. 2014
Martinez-Calvo and Bhattacharjee, et al. 2022
\(H\)
\(l_{\text{sat}}\)
\(w_{\text{sat}}\)
Roughness \(H\), after a period of time, stabilizes at \(H_{\text{steady}} \sim 0.8\)
There is high variability between microbes
Colonies reach nutrient depletion length \(L\)
And an apparent correlation between vertical growth dynamics and the topography!
Knowing the moment when the colony is growing the fastest, just by looking at
fluctuations
\(S(k) [\mu m^4]\)
\(k [\mu m^{-1}]\)
\(10^4\)
\(10^3\)
\(10^2\)
\(10^1\)
Dynamic scaling, a test for self-affinity requires:
\(\nu = 1+2H\)
We do not see observe dynamic scaling.
It is close but not the same!
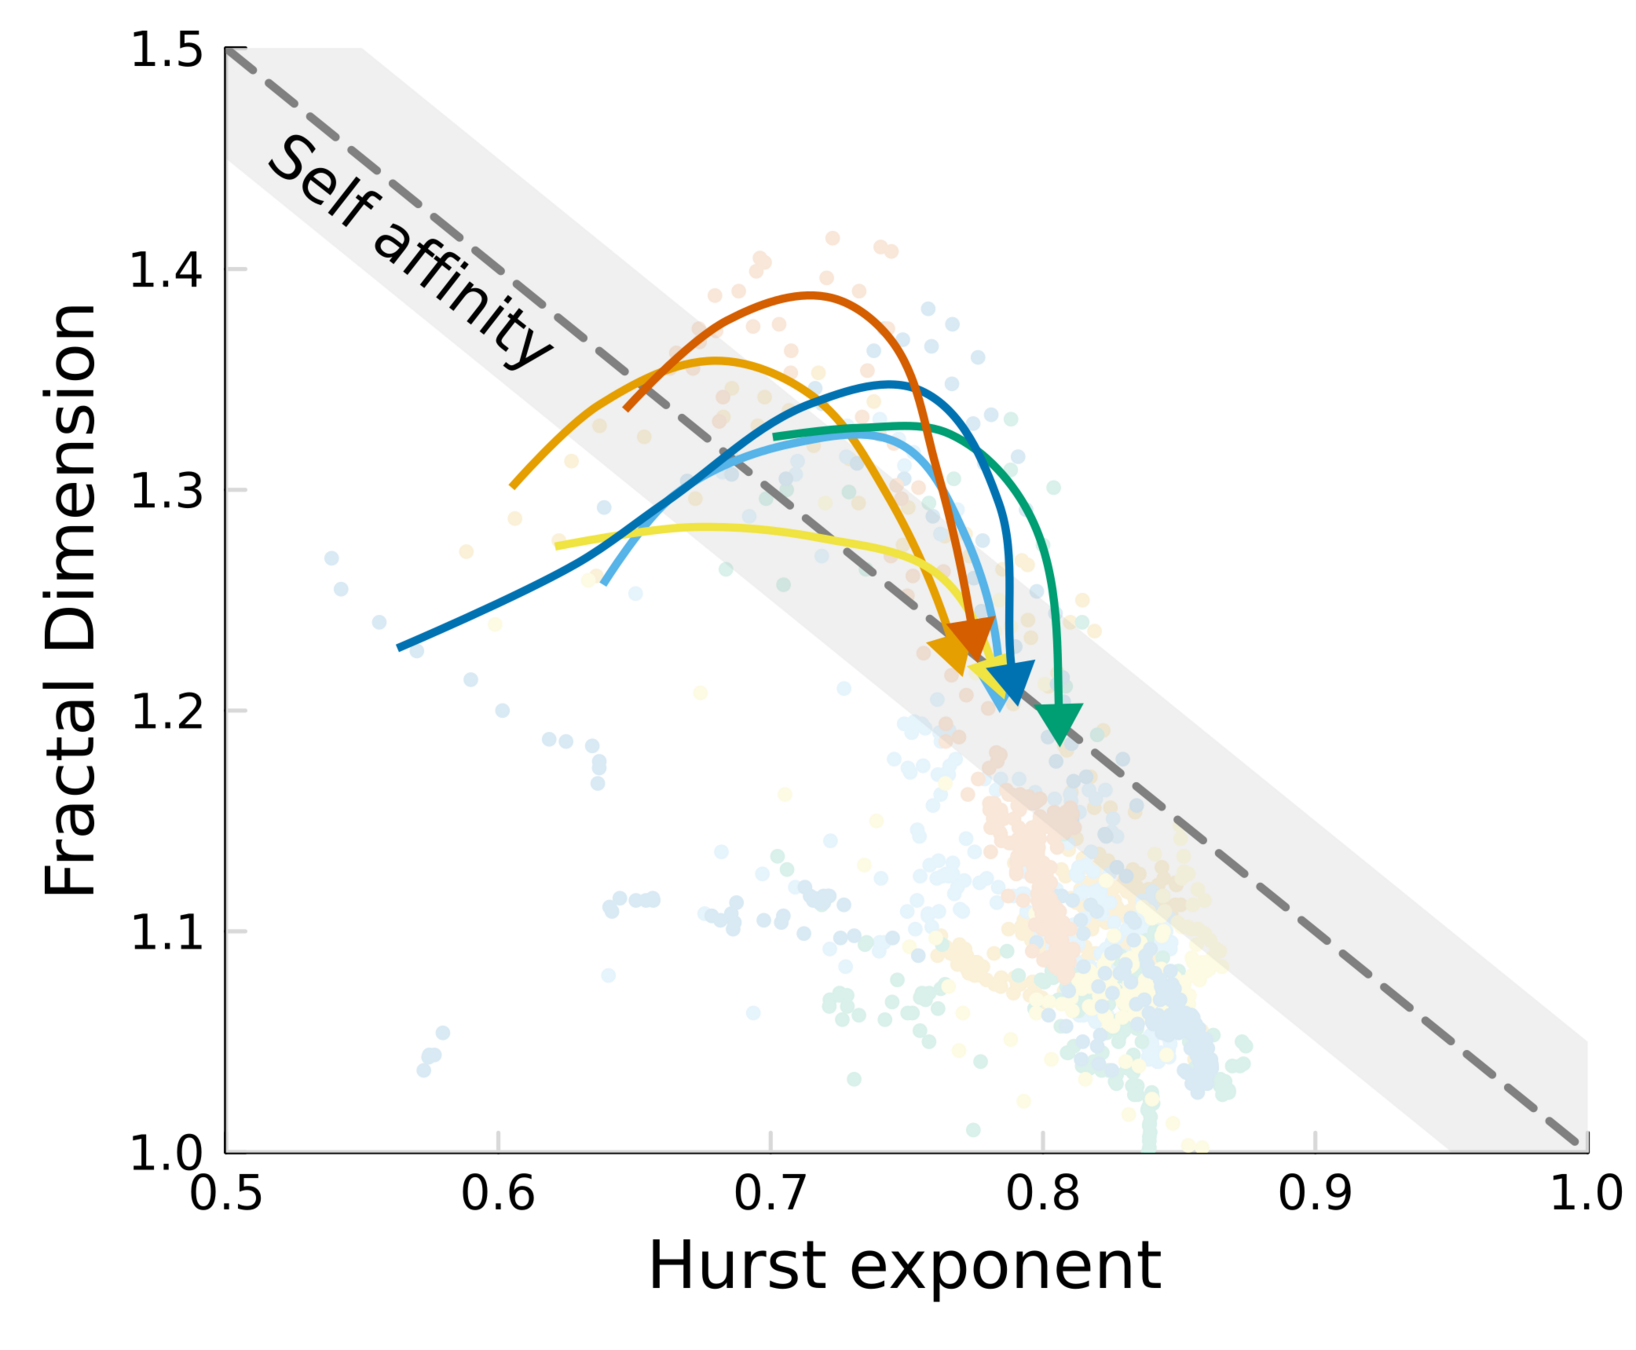
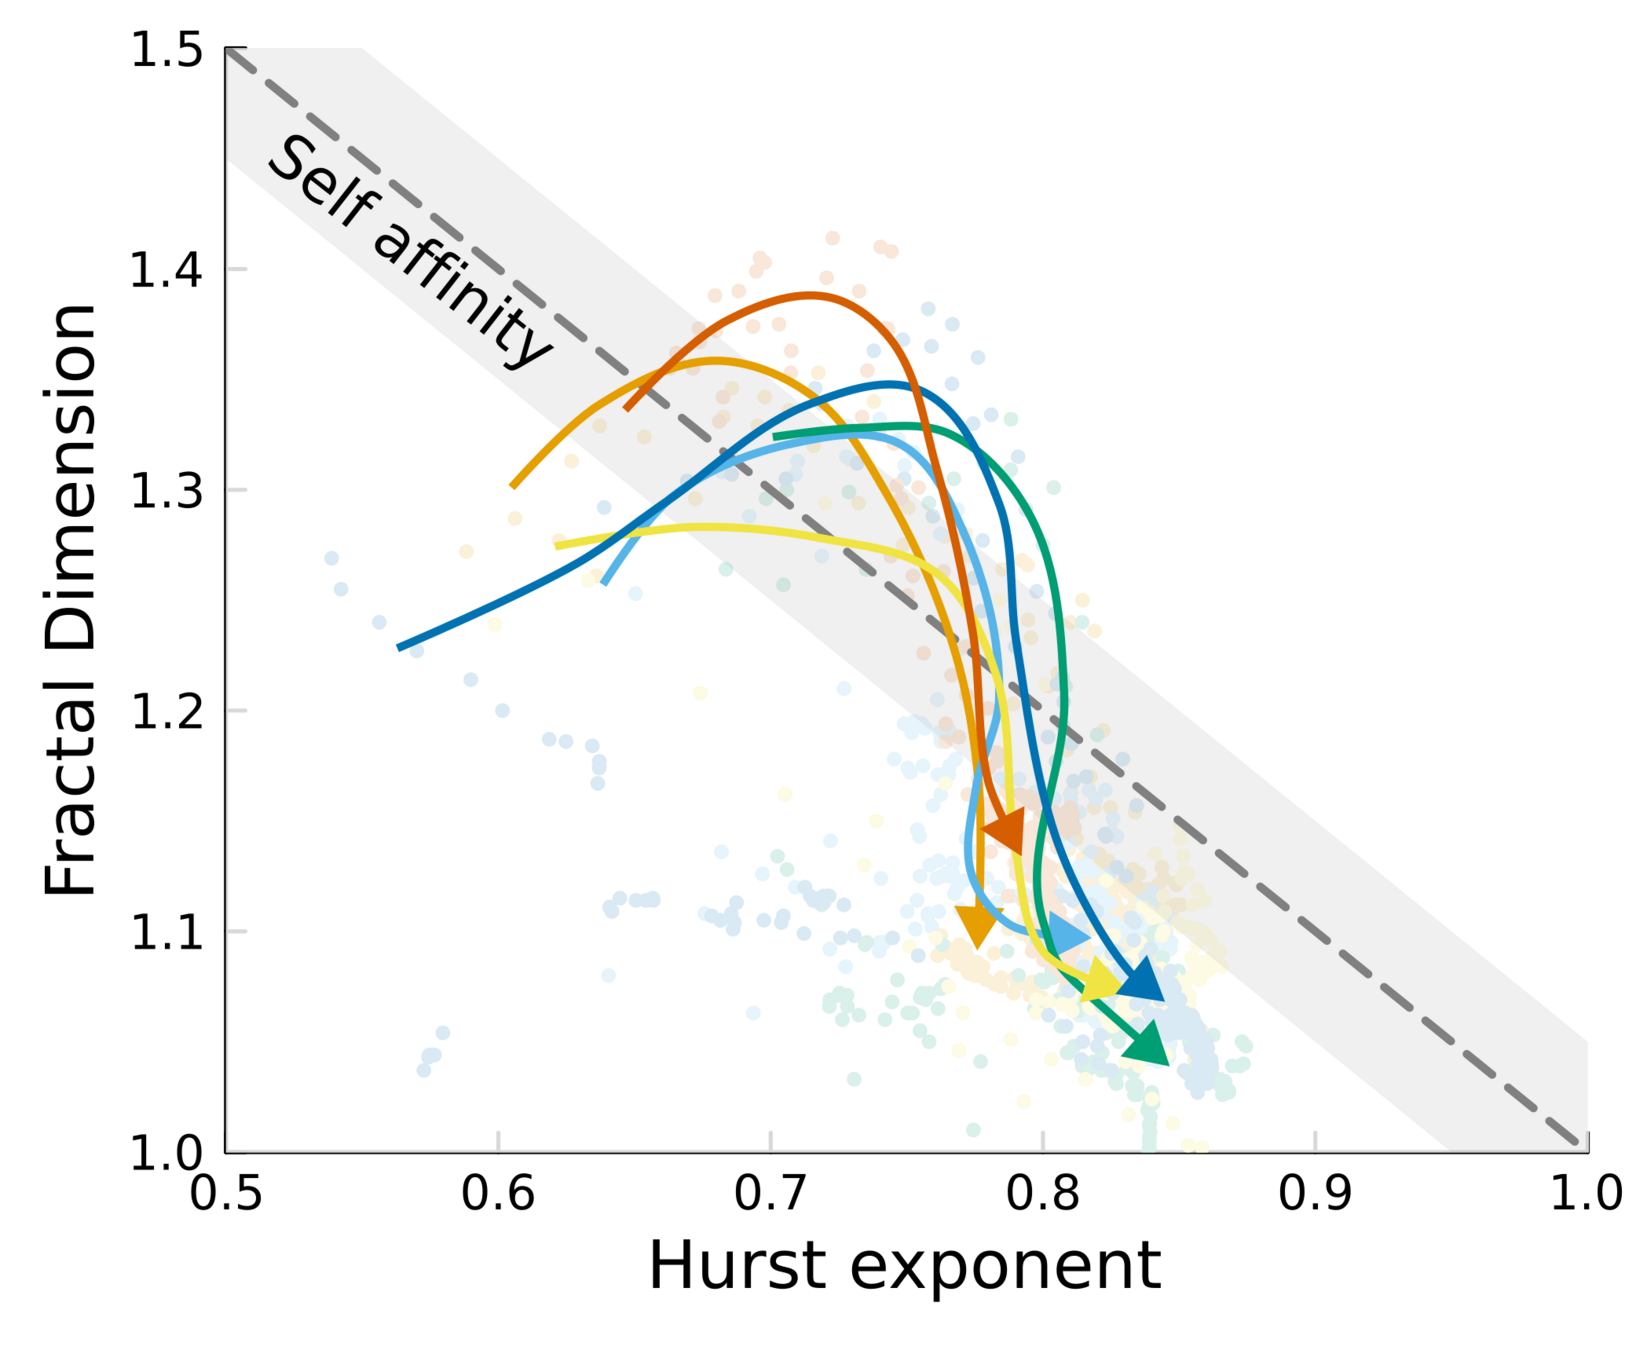
We can test self-affinity using the fractal dimension \(D\)
\(D + H = 2\)
\(D + H = n +1\), where \(n\) is the base dimension of the system
Topography dynamics as a consequence of growth through a viscoelastic material:
NIH-NIMS
NSF BMAT
Biolocity
Dr. Peter Yunker
Dr. Brian Hammer
Dr. Siu Ling Ng
Dr. Thomas Day
Aawaz Pokhrel
Emma Bingham
Adam Krueger
Raymond Copeland
Maryam Hejri
Lin Zhao
Chris Zhang
Lots to learn about , both from and
vertical growth
biofilm development
biotopographies
4x speed
10 \( \mu L \) inoculation
11 days
2x speed
Some stretch for really long before breaking
1. The deviation in controller X is too large
2. The controller target window has not been reached in target monitoring time
| Strain | Media | Species | Date | Comment |
|---|---|---|---|---|
| JT1080 | LB 1.5% | Vibrio cholerae | 2020-11-10 | EPS- |
| SN503 | LB 1.5% | Vibrio cholerae | 2021-01-11 | EPS+ |
| BH1543 | LB 1.5% | Vibrio cholerae | 2021-04-12 | EPS++ |
| BGT127 | LB 1.5% | Aeromonas | 2021-06-25 | |
| bacillus* | LB 1.5% | Bacillus subtilis | 2021-07-30 | Gram + |
| JT305 | LB 1.5% | Eschericia Coli | 2021-08-27 | |
| pyeast* | YPD | Saccharomyces cerevisiae | 2021-09-03 | Aerotolerant anaerobe |
| CC151 (~JT305?) | YPD | Eschericia Coli | 2022-01-21 | wt ecoli on different media |
| pyeast* | YPD | Saccharomyces cerevisiae | 2022-01-28 | Aerobic |
Do we need more/specific combination?
By Pablo Bravo
Discover how white-light interferometry can measure biofilm growth, their 3D structures, dynamics, and topographies. Presentation made for the QBioS 4th year Seminar at GeorgiaTech.


