Chetty et al. (2016)
The economics of Housing & Homelessness
Young Families in Public Housing
Old Families in Public Housing
Young Families in Private Rental Market
Old Families in Private Rental Market
TIME
Young Families in Public Housing
Old Families in Public Housing
Young Families in Private Rental Market
Old Families in Private Rental Market
TIME
Compliers
Compliers
Big Picture Questions
How would you frame this paper?
"To some readers, it may seem odd that social scientists spent a decade or more, and millions of public and private research dollars, “proving” that high-risk neighborhoods are, in fact, bad for people. But that was not the aim. It was, instead, to examine, through careful tracking and comparison, what could happen if some people were given a chance to get out."
- Moving to Opportunity : The Story of an American Experiment to Fight Ghetto Poverty
What mechanism would you like to have seen explored further?
School Access & Success
Role of transportation
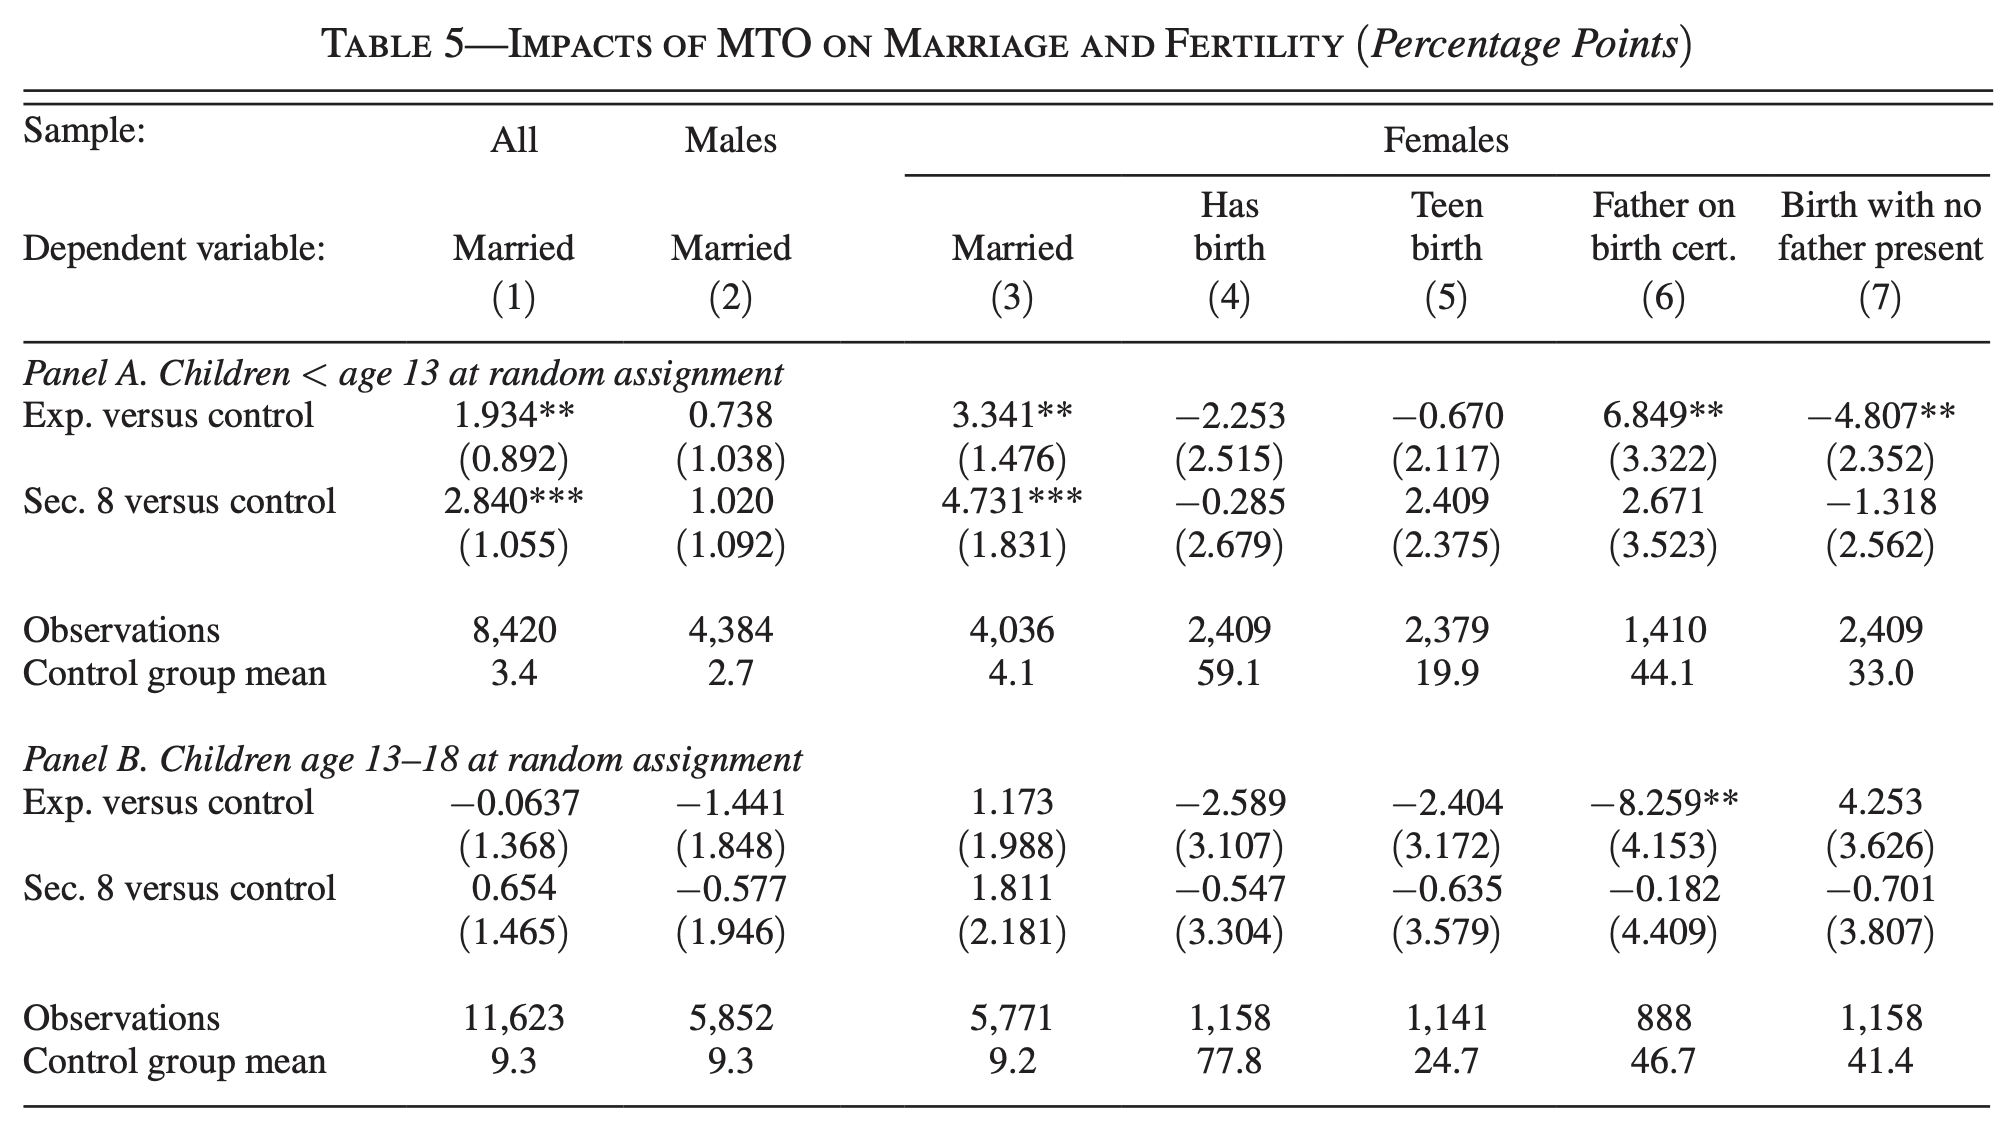
Effects by family structure
What is an alternative identification strategy?
Motivation
Motivation
Across Economic, Health, and Educational Outcomes
Motivation
Prior work based on MTO has shown that adults and older kids don't benefit economically from moving to lower poverty areas
Prior observational work has shown that younger kids benefit economically from moving to lower poverty areas
Hypothesis
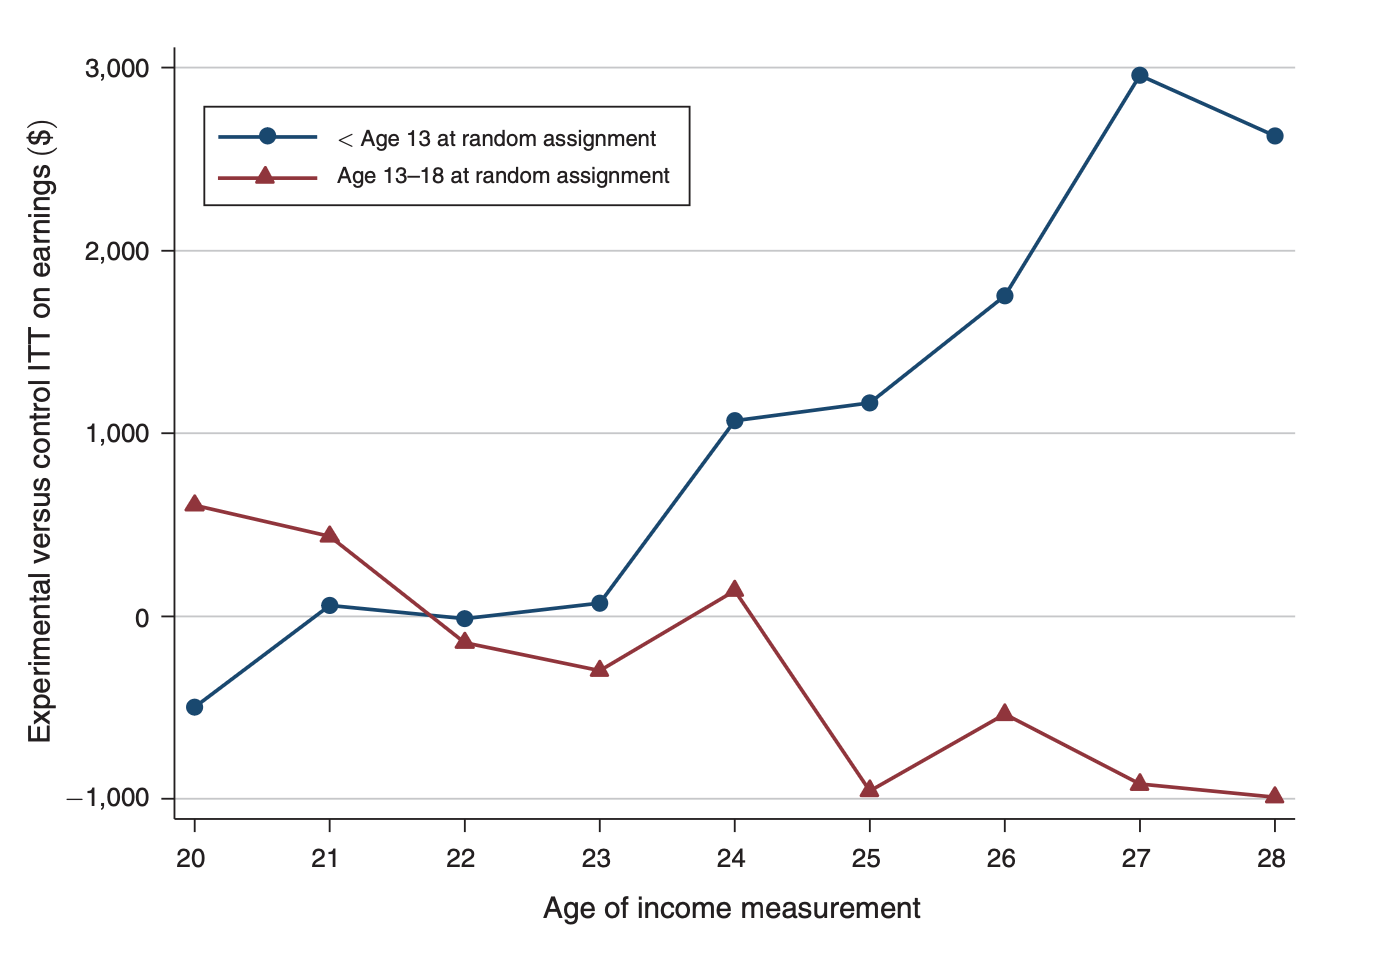
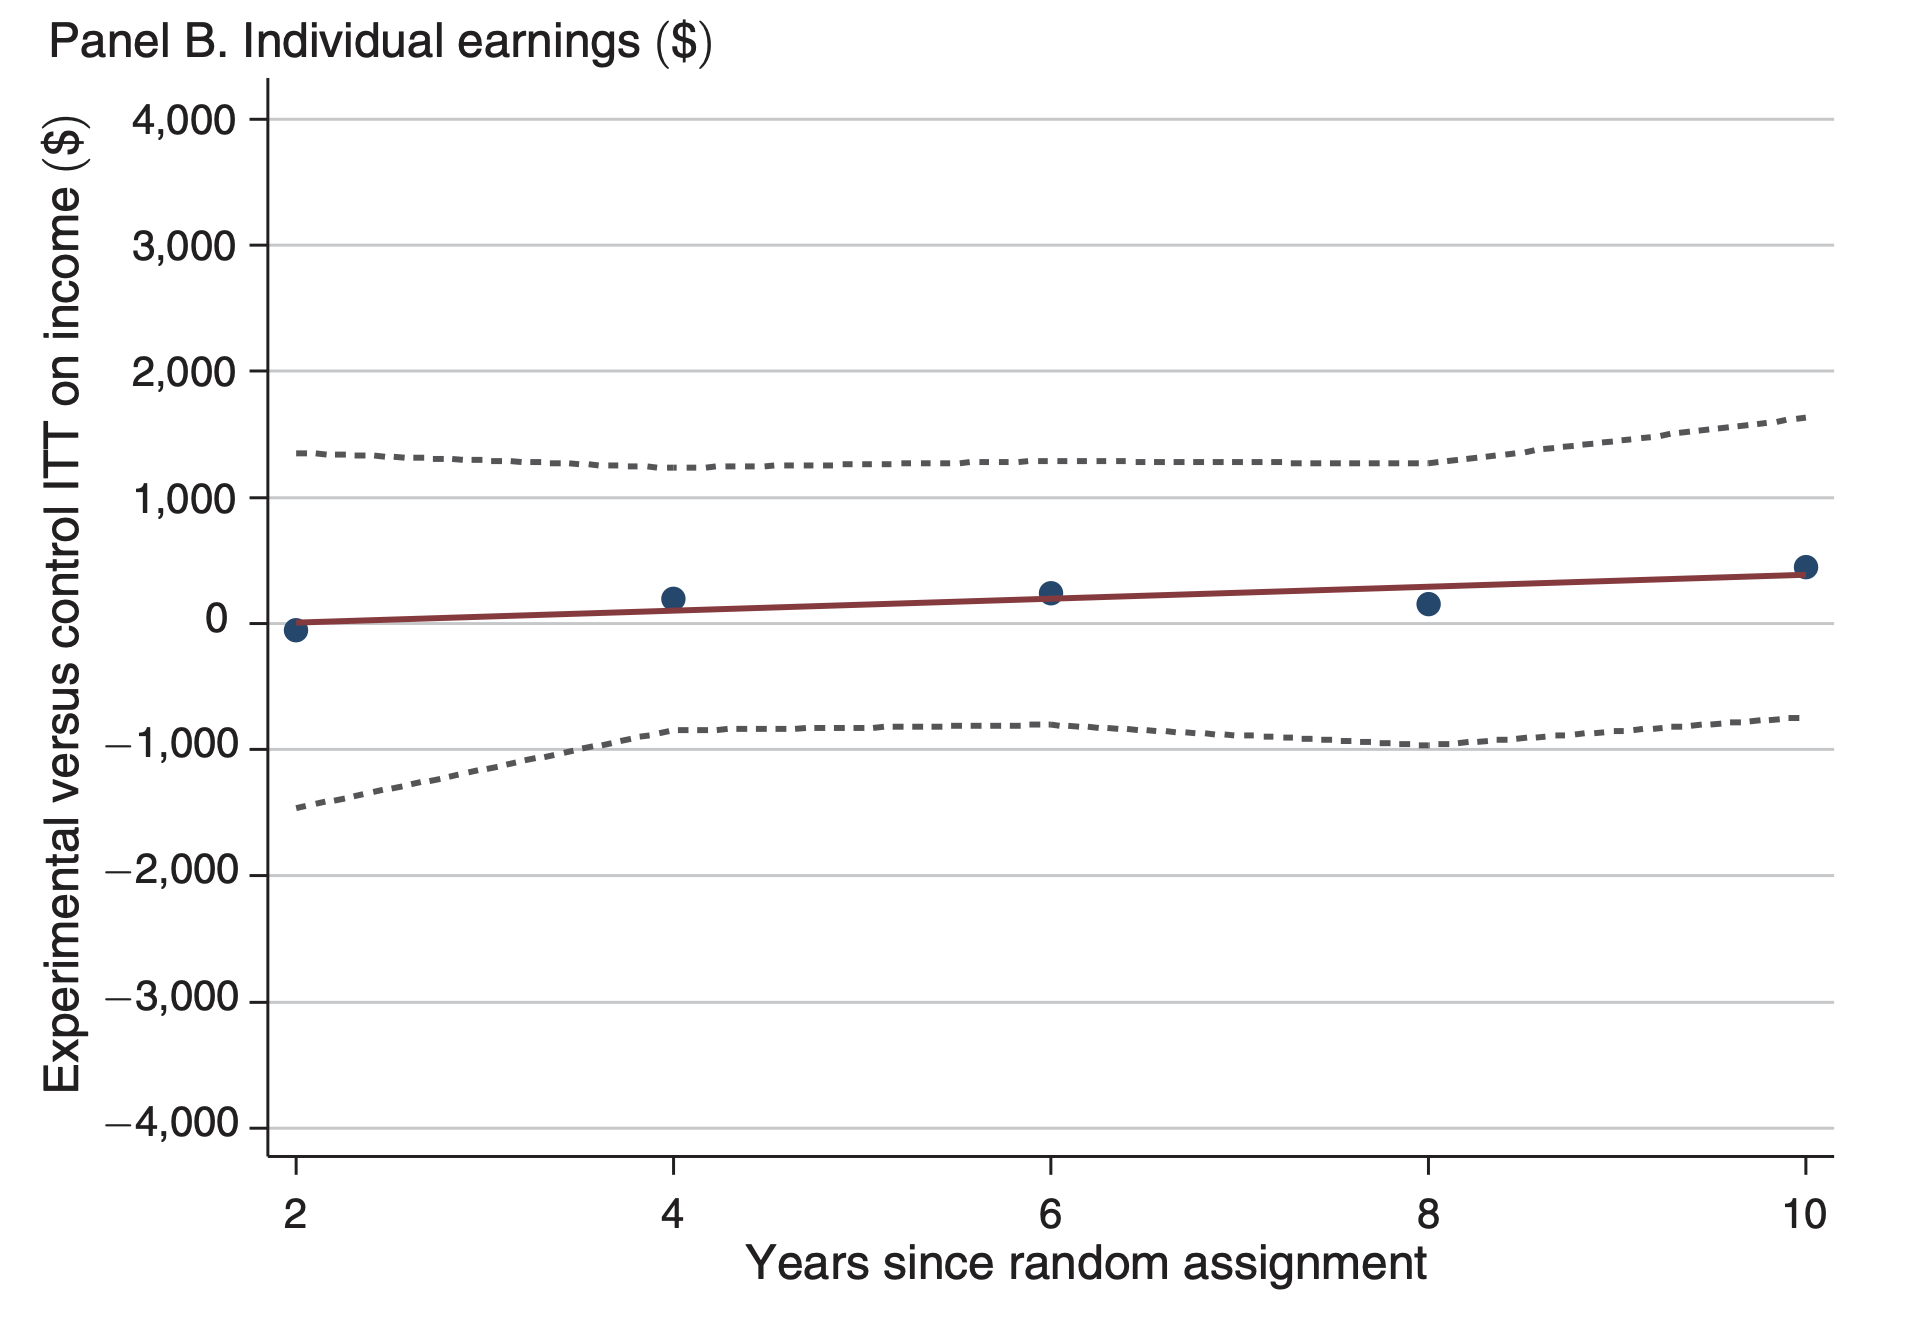
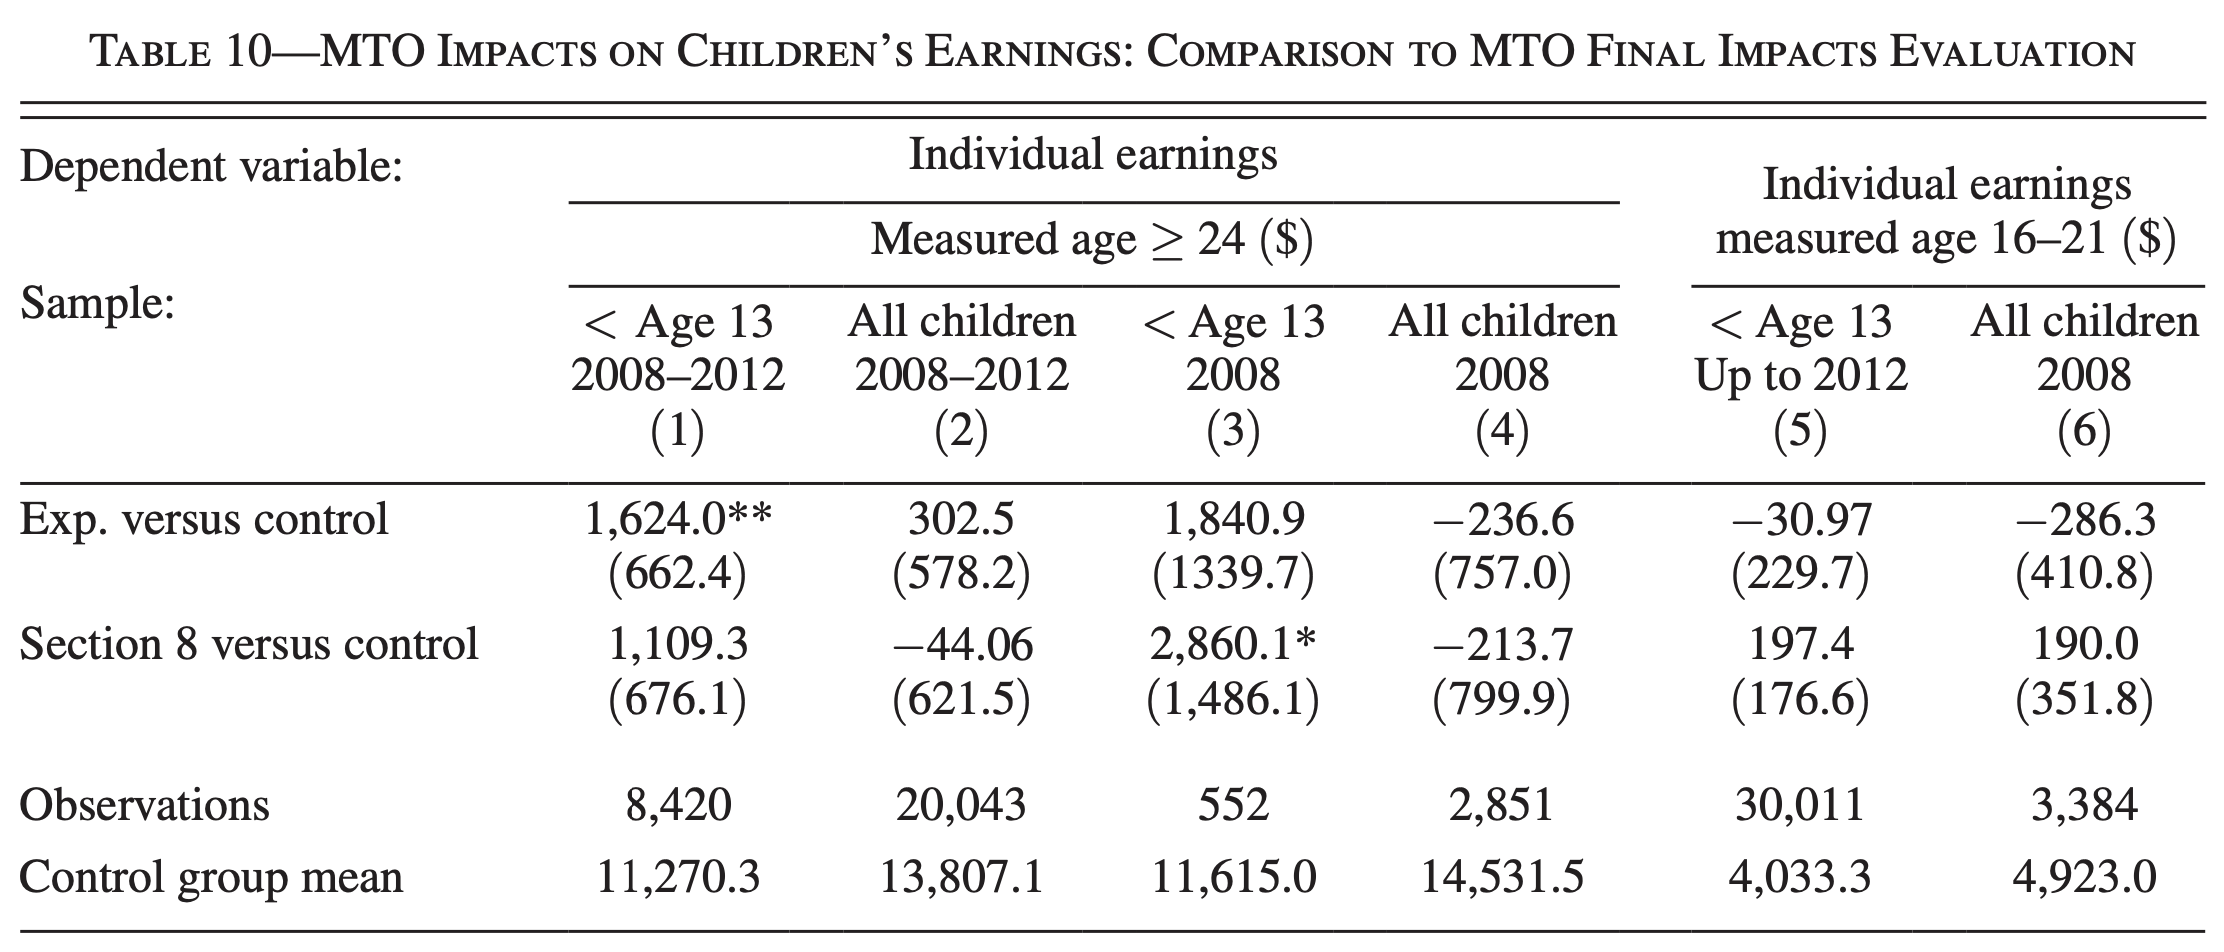
Economic Impact
Age at Move
Applied Econometrics
Set of All Children in Public Housing
Set of all possible Data Sets
Set of All Children in Public Housing
Families With Kid Younger than 13
Families With Kid 13 or Older
Families With Kid Younger than 13
Families With Kid 13 or Older
Compliers
Compliers
Section-8 Compliers
Experimental Compliers
Population
Housing Voucher
Income as Adult
Exposure to Low-income Neighborhood
Ludwig et al. (2013)
Moved to Low-income Neighborhood with Voucher
Chetty et al. (2016)
Averaging Across Sites
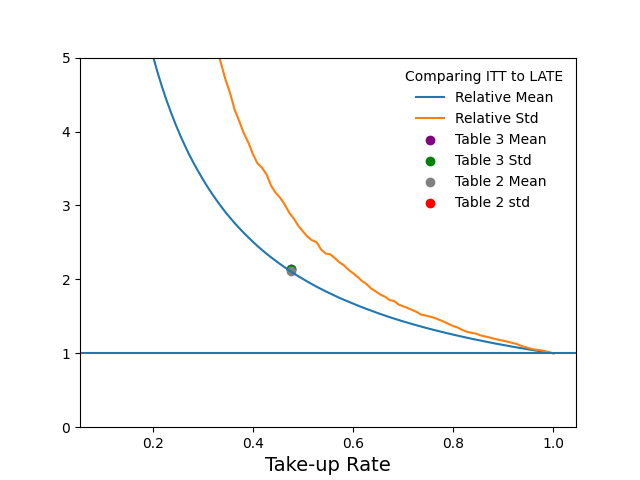
The LATE Effect is captured via:
Is the linear regression with site fixed effects flexible enough to ensure that this term is nonnegative for those with Z=1 given that the complier groups can differ across sites?
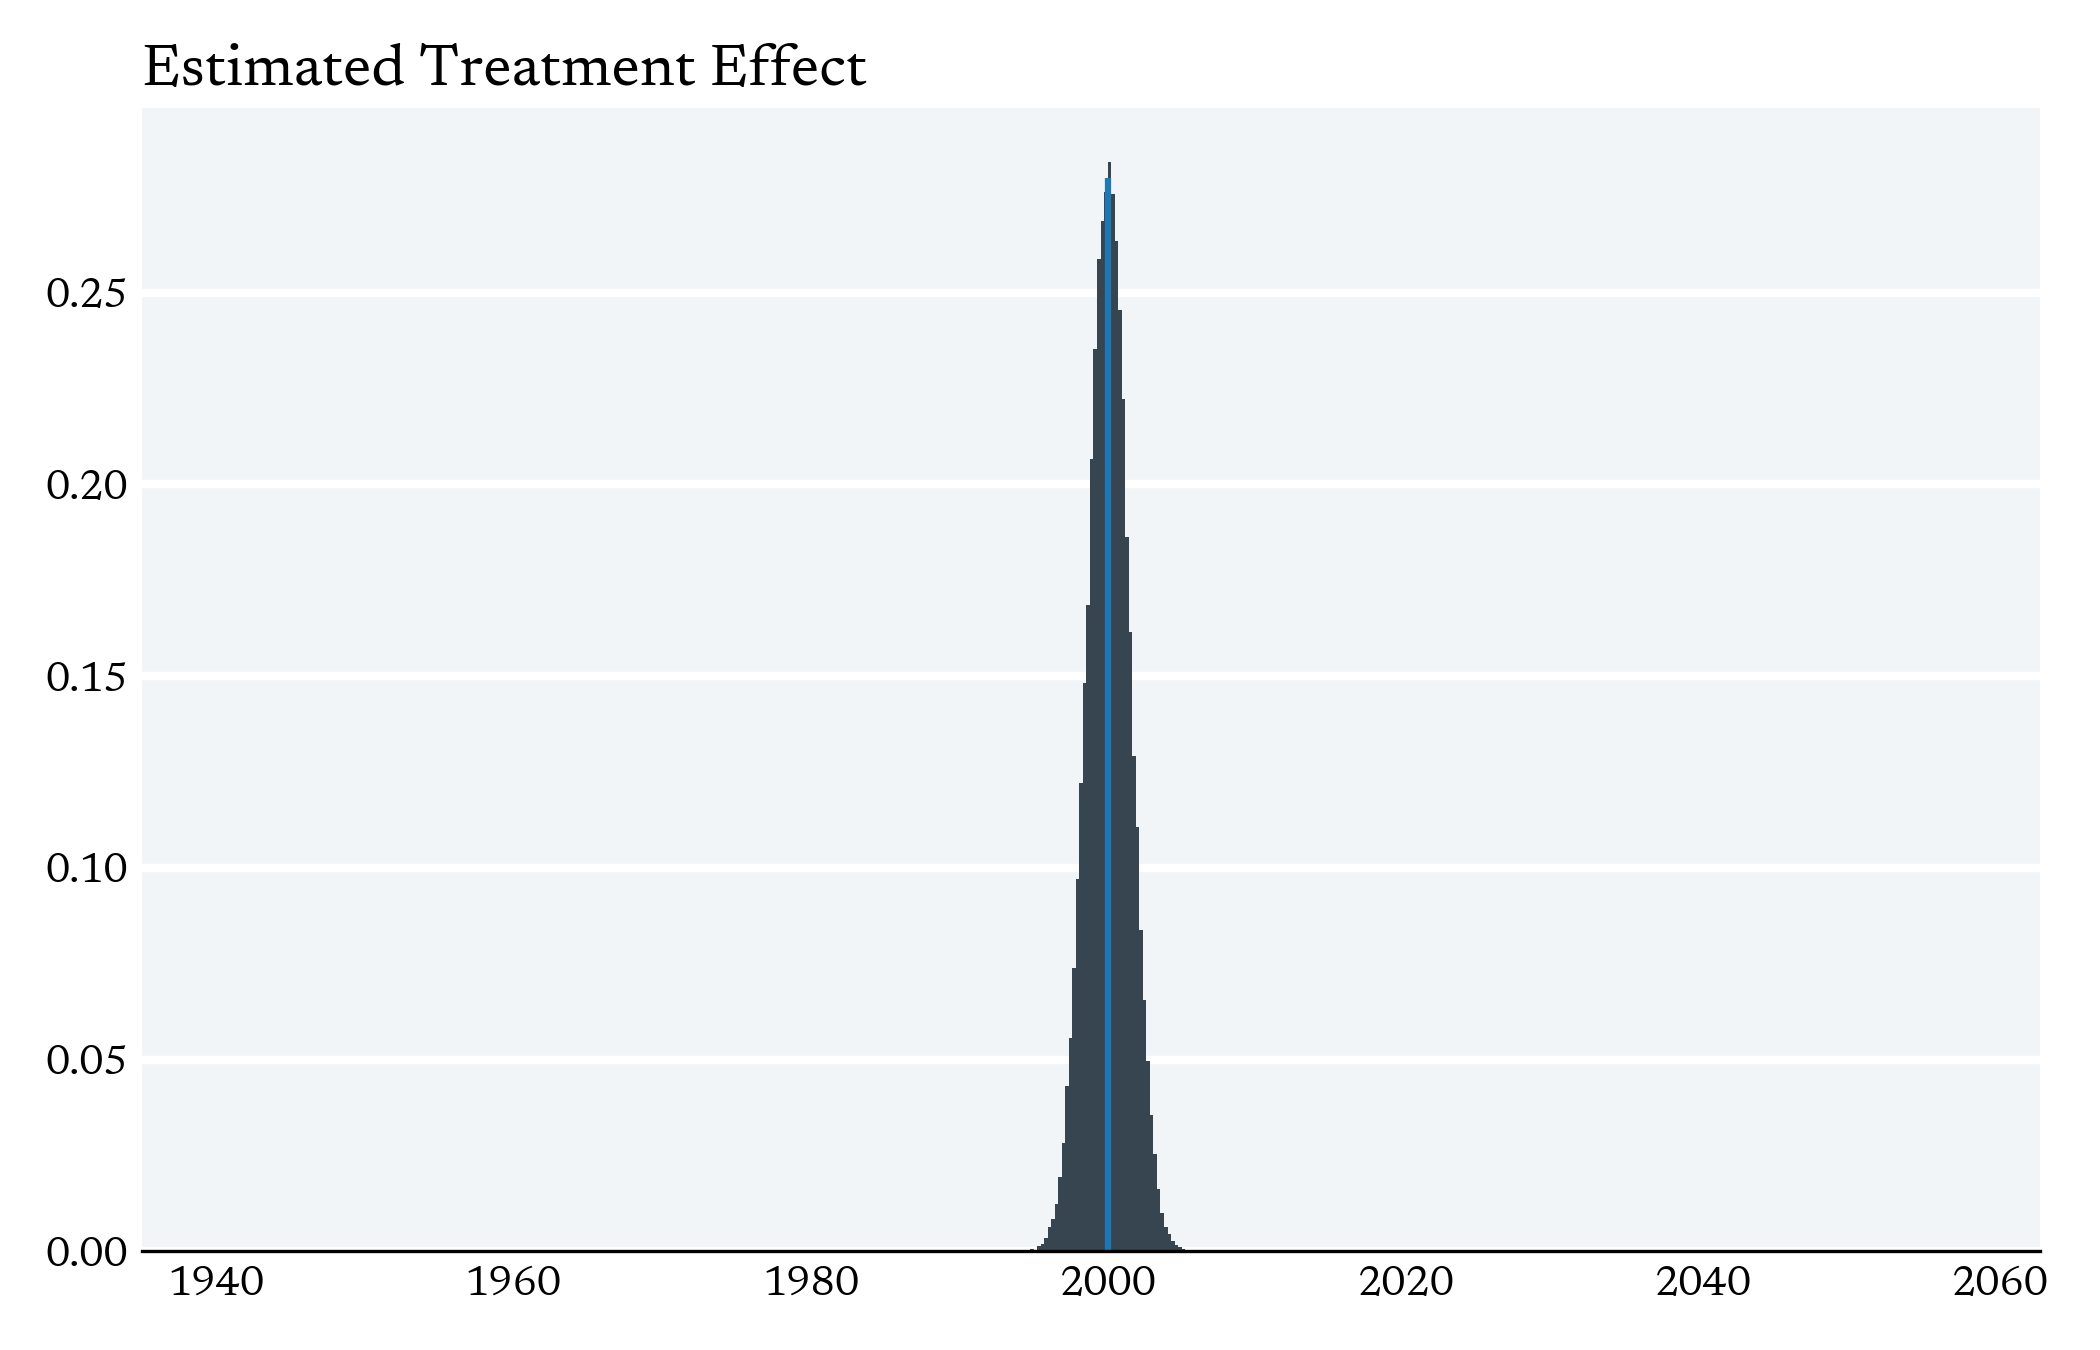
Standard Errors
Do the standard errors on the TOT look too small relative to the ITT?
Under the assumption of i.i.d data
Standard Errors
Under the assumption of i.i.d data
If I divide the sample mean by 0.5
I should double the standard error
I should double the sample mean
Standard Errors
In practice, we're not dividing the ITT (a sample mean) by a constant. We're dividing it by the Fstage estimate which is a random variable

Details
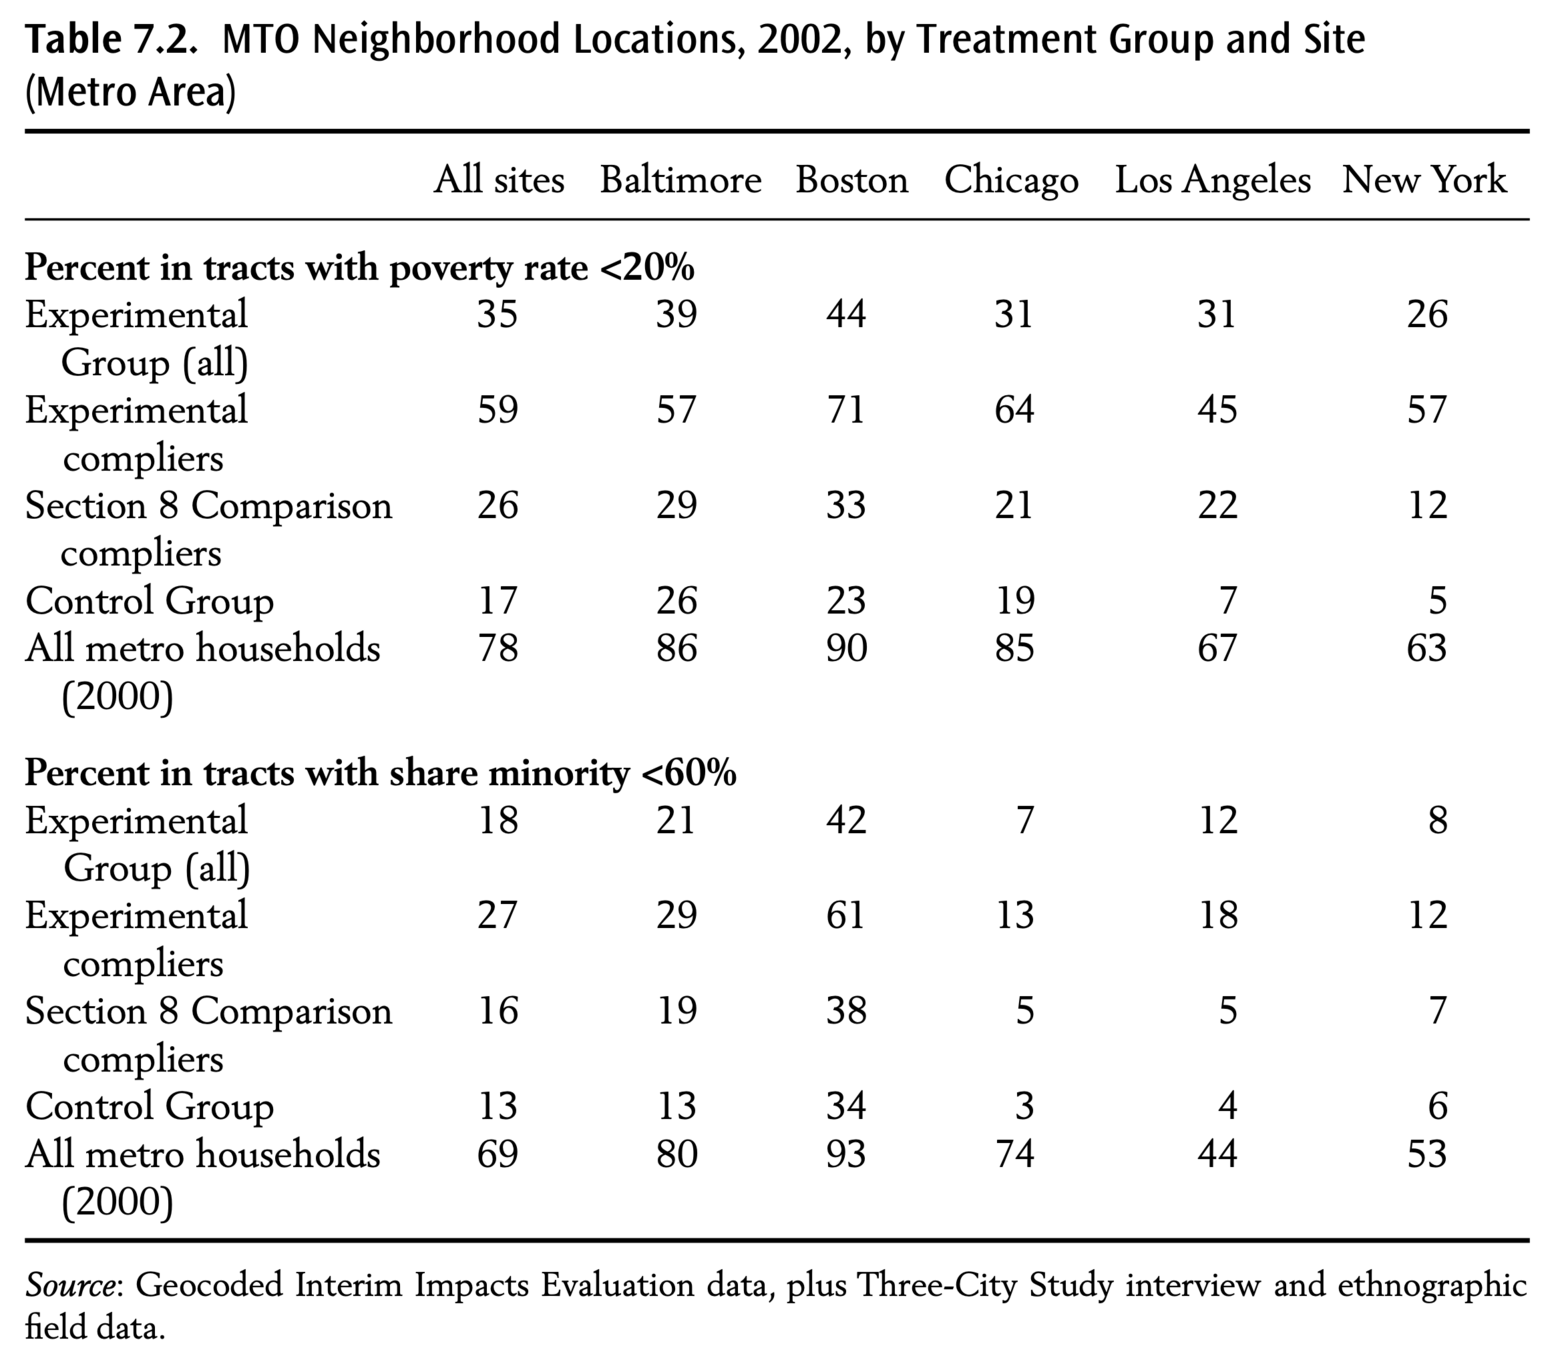
Between 1994-1998 4604 families from Baltimore, Boston, Chicago, New York, and LA were randomly assigned into one of the following 3 groups
Treatment Assignment
Experimental Voucher
A housing voucher that could only be used in a census tract with poverty rate below 10% & Housing Mobility Consultation
Section-8 Voucher
A housing voucher
Control
Retained access to public housing
After 1 year, experimental vouchers became Section 8 vouchers
Families had 4-6 months to lease an apartment and use their vouchers
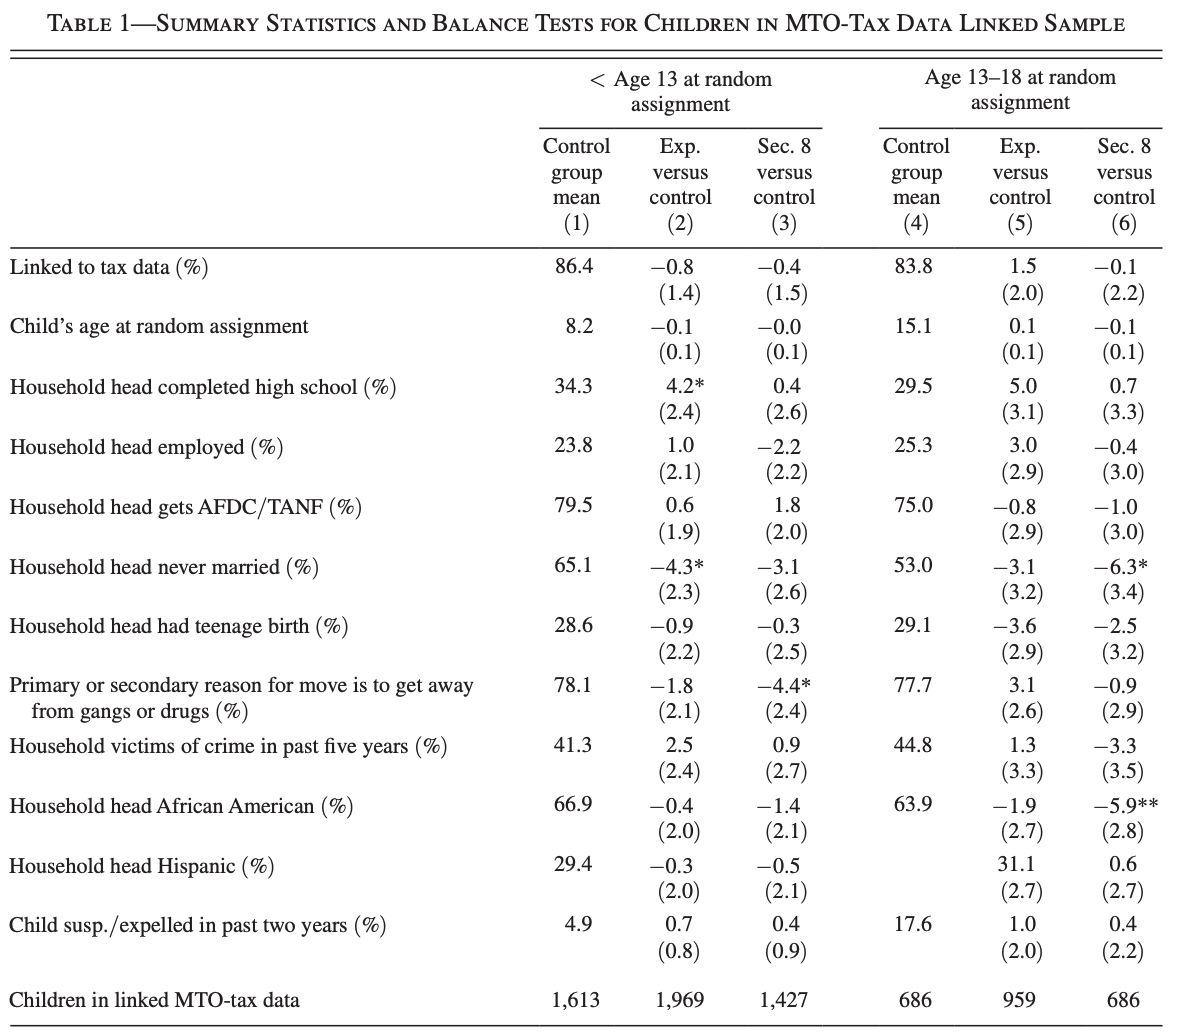
Check for Balance
Regression Models
Note this is a simplified version of the original regression
Intent-to-Treat
LATE
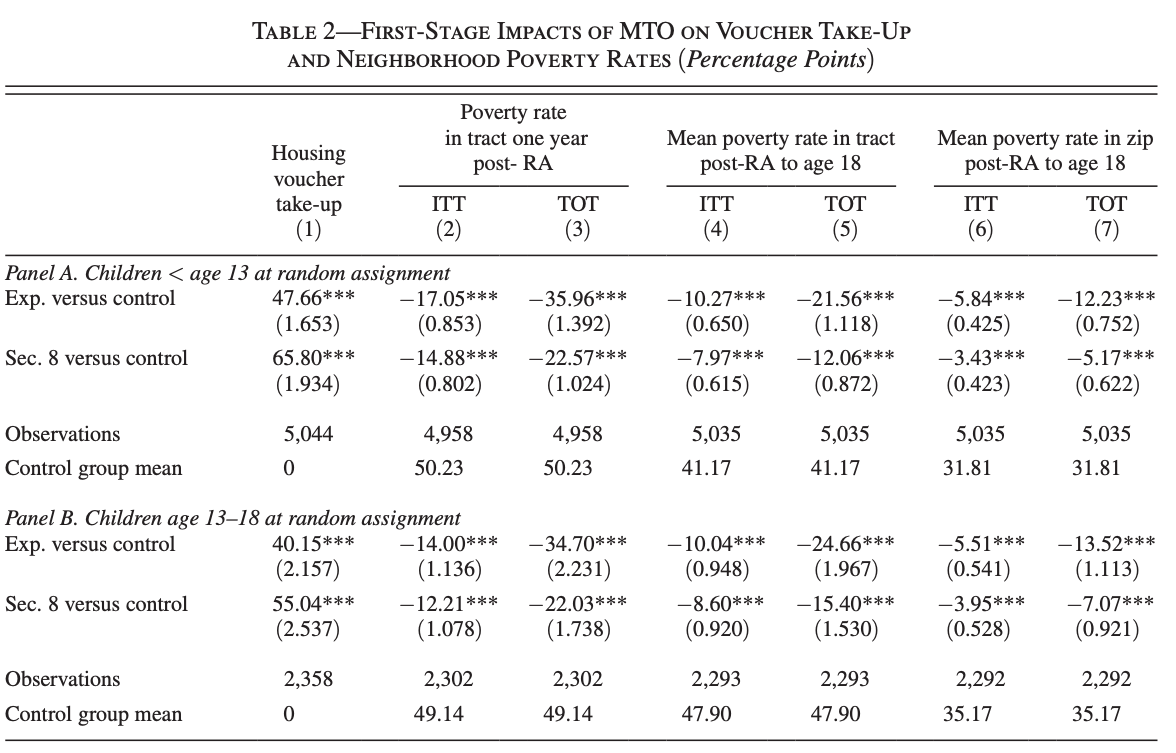
"The mean control group family was living in a very distressed census tract one year after RA, with a 50 percent poverty rate—2.92 standard deviations (SD) above the national average in the 2000 census national tract-poverty distribution"
First Stage
Intent to Treat (Effect of Instrument on Outcome)
LATE (Effect of Treatment on Outcome for Compliers)
Why do the take-up rates differ based on the age of the child? (Families with older children are less likely to have a lease with a voucher)
Questions
What fraction of the control group eventually moves?
What's the typical distance of a move?
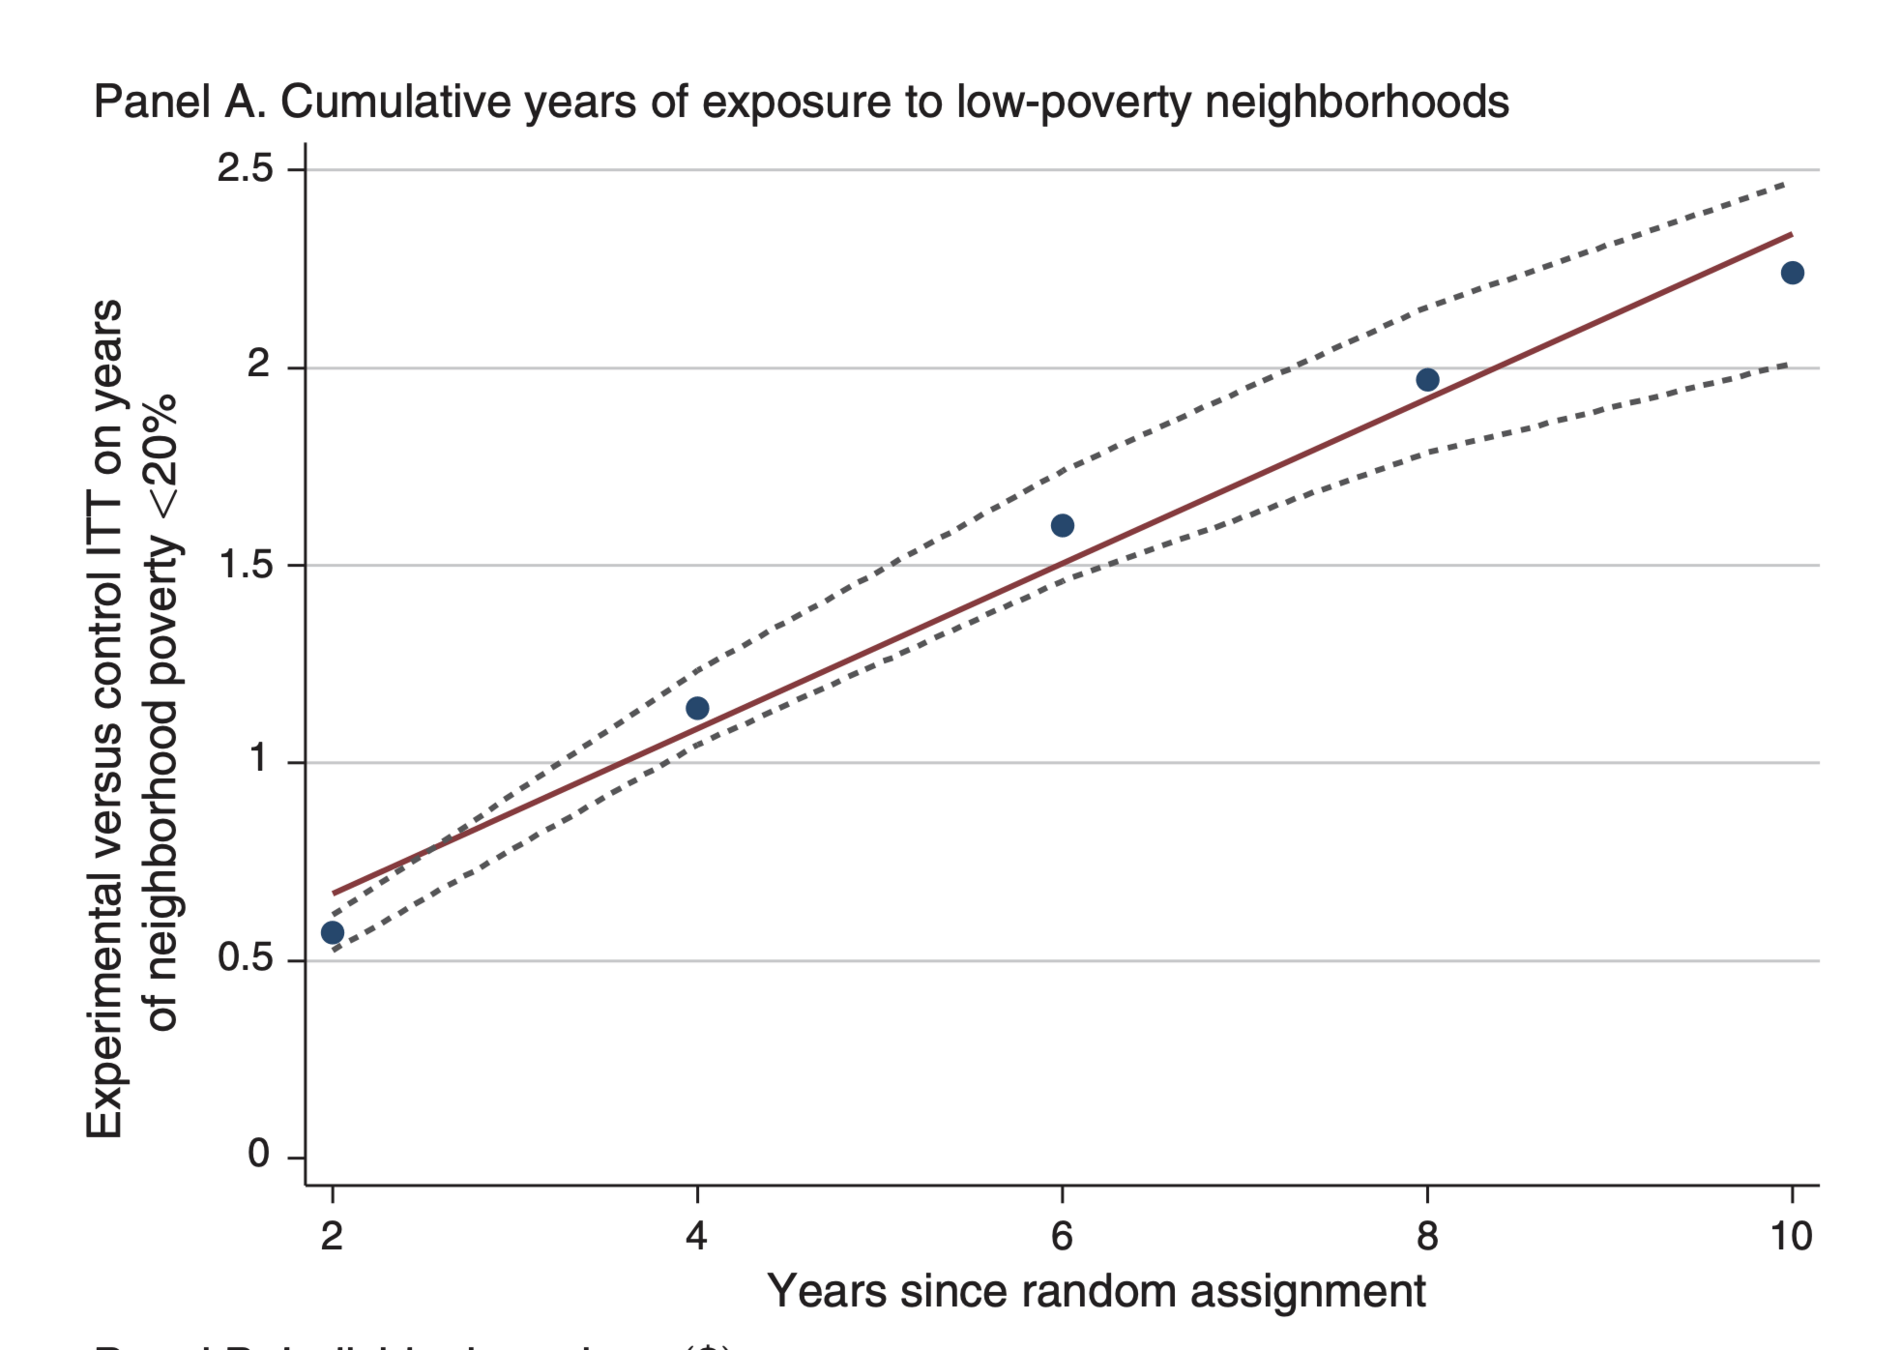
Effect of Experimental Voucher on Exposure to low-poverty
* Would be nice if the the axes had the same scale
Questions
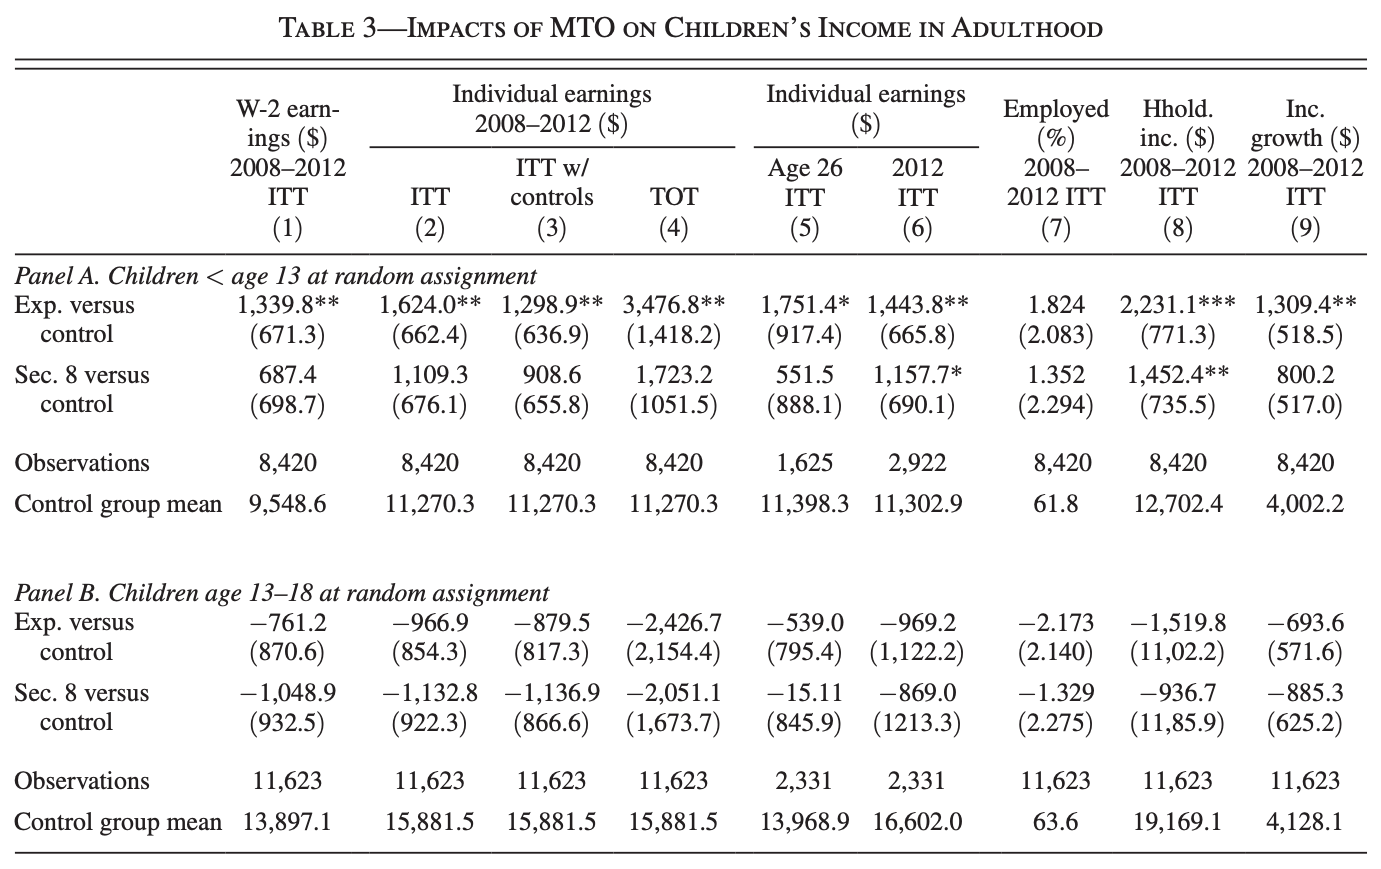
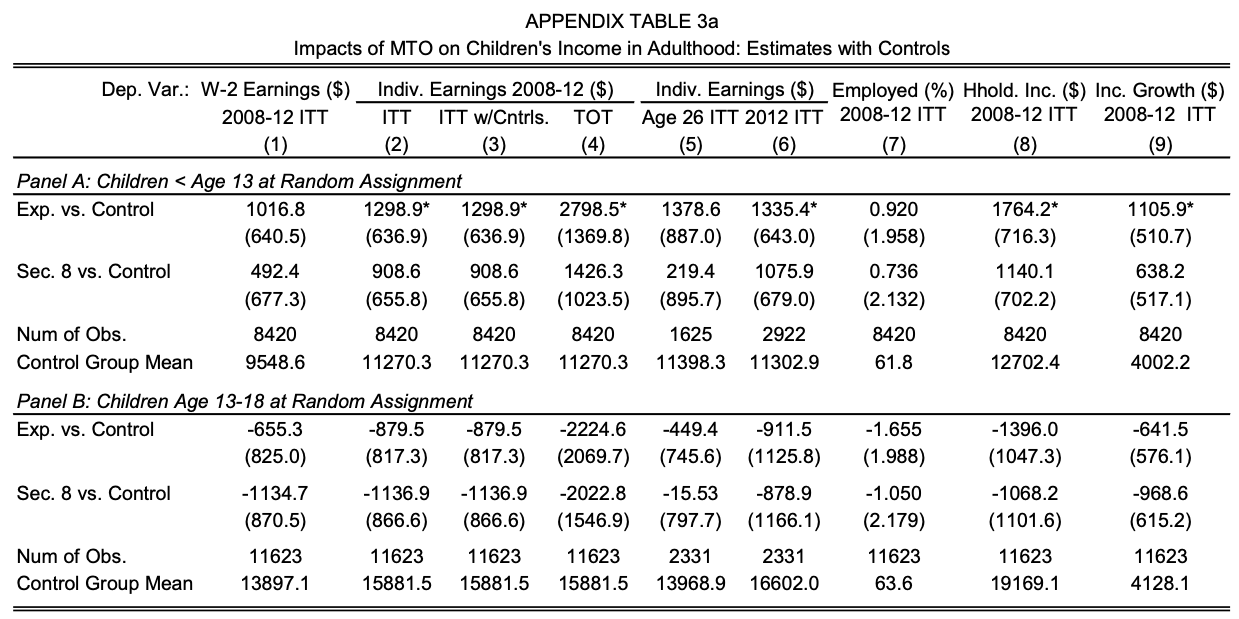
Why are regression results with controls the preferred specification?
Is the control employment mean surprisingly high?
Who is given greater weight without the controls
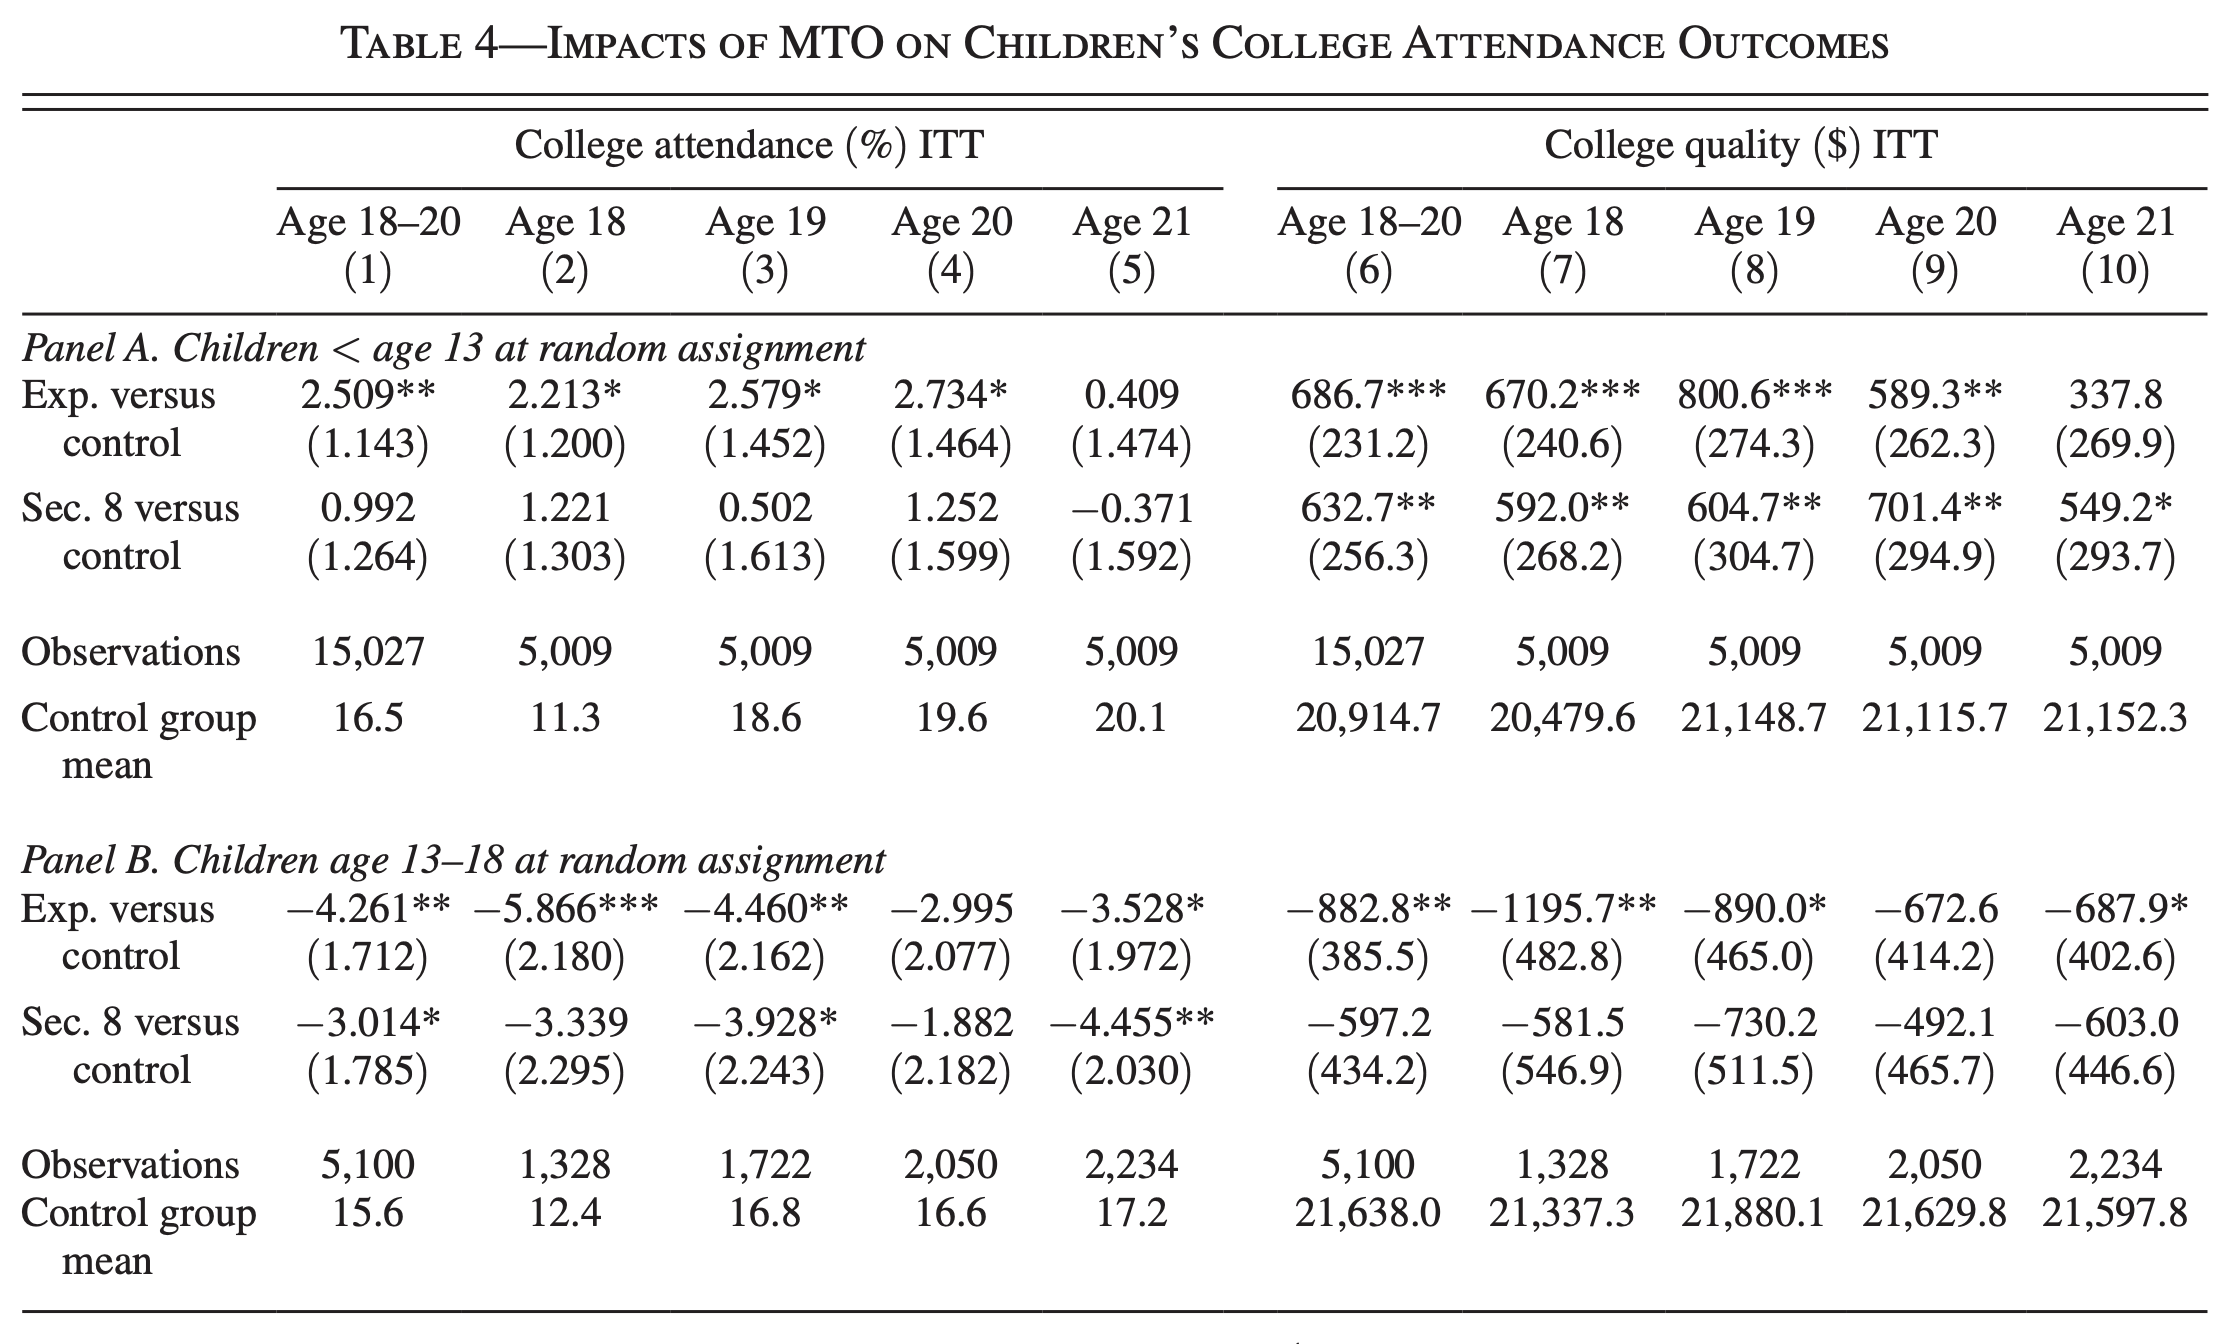
Comparing the control groups, we see that college attendance rate is lower in the older group
Is the impact on graduation lower than on attendance?
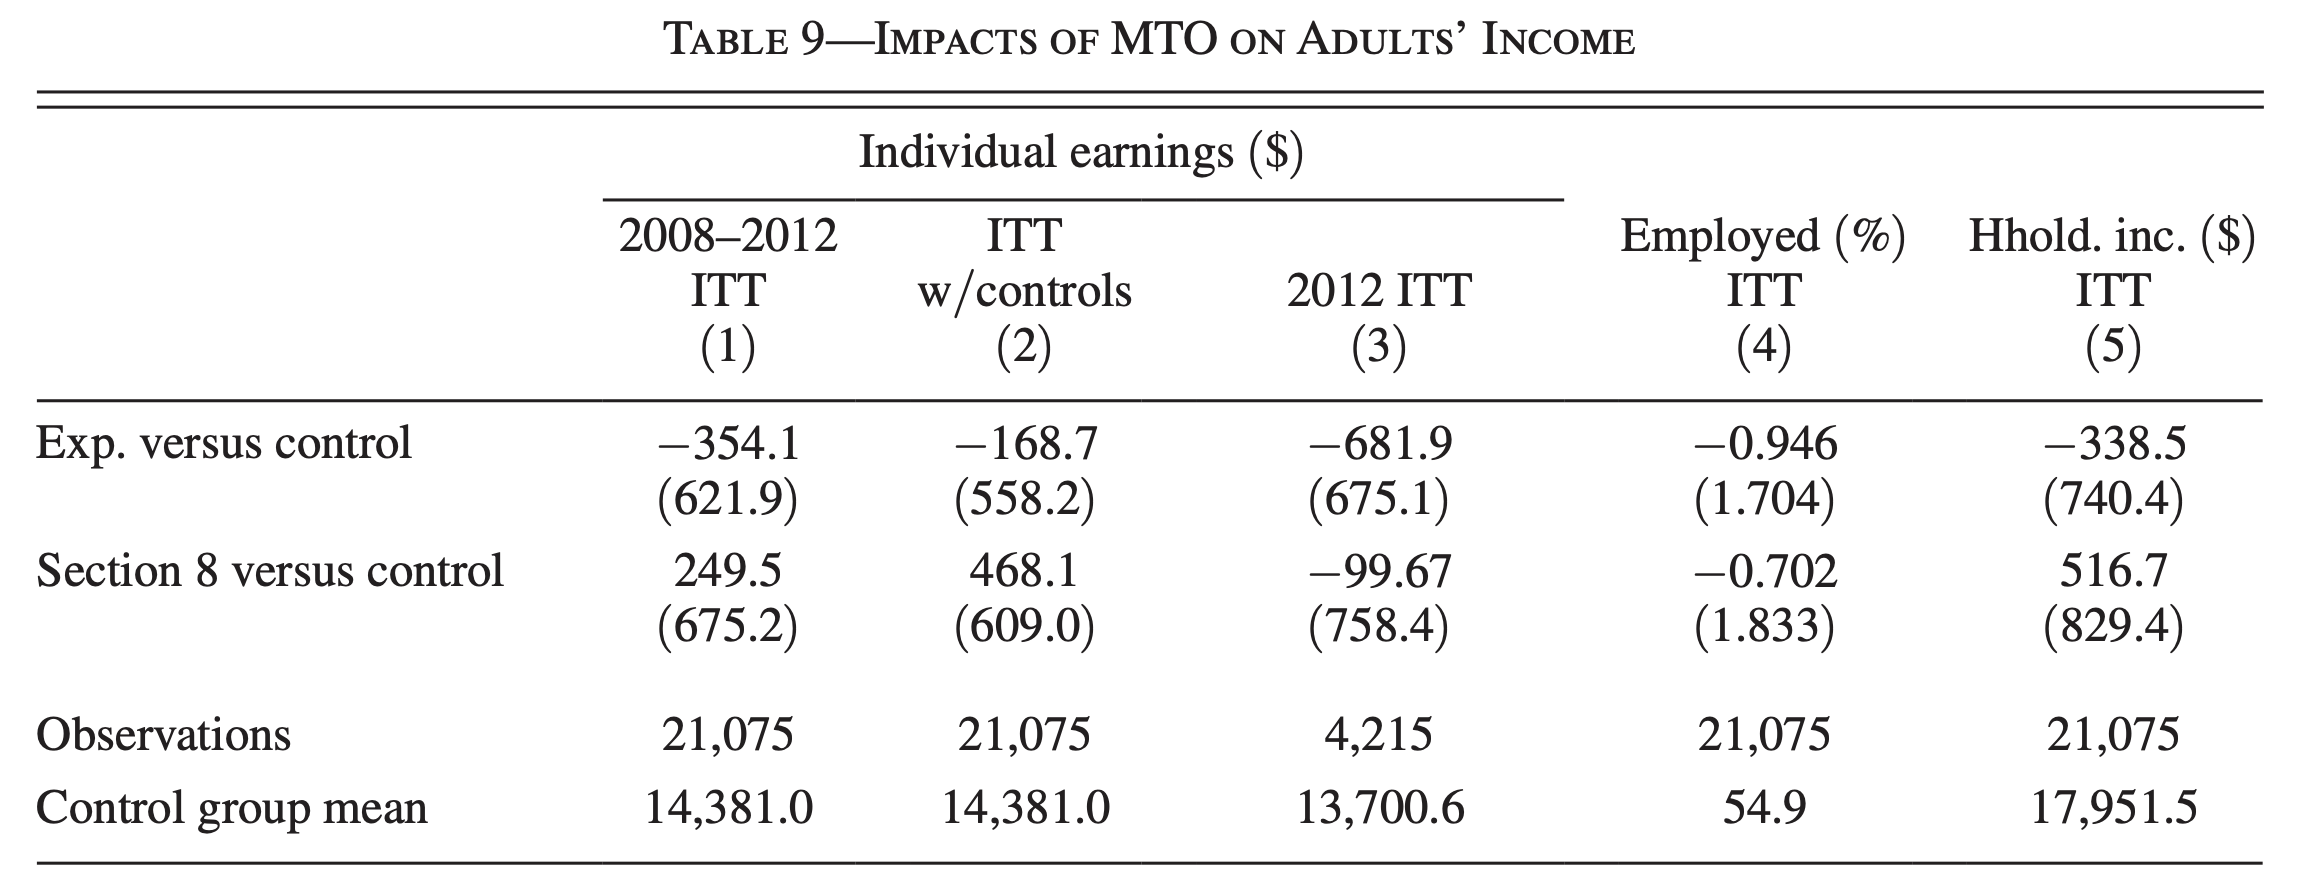
"all of the estimates are small and are not significantly different from zero"
To do
Show that the ITT estimate can be expressed as the sample average
Add overview slide
Illustrate how text could be use to explain which observations receive greater weight without controls