Fun way to Understand Data Analysis by Scrapping Website.
By Promode

About Me
Pramod Dutta

4+ Year in Software Industry.
Blogger - http://scrolltest.com
Many Featured Article in Python Weekly.

Things we are using
-
Scrapping data from Website using Beautifulsoup
- Data Analysis using Pandas & Data Visualization using MatplotLib


What is Web-Scrapping ?


Introduction to BeautifulSoup
Beautiful Soup is a Python library for pulling data out of HTML and XML files.
html_doc = '<html><title>Hi</title><body><p>Awesome BS4</p><a href='1'>First</a>
<a href='2'>Second</a></body></html>

from bs4 import BeautifulSoup
soup = BeautifulSoup(html_doc, 'html.parser')


soup.title
# Hi

soup.p
# <p>Awesome BS4</p>

soup.find_all('a')
# 1,2
Which One to Watch First -
Let see some movies Data From 2000-2017 From - IMDB
- Objective is to see the Average Rating
- Maximum Rating
- Average Runtime of the Movie
- Year which has most High Rated Movies(Trend)
- .....
Parsing Code
from bs4 import BeautifulSoup
import urllib2
def main():
    print("**======  Data Extracting from imdb -- by Promode  =====**")
    testUrl = "http://www.imdb.com/search/title?at=0&count=100&\
    groups=top_1000&release_date=2000,2017&sort=moviemeter"
    pageSource = urllib2.urlopen(testUrl).read()
    soupPKG = BeautifulSoup(pageSource, 'lxml')
    titles = soupPKG.findAll("div",class_='lister-item mode-advanced')
    mymovieslist = []
    mymovies = {}
    for t in titles:
        mymovies = {}
        mymovies['name'] = t.findAll("a")[1].text
        mymovies['year'] = str(t.find("span", "lister-item-year").text).replace('','')
        mymovies['rating'] = float(str(t.find("span", "rating-rating").text)\
        .replace('','')[0:-3])
        mymovies['runtime'] = t.find("span", "runtime").text
        mymovieslist.append(mymovies)
    print mymovieslist
if __name__=="__main__":
    main()
Data looks Like
[
 {
'rating': 8.1,
'runtime': '136 min',
'name': u'Guardians of the Galaxy Vol. 2',
'year': '(2017)'
 },

{'rating': 9.0, 'runtime': '167 min', 'name': u'Bahubali 2: The Conclusion', 'year': '(2017)'},
{'rating': 8.0, 'runtime': '104 min', 'name': u'Get Out', 'year': '(I) (2017)'},
{'rating': 8.1, 'runtime': '121 min', 'name': u'Guardians of the Galaxy', 'year': '(2014)'},
{'rating': 7.7, 'runtime': '129 min', 'name': u'Beauty and the Beast', 'year': '(2017)'},
{'rating': 8.4, 'runtime': '137 min', 'name': u'Logan', 'year': '(2017)'},
{'rating': 7.9, 'runtime': '133 min', 'name': u'Rogue One', 'year': '(2016)'} .....]

With Pandas & Metaplotlib
from bs4 import BeautifulSoup
import urllib2
def main():

    .....
    df = pd.DataFrame.from_dict(mymovieslist)
    df.plot()
    plt.show()
    df =df.set_index('rating')
    print df


if __name__=="__main__":
    main()
DataFrame : Rating is Set as Index

Maximum Rating - Sorted by Rating

Year Vs Rating Trend

Average Rating
print "Avg Rating of Movies From 2000-2017 ON IMDB : "+ str(df.mean())
Now We have a List to Watch Movies..

Thanks
http://slides.com/pramoddutta1/deck/fullscreen
What is Pandas
High-performance, easy-to-use data structures and data analysis tools for the Python programming language.
Pandas .. Continues.
-
Made by Panel Data System.
-
Used by Lots of Companies(Prod ready lib).
-
Built on the top of numpy.
-
Supports , Sorting, Cleaning, Munging, Analysing and Modeling the data.


What is DataFrame in Pandas
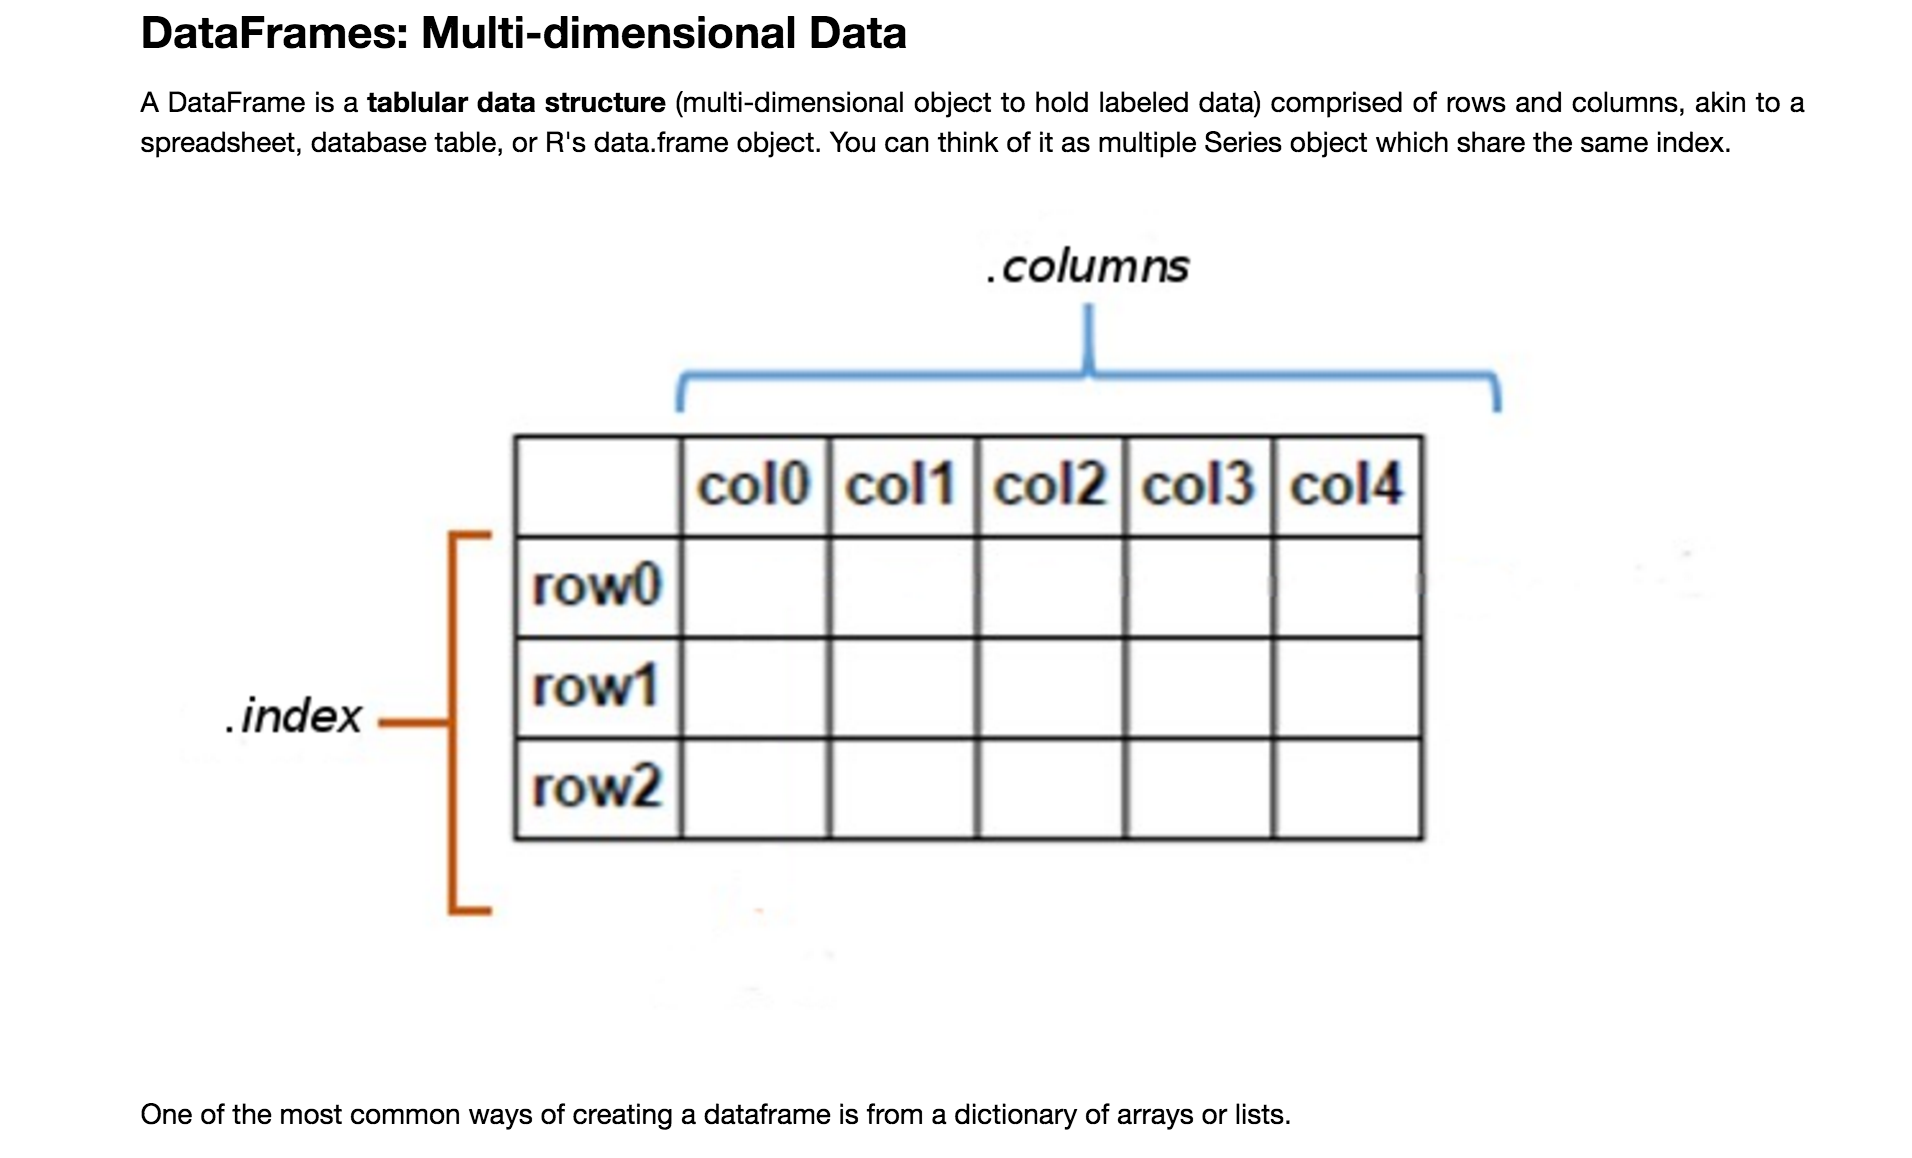
Demo and Basics Commands
Install the Requirments
-
virtualenv .
-
source /bin/activate
-
pip install jupyter
-
pip install pandas
-
pip install matplotlib