Book 4. Liquidity and Treasury Risk
FRM Part 2
LTR 1. Liquidity Risk
Presented by: Sudhanshu
Module 1. Trading Liquidity Risk
Module 2. Funding Liquidity Risk
Module 3. Liquidity Black Holes and Positive Feedback Training
Module 1. Trading Liquidity Risk

Topic 1. Introduction to Liquidity
Topic 2. Market Price Conventions
Topic 3. Cost of Liquidation
Topic 5. Cost of Liquidation: Example (Normal Market)
Topic 6. Cost of Liquidation: Example (Stressed Market)
Topic 4. Liquidity VaR (LVaR) and Positions Unwinding Speeds
Topic 1. Introduction to Liquidity
-
Liquidity vs. Solvency:
-
Solvency: Assets exceed liabilities (positive equity).
-
Liquidity: The company's ability to meet its obligations as they come due.
-
-
Trading Liquidity: Relates to the ease with which an investment can be sold.
-
High Liquidity: Large, publicly traded equity securities.
-
Low Liquidity: Non-investment grade debt, emerging market equities.
-
-
Sale Price is a Function of:
-
Estimated value (mid-market price)
-
Speed of sale
-
Quantity being sold
-
Overall economic environment
-
-
Predatory Trading: Market participants execute similar trades to profit, knowing another entity needs to liquidate a large position, driving the price against the liquidating entity.
-
Bid Price, Offer Price and Mid-market Price:
-
Bid Price: Price at which an asset is sold (lower value)
-
Offer Price: Price at which an asset is purchased (higher value)
-
Mid-Market Price: The fair price, halfway between the bid and offer.
-
-
Spread: The difference between bid and offer prices. It increases with the order size.
-
Types of Spread:
-
Proportional Bid-Offer Spread
-
-
-
-
Dollar Bid-Offer Spread
-
p = Offer Price - Bid Price
-
-
Topic 2. Market Price Conventions
-
Cost of Liquidation (Normal Market):
-
-
where
- α is the mid-market or dollar value of the position.
-
Cost of Liquidation (Stressed Market):
-
-
-
where
-
μi and σi are mean and std deviation of proportional bid-offer spread
-
γ: Confidence level (z-score for one tail, e.g., 1.645 for 95%).
-
αi: Mid-market value of position i.
-
-
This formula assumes a normal distribution for bid-offer spreads and a strong positive correlation between assets during market stress.
-
- Larger positions create more liquidity risk through widening bid-offer spreads, so setting trade size limits and holding more smaller positions reduces liquidity trading risk.
Topic 3. Cost of Liquidation
Example: A company has two equity positions. The first is 2 million shares of ABC Company with a bid of $25.50 and an offer of $27.00. The second holding is 500,000 shares of XYZ Company with a bid of $45.00 and an offer of $46.50. Calculate the mid-market value of each position, the proportional bid-offer spread, and the cost of liquidation in a normal market.
-
Solution: The calculations for both companies are shown in below table
-
-
-
-
-
-
-
Cost of liquidation: [($52,500,000*0.05714)/2] + [($22,875,000*0.03279)/2] = $1,874,961
-
Topic 4. Cost of Liquidation: Example (Normal Market)
| Company | ABC | XYZ |
|---|---|---|
| Bid-offer spread | $27.00 − $25.50 = $1.50 | $46.50 − $45.00 = $1.50 |
| Mid-market Price | ($25.50 + $27.00)/2 = $26.25 | ($45.00 + $46.50)/2 = $45.75 |
| Mid-market Value | $26.25*2 million shares = $52,500,000 | $45.75*500,000 shares = $22,875,000 |
| Proportional bid-offer spread | $1.50 / $26.25 = 0.05714 | $1.50 / $45.75 = 0.03279 |
Example: Assume the same information as the previous example. In addition, assume the mean and standard deviation for the bid-offer spread for both securities is $1.5 and $2.5, respectively. Calculate the cost of liquidation at a 95% level of confidence (1.645 z-score for one tail).
-
Solution: The calculations for both companies are shown in below table
-
-
-
-
-
-
Cost of liquidation: {[$52,500,000*(0.05714 + 1.645*0.09524)]/2} + {[$22,875,000*(0.03279 + 1.645*0.05464)]/2} = $7,015,577
-
Topic 5. Cost of Liquidation: Example (Stressed Market)
| Company | ABC | XYZ |
|---|---|---|
| Mean, proportional bid-offer spread | $1.5/$26.25 = $0.05714 | $1.5/$45.75 = $0.03279 |
| Standard deviation, proportional bid-offer spread | $2.5/$26.25=0.09524 | $2.5/$45.75=0.05464 |
Practice Questions: Q1
Q1. Rigues Bank owns 5 million shares of a stock with a bid price of $10.50 and an offer price of $12.75. The cost of liquidation in normal market conditions is closest to:
A. $2.813 million.
B. $5.625 million.
C. $6.228 million.
D. $11.250 million.
Practice Questions: Q1 Answer
Explanation: B is correct.
For the stock owned by Rigues, the mid-market value is the middle point between the bid and offer price multiplied by the number of shares: $11.625 × 5 million shares = $58,125,000.
The proportional bid-offer spread is equal to the difference between the bid and offer prices divided by the mid-market value: $2.25/$11.625 = 0.193548. The cost of liquidation is therefore $58,125,000 × (0.193548/2) = $5,625,000.
- LVaR Definition: Estimates Value at Risk (VaR) while explicitly taking the cost of unwinding positions (liquidity risk) into account.
-
LVaR (Normal Market): VaR plus the normal market cost of liquidation
-
-
LVaR (Stressed Market): VaR plus the stressed market cost of liquidation
-
-
Trader's Liquidation Decision:
-
Quick Unwind: Reduces risk of mid-market price moving against the trader, but increases risk of widening spread.
-
Slow Unwind: Increases market risk, but decreases risk associated with widening spreads.
-
Trader's Objective (to minimize VaR):
-
Topic 6. Liquidity VaR (LVaR) and Positions Unwinding Speeds
Module 2. Funding Liquidity Risk
Topic 1. Liquidity Funding Risk
Topic 2. Sources of Liquidity
Topic 3. Case Studies
Topic 4. Liquidity Risk Ratios
Topic 5. BIS Principle for Sound Liquidity Risk Management
Topic 1. Liquidity Funding Risk
-
Definition: A measure of a firm's ability to meet its cash needs as they come due (i.e., its ability to acquire funding).
-
Key Causes of Risk:
-
Weak financial performance.
-
Liquidity stresses resulting in hesitant investors.
-
Funding mismatches (e.g., using short-term instruments to fund long-term requirements).
-
-
Predictability:
-
Some obligations are predictable (e.g., coupon payments).
-
Others are hard to forecast (e.g., customer withdrawals).
-
Topic 2. Sources of Liquidity
-
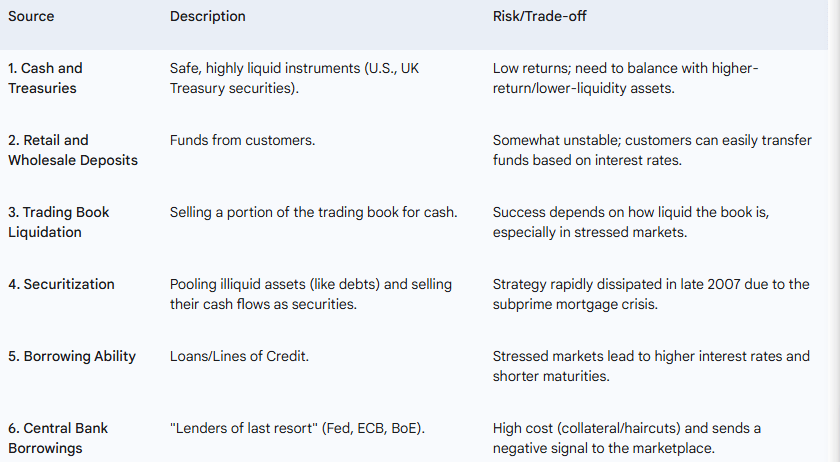
A financial institution has the following six primary sources of liquidity:
Practice Questions: Q1
Q1. Which of the following statements accurately reflects liquidity management for a financial institution?
A. Investments in Treasury securities help a bank increase its risk and return profile.
B. Stability in retail deposits over the years has enhanced bank liquidity.
C. Central bank borrowings are relatively cheap ways for banks to stay afloat.
D. Stressed markets can limit the effectiveness of trading book liquidation strategies.
Practice Questions: Q1 Answer
Explanation: D is correct.
Stressed markets create liquidity challenges, and trading book liquidations that may be effective in normal market conditions may be heavily compromised in stressed market conditions. Treasury investments reduce risk, but that comes with lower expected return. Retail deposits have become less stable, as investors can easily move their funds across banks as they search for higher interest rates. Central bank borrowings are costly, as they come with a high interest rate, a haircut, and a potentially negative signal to the market.
Topic 3. Case Studies
-
Northern Rock (2007-2009)
-
Background: British bank heavily involved in mortgage lending, relying on short-term debt for funding.
-
The Crisis: Investors became resistant to lending to banks after the subprime crisis.
-
The Failure: Went to the Bank of England for emergency funding. When the news broke, a massive bank run led to £2 billion in customer withdrawals in a week.
-
Outcome: Emergency borrowing reached £25 billion; the bank was nationalized.
-
Lesson: Mismatched funding (short-term liabilities funding long-term assets) is extremely dangerous under stress.
-
-
Ashanti Goldfields (1999)
-
Background: Gold mining company that sold gold forwards (short positions) to hedge against price declines.
-
The Crisis: Central banks limited gold sales, causing gold demand and prices to jump over 25%.
-
The Failure: The short positions led to massive margin calls that could not be met in cash.
-
Outcome: Forced restructuring, mine sale, and equity dilution.
-
Lesson: Illiquidity of underlying assets was misaligned with the immediate need for cash to meet margin calls.
-
-
Metallgesellschaft (MG) (1993)
-
Background: German conglomerate sold long-term (5-10 year) fixed-price supply contracts, hedging with short-term futures contracts (stack-and-roll hedge).
-
The Crisis: Oil prices fell, causing the long futures positions to require large, immediate margin calls (a cash drain).
-
The Failure: Management closed out both the contracts and the hedge, leading to a loss of over $1.3 billion.
-
Lesson: Similar to Ashanti Goldfields, immediate cash outflows (margin calls) were misaligned with the illiquid nature or timing of cash inflows.
-
Topic 3. Case Studies
Topic 4. Liquidity Risk Ratios
-
Liquidity risk requirements introduced by Basel III include the liquidity coverage ratio (LCR) and the net stable funding ratio (NSFR).
-
Liquidity Coverage Ratio (LCR)
-
Purpose: Ensures the bank has enough High-Quality Liquid Assets (HQLA) to survive a significant 30-day stress scenario.
-
-
-
Stressed 30-day period includes 100% loss of wholesale funding, line of credit drawdowns, partial loss on deposits, three-notch downgrade of credit ratings and higher haircuts on secured funding.
-
- Net Stable Funding Ratio (NSFR)
-
Purpose: Ensures long-term assets are funded with sufficiently stable sources of funding.
-
-
- Available Stable Funding (ASF): Derived by applying a factor to each funding category (e.g., long-term debt, sticky deposits).
-
Required Stable Funding (RSF): Based on the liquidity characteristics of the bank's assets and off-balance sheet items
-
Practice Questions: Q2
Q2. Which of the following factors must be taken into account in the net cash outflows in a 30-day period component of the liquidity coverage ratio (LCR) as required by Basel III?
A. Complete losses on deposits.
B. Partial losses of wholesale funding.
C. Larger haircuts on secured funding.
D. Two notch reductions in credit ratings.
Practice Questions: Q2 Answer
Explanation: C is correct.
Higher haircuts on secured funding is one of the components that needs to be taken into account in the LCR calculation, along with partial losses on deposits, 100% losses on wholesale funding, line of credit drawdowns, and three notch reductions in credit ratings.
- Developed by the Bank for International Settlements (BIS) after the 2007–2009 crisis (total 17 principles).
-
Governance & Strategy
- Fundamental Principle: Must have a comprehensive liquidity risk management framework with sufficient unencumbered liquid assets to withstand high stress events.
- Risk Tolerance: Liquidity risk tolerance must be aligned with the bank’s role and business strategy.
- Board Responsibility: The Board must approve strategies, policies, and practices at least annually and ensure effective management by senior staff.
- Pricing & Performance: Liquidity costs, benefits, and risks must be incorporated into internal pricing, performance measurement, and new product approval.
Topic 5. BIS Principle for Sound Liquidity Risk Management
2. Measurement and Management
-
Cash Flow Projections: A sound framework for projecting cash flows is essential for capturing and managing risk.
-
Monitoring & Control: Actively monitor and control liquidity risk exposures across business lines, legal entities, and currencies.
-
Funding Diversification: Effectively diversify funding sources, maintain strong relationships with providers, and evaluate capacity to raise funds quickly.
-
Intraday Liquidity: Manage intraday liquidity positions to meet settlement and payment obligations under normal and stressed conditions.
3. Stress Testing and Contingency
-
Collateral Management: Actively manage collateral, distinguishing between encumbered (pledged) versus unencumbered (free) assets.
-
Stress Tests: Conduct regularly to identify strains and adjust strategies; outcomes must align current exposures with risk tolerances.
-
Contingency Funding Plan (CFP): A formal plan must be in place to articulate how liquidity shortfalls will be met in emergencies. Must be regularly tested and updated.
-
Liquid Assets: Maintain an identified portfolio of High Quality, Unencumbered Liquid Assets readily available without regulatory or legal impediments.
Topic 5. BIS Principle for Sound Liquidity Risk Management
4. Disclosure and Supervision
-
Disclosure: Regular, public disclosures allow market participants to assess the bank's liquidity position and the strength of its framework.
-
Supervisory Assessment: Supervisors must comprehensively assess the bank's liquidity position and its risk management framework.
-
Intervention: Supervisors must be ready to intervene to address deficiencies in a bank's liquidity position or risk processes.
-
Communication: Regular communication and increased information sharing between supervisors and public authorities are needed, especially during market stress.
Topic 5. BIS Principle for Sound Liquidity Risk Management
Module 3. Liquidity Black Holes and Positive Feedback Training
Topic 1. Liquidity Black Holes and Trader Behavior
Topic 2. Reasons for Positive Feedback Trading
Topic 1. Liquidity Black Holes and Trader Behavior
- Liquidity black holes occur when market liquidity dries up because all participants want to take the same side of a transaction (all buying or all selling), also known as a crowded exit.
- Price declines frequently trigger sell-offs where liquidity disappears, forcing investors to sell at prices far below assets' implicit values.
- Trader behavior drives market liquidity through two categories: positive feedback traders (buy when prices rise, sell when prices fall) and negative feedback traders (buy when prices fall, sell when prices rise).
- Liquid markets have a strong balance of buyers and sellers with negative feedback traders dominating, as their contrarian behavior (buying during declines, selling during increases) keeps prices relatively stable.
- When positive feedback traders dominate, their momentum-following behavior (buying as prices rise, selling as prices decline) destabilizes markets and creates illiquidity.
-
Stop Loss Rules: Automatic sales are triggered when asset prices fall below predetermined levels, limiting trader losses but amplifying downward price momentum
-
Trend and Breakout Trading:
-
Trend traders buy during price increases and sell during declines, reinforcing existing price movements.
-
Breakout traders execute similar strategies when prices breach specific trading ranges.
-
-
Predatory Trading: Traders exploit knowledge of large upcoming sales by taking short positions to profit from anticipated price drops.
-
Options Hedging by Short Sellers
- Short call positions require buying the underlying asset after price increases; short put positions require selling after price decreases.
- Large institutional short positions pose liquidity risks when these hedges are executed simultaneously.
Topic 2. Reasons for Positive Feedback Trading
-
Synthetic Options and Portfolio Insurance
- The 1987 stock market crash exemplified positive feedback risks when portfolio insurance strategies created synthetic puts on over $60 billion in assets.
- Trading rules mandated buying during market rises and selling during declines, creating a self-reinforcing spiral.
- Black Monday resulted when $12 billion in required sales over three days (with only $4 billion executed by Friday close) led to massive Monday liquidations.
-
Margin Calls
- Leveraged investors facing unfavorable position movements must provide additional collateral or liquidate positions.
- Forced liquidations accelerate existing price trends in the underlying assets.
-
Leveraging and Deleveraging Cycles
- Leveraging occurs when banks with excess liquidity extend credit more readily, increasing demand for assets and driving price increases.
- Rising asset prices boost collateral values, enabling additional borrowing in a self-reinforcing cycle.
- Deleveraging creates the opposite effect: tightened lending reduces asset demand, lowering prices and collateral values, which further restricts borrowing.
Topic 2. Reasons for Positive Feedback Trading
-
Irrational Exuberance and Asset Bubbles
- Term coined by Fed Chair Alan Greenspan regarding mid-1990s U.S. equity market surge, questioning whether fundamentals supported price growth.
- Self-reinforcing process: large asset purchases drive prices higher, generate profits, attract more investors, and push prices even higher while masking underlying risks.
- Similar pattern occurred in mid-2000s U.S. housing market, where massive year-over-year gains drew widespread participation until the bubble burst.
-
Regulatory Uniformity and Liquidity Black Holes
- Uniform global regulations can create liquidity black holes when all institutions respond identically to external events.
- Different institution types (banks, pension funds, life insurers) have distinct time horizons and risk profiles requiring differentiated regulatory approaches.
- Regulatory diversity prevents synchronized trading behavior, reducing the risk that all institutions must execute similar trades simultaneously and creating healthier market liquidity.
-
Example: LTCM Crisis (1998)
- The hedge fund's strategy of shorting liquid bonds and longing illiquid bonds collapsed when the Russian default widened price spreads.
- High leverage prevented LTCM from meeting margin calls, forcing position closures that further widened spreads and necessitated a Wall Street bailout to prevent systemic collapse.
Topic 2. Reasons for Positive Feedback Trading
Practice Questions: Q1
Q1. A highly liquid market tends to result from situations where:
A. stop loss rules take effect as prices decline.
B. negative feedback traders sell shares as prices rise.
C. positive feedback traders purchase shares as prices rise.
D. breakout trading occurs because of prices moving outside of a range.
Practice Questions: Q1 Answer
Explanation: B is correct.
Negative feedback traders who sell shares as prices rise will help to create liquidity and price stability in the market. Stop loss rules as prices decline will only accentuate the decline, reducing liquidity. Positive feedback traders who purchase more shares as prices rise and breakout trading strategies which build on the trend as prices move outside of a range also contribute to illiquidity.