Book 1. Market Risk
FRM Part 2
MR 17. Volatility Smiles
Presented by: Sudhanshu
Module 1. Implied Volatility
Module 2. Alternative Methods of Studying Volatility
Module 1. Implied Volatility
Topic 1. Put-Call Parity
Topic 2. Volatility Smiles
Topic 3. Foreign Currency Options
Topic 4. Equity Options

Topic 1. Put-Call Parity
-
Definition: Put-call parity is a no-arbitrage condition linking the prices of European call and put options to the underlying asset price and the present value of the strike price.
- Equation:
- Put-call parity is a no-arbitrage relationship that holds regardless of underlying asset distribution; does not require BSM's lognormal assumption.
-
Writing the put-call parity equation for market prices and BSM prices for options gives below equations
-
Subtracting the second equation from the first gives us:
- Thus, any deviation from BSM pricing is equal for calls and puts.
- Implied volatility equality: The above equation indicates that call and put options with identical strike and expiration must have equal implied volatilities, since any BSM pricing deviations affect both equally.
Practice Questions: Q1
Q1. The market price deviations for puts and calls from Black-Scholes-Merton prices indicate:
A. equivalent put and call implied volatility.
B. equivalent put and call moneyness.
C. unequal put and call implied volatility.
D. unequal put and call moneyness.
Practice Questions: Q1 Answer
Explanation: A is correct.
Put-call parity indicates that the implied volatility of a call and put will be equal for the same strike price and time to expiration.
Topic 2. Volatility Smiles
-
Implied Vs Historical Volatility
- Implied volatility: Derived from actual option prices using BSM model; may differ from historical volatility
- Strike-dependent: Traders allow implied volatility to vary by strike price
-
Volatility Smile Patterns
- Definition: Curves showing implied volatility as function of strike-to-stock price ratio
- Currency options: Display traditional "smile" pattern
- Equity options: Create "volatility skew" due to inverse relationship between strike and implied volatility
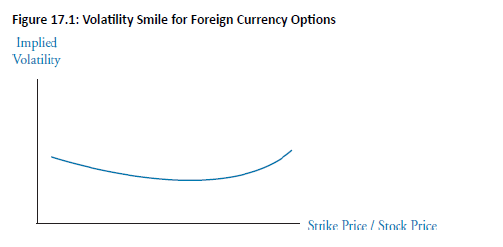
Topic 3. Foreign Currency Options
- Volatility Smile Pattern: Implied volatility is higher for deep in-the money (ITM) and out-of-the-money (OTM) options as compared to at-the-money (ATM) options.
-
Explanation: Exchange rate volatility is not constant and frequently jumps from one level to another, which increases the likelihood of extreme currency rate levels.
- Empirical evidence also indicates that FX distributions have fatter tails than lognormal.
- Effect on Long-Dated Options: Smiles are less pronounced due to mean-reverting nature of volatility.
Practice Questions: Q2
Q2. An empirical distribution that exhibits a fatter right tail than that of a lognormal distribution would indicate:
A. equal implied volatilities across low and high strike prices.
B. greater implied volatilities for low strike prices.
C. greater implied volatilities for high strike prices.
D. higher implied volatilities for mid-range strike prices.
Practice Questions: Q2 Answer
Explanation: C is correct.
An empirical distribution with a fat right tail generates a higher implied volatility for higher strike prices due to the increased probability of observing high underlying asset prices. The pricing indication is that in-the-money calls and out-of-the-money puts would be “expensive.”
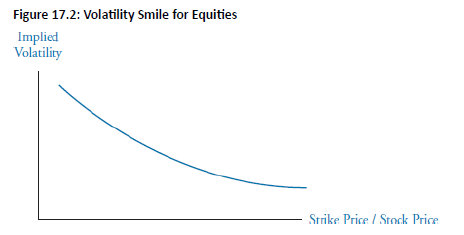
Topic 4. Equity Options
-
Volatility Skew Pattern (appears as smirk)
- Implied volatility is higher for low strike prices (i.e., ITM calls & OTM puts) and lower for high strike prices (ITM puts & OTM calls), creating a left-skewed distribution.
- This indicates that equity traders believe the probability of large down movements in price is greater than large up movements in price, as compared with a lognormal distribution.
-
Reasons
-
Leverage Effect: As equity value falls, leverage rises → higher volatility and vice versa.
-
Crashophobia: Fear of another market crash drives demand for protection → high premiums on deep OTM puts as they provide protection against significant drop in equity prices.
- The volatility skew tends to increase when equity markets decline, but is not as noticeable when equity markets increase in value.
-

Practice Questions: Q3
Q3. Compared to at-the-money currency options, out-of-the-money currency options exhibit which of
the following volatility traits?
A. Lower implied volatility.
B. A frown.
C. A smirk.
D. Higher implied volatility.
Practice Questions: Q3 Answer
Explanation: D is correct.
Away-from-the-money currency options have greater implied volatility than at the- money options. This pattern results in a volatility smile.
Practice Questions: Q4
Q4. Which of the following regarding equity option volatility is true?
A. There is higher implied price volatility for away-from-the-money equity options.
B. “Crashophobia” suggests actual equity volatility increases when stock prices decline.
C. Compared to the lognormal distribution, traders believe the probability of large down movements in price is similar to large up movements.
D. Increasing leverage at lower equity prices suggests increasing volatility.
Practice Questions: Q4 Answer
Explanation: D is correct.
There is higher implied price volatility for low strike price equity options. “Crashophobia” is based on the idea that large price declines are more likely than assumed in Black-Scholes-Merton prices, not that volatility increases when prices decline. Compared to the lognormal distribution, traders believe the probability of large down movements in price is higher than large up movements. Increasing leverage at lower equity prices suggests increasing volatility.
Module 2. Alternative Methods of Studying Volatility
Topic 1. Alternative Ways of Characterizing the Volatility Smile
Topic 2. Volatility Term Structure and Surfaces
Topic 3. Option Greeks
Topic 4. Price Jumps
Topic 1. Alternative Ways of Characterizing the Volatality Smile
-
The volatility smile is typically characterized by examining the relationship between implied volatility and the independent variable as Alternative methods involve replacing the independent variable:
-
Strike Price Only (X): This method uses only the strike price (X) as the independent variable. The resulting volatility smile is less stable because it is dependent on the asset price.
-
Ratio of Strike Price to Forward Price
-
This approach substitutes with the ratio of the strike price to the forward price for the underlying asset
-
The forward price must have the same maturity date as the options.
-
Traders sometimes view the forward price as a better gauge of at-the-money option prices since it displays the theoretical expected stock price.
-
-
Option's Delta (Δ):
-
This method replaces with the option's delta.
-
It allows traders to study volatility smiles for options other than European and American options
-
-
Topic 2. Volatility Term Structure and Surfaces
-
Volatility Term Structure: This is a list of implied volatilities as a function of time to expiration for ATM options.
-
When short-dated volatilities are low (historically), volatility tends to be an increasing function of maturity.
-
When short-dated volatilities are high, volatility tends to be a decreasing function of maturity.
-
This phenomenon is related to, but slightly different from, the mean-reverting characteristic often shown by implied volatility.
-
-
Volatility Surface: A volatility surface is a combination of a volatility term structure and volatility smiles (i.e., implied volatilities away-from-the-money).
-
It offers guidance in pricing options with any strike or maturity structure.
-
The primary objective for a trader is to maintain a pricing mechanism that generates option prices consistent with market pricing, regardless of the option pricing model used.
-
The volatility term structure and volatility surfaces are used to confirm or disprove a model's accuracy and consistency in pricing.
-
Topic 3. Option Greeks
-
Option Greeks: Measure option price sensitivity to underlying factors (e.g., delta, vega), assuming implied volatility remains constant as asset prices change.
-
The implied volatility of an option can affect the calculated option Greeks.
-
Movement Along the Curve: Increases (decreases) in equity price will result in decreases (increases) in the ratio of strike price to equity price and an increase (decrease) in volatility. For example, equity price increases move the option up the curve in Figure 17.2.
-
Movement of the Entire Curve: Equity prices and volatilities generally exhibit a negative correlation. As a result:
-
The entire curve will move down when equity prices increase.
-
The entire curve will move up when equity prices decrease.
-
-
Dominating Effect: When evaluating these two scenarios in practice, the effect from movements in the implied volatility curve (the second rule) tends to dominate movements along the existing curve (the first rule).
-
Minimum Variance Delta: A delta that incorporates movements in the implied volatility curve is known as the minimum variance delta. It can be noted that the delta used in the Black-Scholes-Merton model will be higher than the minimum variance delta.
-
Topic 3. Option Greeks
Practice Questions: Q1
Q1. When evaluating the impact of a volatility smile on the calculation of the option Greeks, which of the following statements is most likely correct?
A. If equity prices and volatilities are negatively correlated, equity price increases will move the option up the existing curve.
B. If equity prices and volatilities are positively correlated, equity price increases will move the entire option curve down.
C. The minimum variance delta will be higher than the Black-Scholes-Merton model delta.
D. When equity prices change, the effect from movements in the implied volatility curve up or down tends to dominate movements along the existing curve.
Practice Questions: Q1 Answer
Explanation: D is correct.
When equity prices change, the effect from movements in the entire volatility
curve tends to dominate movements along the curve.
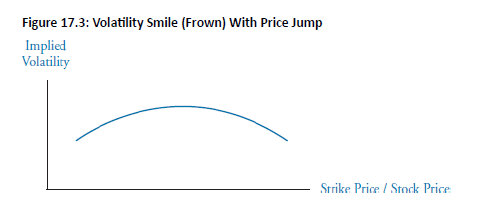
Topic 4. Price Jumps
-
Price jumps can occur, often due to the expectation of a significant news event, causing the underlying asset to move substantially up or down. This can cause the underlying distribution to become bimodal, while maintaining the same expected return and standard deviation as a standard unimodal distribution.
-
Impact on Implied Volatility: Implied volatility is affected by price jumps and the probabilities assumed for large up or down movements.
-
Resulting Shape: The usual result is that ATM options tend to have a higher implied volatility than either OTM or ITM options.
-
Volatility Frown: Instead of a volatility smile, price jumps would generate a volatility frown, as illustrated in Figure 17.3.
-