Book 2. Quantitative Analysis
FRM Part 1
QA 14. Machine Learning Methods
Presented by: Sudhanshu
Module 1. Machine Learning and Data Preparation
Module 2. Principal Components Analysis and K-Means Clustering
Module 3. Methods of Prediction and Sample Splitting
Module 4. Reinforcement Learning And Natural Language Processing
Module 1. Machine Learning and Data Preparation

Topic 1. Machine Learning vs. Classical Econometrics
Topic 2. Supervised, Unsupervised, and Reinforcement Learning Models
Topic 3. Data Preparation and Cleaning
Topic 1. Machine Learning vs. Classical Econometrics
-
Machine Learning (ML): Models recognize data patterns for practical applications.
- Designed for extremely large data volumes (big data).
- Offers greater flexibility and wide range of specifications (e.g., capturing non-linear interactions).
- Data dictates model inclusion; no specific hypothesis testing from an analyst.
- Effective when financial theory doesn't dictate variable choice or when linear specifications are undetermined.
- Uses flexible functional forms for complex (potentially non-linear) variable interactions.
-
Classical Econometrics: Economic and/or financial theory drives the data-generating process.
- Analyst chooses model and variables; computer algorithm estimates parameters and tests significance.
- Analyst determines if data supports expected outcome.
- Terminology: Uses "Independent Variables" and "Dependent Variables".
Practice Questions: Q1
Q1. Compared to traditional statistical methodologies, machine learning provides all of the following benefits except:
A. greater flexibility.
B. there is no need to scale the data.
C. the ability to manage large volumes of data.
D. the capacity to capture non-linear transactions.
Practice Questions: Q1 Answer
Explanation: B is correct.
Many machine learning models require the need to scale the data used in the model. Common techniques for doing so include standardization and normalization. Relative to traditional statistical models, machine learning models provide greater flexibility, can manage large amounts of data, and can potentially capture non-linear transactions.
Topic 2. Supervised, Unsupervised, and Reinforcement Learning Models
-
Supervised Learning: Used to predict the value of a variable (e.g., car value) or classify an observation (e.g., sports game outcome).
- Algorithm learns using "labeled data" (e.g., for value of car features, car make, model, year, size, engine type, etc are used).
- Can predict variable values in time-series or cross-sectional scenarios.
-
Unsupervised Learning: Involves pattern recognition in data with no specific target.
- May involve data clustering and identifying a small group of explanatory factors.
- Not used for predictions, but useful for characterizing and learning dataset structure.
- Example: An internal auditor evaluating company transactions to identify areas for review.
-
Reinforcement Learning: Incorporates a trial-and-error approach for decision-making in a changing environment.
- Often used in risk management for large block trading, hedging derivatives portfolios, or managing investment portfolios.
Practice Questions: Q2
Q2. The compliance manager at a bank uses machine learning approaches to review journal entries posted to the bank’s general ledger. In particular, she is concerned with employees using the wrong ledger accounts to record transactions. This type of machine learning is best categorized as:
A. supervised learning.
B. unsupervised learning.
C. reinforcement learning.
D. linear regression analysis.
Practice Questions: Q2 Answer
Explanation: B is correct.
Unsupervised learning is used in situations like this where a compliance manager wishes to learn more about the data but is not using it for predictive purposes. While supervised learning and reinforcement learning are established methodologies, linear regression is not an applicable machine learning category.
Topic 3. Data Preparation and Cleaning
-
Two primary methods to achieve scale consistency: standardization and normalization
-
Standardization: Used to create a scale for measuring variables with zero mean and unit variance.
-
Preferred methodology for data covering a wide scope (including outliers).
-
-
-
Normalization: Also called min-max transformation, creates a variable between zero and one which will not usually have a zero mean or unit variance.
-
-
-
Reasons for data cleaning:
-
Missing data
-
Outliers
-
Duplicate observations
-
Inconsistent recording
-
Unwanted (i.e. irrelevant) observations
-
Module 2. Principal Components Analysis And K-Means Clustering
Topic 1. Principal Components Analysis
Topic 2. K-Means Clustering
Topic 1. Principal Components Analysis
- Purpose: A popular statistical technique for dimension reduction in unsupervised learning models.
- Goal: To produce almost the same amount of information using a small number of uncorrelated components (variables) that a large number of correlated components can provide.
- Application: Reduces the number of features in a machine learning model.
-
Example: Often applied to yield curve movements to describe them with a small count of uncorrelated components.
- Observed components should be a linear combination of variables.
- Two most important explanatory components: parallel shift (all rates move in same direction) and twist (short-term and long-term rates move in opposite directions).
- Example: First three components explained 99% of yield variation over 10 years due to high correlation.
Practice Questions: Q3
Q3. The end goal of principal components analysis (PCA) is the use of which of the following to manage dimensionality?
A. A small number of correlated components.
B. A large number of correlated components.
C. A small number of uncorrelated components.
D. A large number of uncorrelated components.
Practice Questions: Q3 Answer
Explanation: C is correct.
The goal of principal components analysis is dimensionality reduction, so a small number of components will be the output. The components should be uncorrelated, as correlated components do not independently add much value.
Topic 2. K-Means Clustering
- Purpose: An unsupervised K-means algorithm used to separate dataset observations into clusters to identify dataset structure.
- K Value: Represents the number of clusters and is set by an analyst.
- Centroids: The centers of the data clusters, initially chosen randomly.
-
Process: Each data point is allocated to its nearest centroid.
- The centroid is recalculated to be at the center of all data points assigned to it.
- This process continues until centroids remain constant.
-
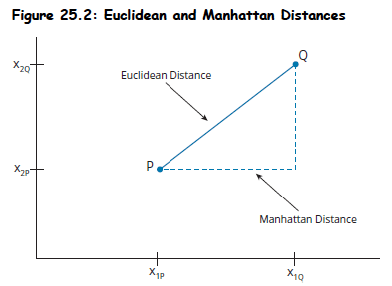
Distance Measures:
-
Euclidean Distance: Diagonal line between two points (hypotenuse).
- Two features :
- m features:
-
Manhattan Distance:Approximates distance via path of opposite and adjacent sides.
- Two features:
- m features:
-
Euclidean Distance: Diagonal line between two points (hypotenuse).
- Goal: Minimize the distance between each observed point and its centroid.
- Inertia: Measure of distance (d) between each data point (j) and its centroid
- Lower inertia implies a better cluster fit.
- Inertia always falls as more centroids are added, so there's a limit to adding value.
-
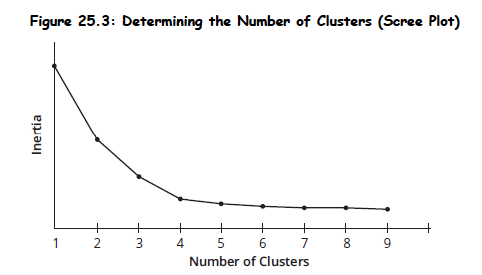
Determining Optimal K:
- Scree Plot: Used to calculate inertia for different K values. The "elbow" (where inertia declines at a slower pace as K increases) represents the optimal number of centroids.
- Silhouette Coefficient: Compares distance between observation and points in its cluster to its distance to points in the next closest cluster. Highest silhouette score yields optimal K.
Topic 2. K-Means Clustering
Practice Questions: Q4
Q4. The optimal number of centroids can be found by choosing the:
A. value that produces the lowest possible inertia.
B. value that produces the highest possible inertia.
C. point where inertia declines at a faster pace as K increases.
D. point where inertia declines at a slower pace as K increases.
Practice Questions: Q4 Answer
Explanation: D is correct.
The “elbow” is the point where inertia starts to decline at a slower pace as K increases. This represents the optimal number of centroids. A lower inertia is ideal, however, because inertia will always fall as more centroids are added, continuing to add K will not add value beyond a certain point.
Module 3. Methods of Prediction And Sample Splitting
Topic 1. Underfitting and Overfitting
Topic 2. Training, Validation, and Test Data Sub-Sample
Topic 1. Underfitting and Overfitting
-
Overfitting: Occurs when a model is too complex, too large, or has too many parameters.
- Greater risk for machine learning models due to typically limited parameters in conventional econometric models.
- Evident when new data causes the model to perform worse.
- Results in a training set with a very low error rate but poor performance on data outside the training set.
- Characterized by low bias but high variance predictions.
-
Underfitting: Occurs when a model is too simple and fails to capture relevant patterns.
- Greater risk in conventional models.
- Excludes relevant factors, leading to biased predictions with low variance.
- Example: A conventional model underfitting a quadratic relationship between hedge fund performance and AUM.
-
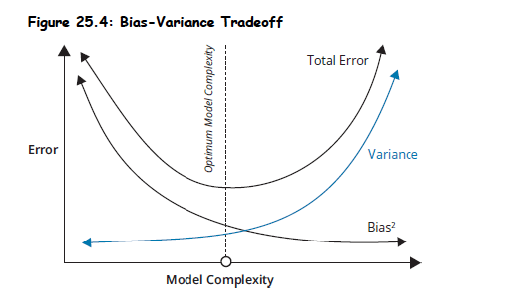
Bias-Variance Tradeoff: The size of the machine learning model determines if it's appropriately fitted, overfitted, or underfitted.
- Underfitted: High bias, low variance.
- Overfitted: Low bias, high variance.
Topic 1. Underfitting and Overfitting
Practice Questions: Q5
Q5. The predictions that are generated from an underfitted model will likely have:
A. low bias and low variance.
B. low bias and high variance.
C. high bias and low variance.
D. high bias and high variance.
Practice Questions: Q5 Answer
Explanation: C is correct.
An underfitted model excludes relevant factors and fails to capture relevant patterns. As a result, the predictions generated from such a model will have low variance but will otherwise have higher bias.
Topic 2. Training, Validation, and Test Data Sub-Samples
-
Purpose: To test the fitted model by keeping part of the data sample out (holdout data) and see how well it predicts unseen observations.
-
Typical Division for ML Models:
-
Training Set: Used to estimate model parameters.
- Data used by the ML model to learn how to best represent the data.
- Risk of biases in parameter estimation with a small training set.
-
Validation Set: Used to decide between two alternative models.
- Data cannot be used once the superior model is chosen.
- Risk of inaccurate model estimations with a small validation set.
-
Test Set: Used to determine the effectiveness of the chosen model.
- Model is effective when fit to test sample is almost as good as fit to training sample (model generalization).
-
Training Set: Used to estimate model parameters.
-
Allocation (Typical): Two-thirds to training set.
- One-sixth to validation set.
- One-sixth to test set.
-
Cross-sectional data: No natural order; allows random placement into sets.
-
Time-series data: Natural order; training data typically first, followed by validation, then test data.
-
Larger datasets have lower risk of improper allocations
-
Small Datasets: k-fold cross-validation can be utilized for small datasets.
-
k-fold cross-validation: Combines training and validation data into a single sample (n) allocated into k samples.
- Common k values: 5 or 10.
- Example (k=10): Data divided into 10 sub-samples (10% each). First estimation uses k1-k9, k10 reserved for test set. Subsequent estimations rotate the validation sample.
- Creates multiple validation samples for averaged performance assessment.
- Leave-one-out cross-validation: Setting k=n, where number of folds equals number of data points.
Topic 2. Training, Validation, and Test Data Sub-Samples
Practice Questions: Q6
Q6. An analyst is choosing between two machine learning models. Which of the following datasets will the analyst most likely use to make the determination of which model to select?
A. Test set.
B. Training set.
C. Variance set.
D. Validation set.
Practice Questions: Q6 Answer
Explanation: D is correct.
The validation data set is used to decide between alternative machine learning models. The test set determines the effectiveness of the model once it is already chosen. The training set is used to estimate model parameters. There is no such thing as a variance set in this context.
Module 4. Reinforcement Learning And Natural Language Processing
Topic 1. Reinforcement Learning
Topic 2. Natural Language Processing
Topic 1. Reinforcement Learning
- Core Concept: Creation of a policy for decision-making with the goal of maximizing reward.
- Mechanism: Involves a systematic trial-and-error approach, similar to computers learning to play games by playing against themselves.
- Applications in Finance: Derivatives hedging, trading rules, managing large-volume trades.
- Data Requirement: Requires large quantities of training data; initial performance is weak but improves dramatically over time.
-
Key Areas:
- States (S): Define the environment.
- Actions (A): Represent the decisions taken.
- Rewards (R): Maximized when the best possible decision is made.
-
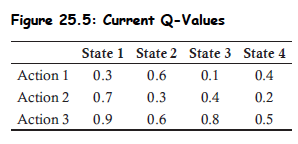
Q-value: The expected value of taking an action (A) in a certain state (S).
- Best action:
-
Decision-Making: Algorithm chooses between:
- Exploitation: Best action already identified (probability p).
- Exploration: A new action (probability 1-p).
- As trials complete and strategies are learned, p increases.
Topic 1. Reinforcement Learning
-
Methods to Evaluate Actions:
-
Monte Carlo Method: Evaluates actions (A) in states (S) and subsequent rewards (R).
- Formula: , (where α is typically 0.01 or 0.05).
- Example: Q(4,3) updated from 0.5 to 0.5+0.01(1.2−0.5)=0.507 if reward is 1.2 and α=0.01.
-
Temporal Difference Learning: Assumes the best strategy so far is the one to be made going forward and looks only one decision ahead.
- Example: Q(4,3) adjusted from 0.5 to 0.5+0.01(0.3+0.8−0.5)=0.506 if reward is 0.3, V(S3)=0.8, and α=0.01.
- Deep Reinforcement Learning: Uses neural networks to estimate a complete table from available observations.
-
Monte Carlo Method: Evaluates actions (A) in states (S) and subsequent rewards (R).
Practice Questions: Q7
Q7. An analyst applying a reinforcement learning model has assigned a probability to exploitation of 65%. As she completes more trials, she can reasonably expect that the probability will increase above:
A. 35% for exploration.
B. 65% for exploitation.
C. 50% for exploration.
D. 50% for exploitation.
Practice Questions: Q7 Answer
Explanation: B is correct.
Reinforcement learning model algorithms will choose between the best action already identified (exploitation) and new actions (exploration). Exploitation has a probability of p, which is expected to rise with additional trials. Exploration has a probability of 1 – p and is expected to fall with additional trials. If the exploitation probability is already at 65%, the expectation is that it will rise further as more trials are conducted.
Topic 2. Natural Language Processing
- Definition: A component of machine learning focused on understanding and analyzing written and verbal human language. Also known as text mining.
- Uses: Accounting fraud detection, assessing sentiment of corporate statements, categorizing text, recognizing specific words for message purpose.
- Benefits: Speed and document review without inconsistencies or bias found in human reviews.
-
Steps in NLP:
- Capturing the language in a document.
- Preprocessing the text.
- Analyzing it for a specific purpose.
-
Text Preprocessing Steps:
- Tokenization: Identifying only words (removing punctuation, symbols, spacing) and converting to lowercase.
- Removing Stopwords: Eliminating common words like "the," "has," "a" that have no other value beyond making sentences flow.
- Stemming: Replacing words with their stems (e.g., "arguing," "argued," "argues" -> "augu").
- Lemmatization: Replacing words with their lemmas (e.g., "worse" -> "bad"). Similar to stemming, but the lemma is an actual word.
- N-grams: Considering groups of words that have meaning together (e.g., "exceed analyst expectations" as a trigram).
- "Bag of Words": Processed text is considered a "bag of words" where word order and linkages (except N-grams) are irrelevant.
-
Sentiment Analysis:
- Uses an inventory of "sentiment words" to assess if corporate news releases are positive, negative, or neutral.
- Counts positive, negative, or neutral words.
- Example positive stems: grow, relief, increase, rise. Example negative stems: concern, disappoint, decrease, decline.
- Challenge: Handling positive words in negative connotations (e.g., "would have resulted in an increase").
- Refinement: Comparing human reviews with algorithm reviews.
Topic 2. Natural Language Processing
Practice Questions: Q8
Q8. Natural language processing (NLP) is used to evaluate the MD&A (Management, Discussion, and Analysis) section of a company’s annual report. In removing the “stopwords,” the NLP algorithm will remove all of the following words except:
A. “or.”
B. “are.”
C. “have.”
D. “fallen.”
Practice Questions: Q8 Answer
Explanation: D is correct.
Stopwords are used to help sentences flow but otherwise have no value. Words like “or,” “are,” and “have” are considered stopwords. “Fallen” is not a stopword, as it has value in describing the direction of something (e.g., earnings, sales, etc.).