High-dose Proton Beam Therapy versus Conventional Fractionated Radiation Therapy for Newly Diagnosed Glioblastoma
A Propensity Score Matching Analysis
Masahide Matsuda, Masashi Mizumoto, Hidehiro Kohzuki, Narushi Sugii, Hideyuki Sakurai, Eiichi Ishikawa
BMC Radiation Oncology (2023) 18:38
Introduction
- Glioblastoma (GBM) is the most aggressive type of brain tumor with poor prognosis
- Multiple therapeutic strategies have been explored to improve survival
- Radiation dose escalation using particle therapy is one promising approach
- Proton beam therapy (PBT) enables high-dose irradiation of tumors without increasing dose to surrounding normal tissue due to the Bragg peak effect
- Previous studies have shown high-dose PBT to be feasible with improved survival in selected patients
- Selection bias remains an issue in evaluating benefits of PBT vs conventional radiation therapy (CRT)
Study Objectives
- To compare survival outcomes of high-dose proton beam therapy (PBT) versus conventional radiation therapy (CRT) for newly diagnosed GBM using propensity score matching to minimize selection bias
- To evaluate toxicities associated with high-dose PBT versus CRT
- To address confounding factors related to selection bias in previous studies
Methods: Study Design
- Retrospective analysis of 235 consecutive patients with newly diagnosed GBM treated with radiation therapy at University of Tsukuba Hospital (2010-2020)
- Propensity score matching used to minimize selection bias in treatment allocation
- 1:1 matching based on seven key covariates:
- Age
- Sex
- Tumor location
- Extent of resection
- Chemotherapy
- Immunotherapy
- Pre-radiation Karnofsky performance scale (KPS) score
- Molecular information (MGMT, IDH1) available for limited cases but not included in matching
Patient Population
- All patients underwent different extents of surgical resection:
- Gross total resection (GTR): complete resection of contrast-enhancing tumor
- Subtotal resection (STR): tumor resection of 90% or more
- Partial resection (PR): tumor resection of 5% to 90%
- Biopsy (B): tumor resection of less than 5%
- Original cohort (n=235):
- PBT group (n=26)
- CRT group (n=209)
- After propensity score matching:
- 26 patients in each group with balanced covariates
| Characteristic | Before propensity score matching (n=235) | After propensity score matching (n=52) | ||||
|---|---|---|---|---|---|---|
| PBT (n=26) | CRT (n=209) | p value | PBT (n=26) | CRT (n=26) | p value | |
| Age (y), mean±SD | 57.6±12.3 | 62.5±13.1 | 0.075 | 57.6±12.3 | 54.3±14.3 | 0.37 |
| Sex, female (%) | 11 (42.3%) | 87 (41.6%) | 1.000 | 11 (42.3%) | 7 (26.9%) | 0.382 |
| Tumor location (cerebral lobe) (%) | 25 (96.2%) | 171 (81.8%) | 0.090 | 25 (96.2%) | 26 (100%) | 1 |
| Extent of resection (GTR, STR) (%) | 23 (88.5%) | 122 (58.4%) | 0.002 | 23 (88.5%) | 19 (73.1%) | 0.291 |
| Temozolomide (%) | 26 (100%) | 205 (98.1%) | 1.000 | 26 (100%) | 25 (96.2%) | 1 |
| Immunotherapy (%) | 5 (19.2%) | 22 (10.5%) | 0.195 | 5 (19.2%) | 6 (23.1%) | 1 |
| KPS (pre RT) ≥ 70 (%) | 23 (88.5%) | 140 (67.0%) | 0.025 | 23 (88.5%) | 22 (84.6%) | 1 |
| MGMT methyl (%) | 1/21 (4.8%) | 47/146 (32.2%) | 0.009 | 1/21 (4.8%) | 3/18 (16.7%) | 0.318 |
| IDH mut (%) | 3/23 (13.0%) | 9/181 (5.0%) | 0.140 | 3/23 (13.0%) | 1/18 (5.6%) | 0.618 |
| GTR: Gross total resection, STR: Subtotal resection, KPS: Karnofsky performance scale, MGMT: O6-methylguanine-DNA-methyltransferase, IDH: isocitrate dehydrogenase | ||||||
Patient Population
| Characteristic | Before propensity score matching (n=235) | After propensity score matching (n=52) | ||||
|---|---|---|---|---|---|---|
| PBT (n=26) | CRT (n=209) | p value | PBT (n=26) | CRT (n=26) | p value | |
| Age (y), mean±SD | 57.6±12.3 | 62.5±13.1 | 0.075 | 57.6±12.3 | 54.3±14.3 | 0.37 |
| Sex, female (%) | 11 (42.3%) | 87 (41.6%) | 1.000 | 11 (42.3%) | 7 (26.9%) | 0.382 |
| Tumor location (cerebral lobe) (%) | 25 (96.2%) | 171 (81.8%) | 0.090 | 25 (96.2%) | 26 (100%) | 1 |
| Extent of resection (GTR, STR) (%) | 23 (88.5%) | 122 (58.4%) | 0.002 | 23 (88.5%) | 19 (73.1%) | 0.291 |
| Temozolomide (%) | 26 (100%) | 205 (98.1%) | 1.000 | 26 (100%) | 25 (96.2%) | 1 |
| Immunotherapy (%) | 5 (19.2%) | 22 (10.5%) | 0.195 | 5 (19.2%) | 6 (23.1%) | 1 |
| KPS (pre RT) ≥ 70 (%) | 23 (88.5%) | 140 (67.0%) | 0.025 | 23 (88.5%) | 22 (84.6%) | 1 |
| MGMT methyl (%) | 1/21 (4.8%) | 47/146 (32.2%) | 0.009 | 1/21 (4.8%) | 3/18 (16.7%) | 0.318 |
| IDH mut (%) | 3/23 (13.0%) | 9/181 (5.0%) | 0.140 | 3/23 (13.0%) | 1/18 (5.6%) | 0.618 |
| GTR: Gross total resection, STR: Subtotal resection, KPS: Karnofsky performance scale, MGMT: O6-methylguanine-DNA-methyltransferase, IDH: isocitrate dehydrogenase | ||||||
Before matching (original cohort):
Significant differences between PBT and CRT groups in:
- Extent of resection (GTR/STR: 88.5% vs 58.4%, p=0.002)
- Pre-radiation KPS scores ≥70 (88.5% vs 67.0%, p=0.025)
- MGMT promoter methylation (4.8% vs 32.2%, p=0.009)
After matching:
-
No significant differences in any of the baseline characteristics between groups
Methods: Radiation Protocol
Conventional Radiation Therapy (CRT):
- Total dose: 60 Gy in 30 fractions
- Delivered by daily photon radiation (2.0 Gy administered five times per week)
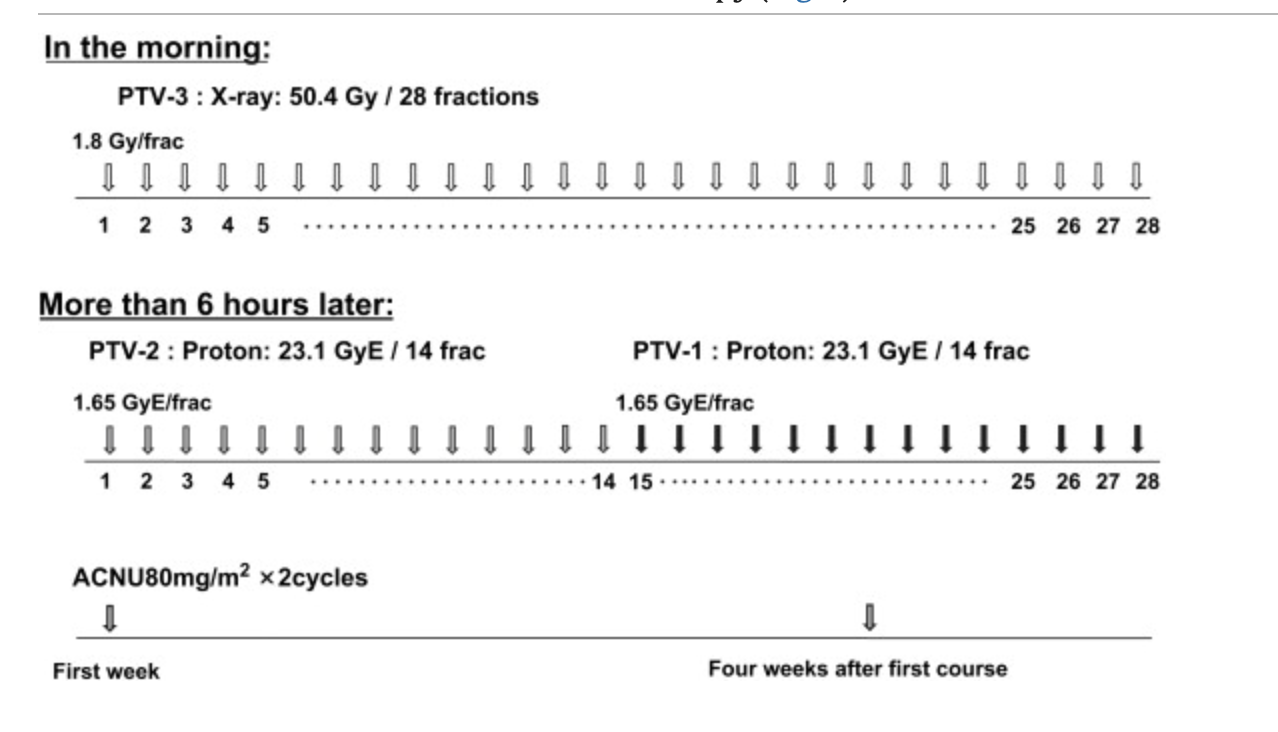
High-dose Proton Beam Therapy (PBT):
- Total dose: 96.6 Gy (RBE) in 56 fractions
- Delivered by hyperfractionated concomitant boost
- Proton beams with energy of ~250 MeV produced using booster synchrotron
- RBE of 1.1 adopted for clinical application
Methods: Radiation Planning
Proton Beam Therapy Planning:
- GTV96.6 Gy: Area of contrast-enhanced tumor or surgical cavity on MRI plus 5 mm margin
- CTV73.5 Gy: Area of 15 mm margin around contrast-enhancing tumor or surgical cavity
- CTV50.4 Gy: Area of 20 mm margin around peritumoral edema
- Dose constraints:
- Chiasm: < 50 Gy (RBE)
- Thalamus and brainstem: < 60 Gy (RBE)
PBT Eligibility:
- Criteria included: unlikely fatality of predicted radiation necrosis and potential resectability of brain necrosis within GTV96.6 Gy
Critical Eligibility Criteria Mentioned:
"The application of PBT was dependent on eligibility based on inclusion criteria and patient decision. The main inclusion criteria included unlikely fatality of the predicted radiation necrosis and potential resectability of brain necrosis within GTV96.6 Gy"
Missing Information:
- No details on how "unlikely fatality of predicted radiation necrosis" was determined:
- No criteria specified for "potential resectability of brain necrosis":
- No information on the decision-making process:
Methods: Radiation Planning
Proton Beam Therapy Planning:
- GTV96.6 Gy: Area of contrast-enhanced tumor or surgical cavity on MRI plus 5 mm margin
- CTV73.5 Gy: Area of 15 mm margin around contrast-enhancing tumor or surgical cavity
- CTV50.4 Gy: Area of 20 mm margin around peritumoral edema
- Dose constraints:
- Chiasm: < 50 Gy (RBE)
- Thalamus and brainstem: < 60 Gy (RBE)
Conventional Radiation Therapy (CRT) Details
Dose prescription:
-
- "A total dose of 60 Gy in 30 fractions was delivered by daily photon radiation (2.0 Gy administered five times per week)"
Missing Details:
- No specific information about target volumes (GTV, CTV, PTV definitions)
- No information on dose constraints for organs at risk
- No specifics about margins used
- No details on imaging used for planning (did they use T2 enhancement for CTV2)
- Standard GBM protocols would typically involve:
- GTV: T1 contrast enhancing tumor + resection cavity
- CTV: GTV + 1.5-2.0 cm margin (adjusted for anatomical barriers)
- PTV: CTV + 3-5 mm setup margin
- This represents a significant limitation in comparing the technical aspects of the treatments
Methods: Treatment
Chemotherapy:
- Most patients received temozolomide (TMZ) according to modified Stupp regimen:
- Concurrent with postoperative radiation therapy
- Adjuvant maintenance therapy for 12 to 24 cycles
Immunotherapy:
- Some patients received autologous formalin-fixed tumor vaccine (AFTV) in addition to chemoradiotherapy
Assessment:
- Radiation necrosis diagnosed by MRI and 11C-methionine-positron emission tomography (MET-PET)
- Adverse events evaluated according to CTCAE v5.0
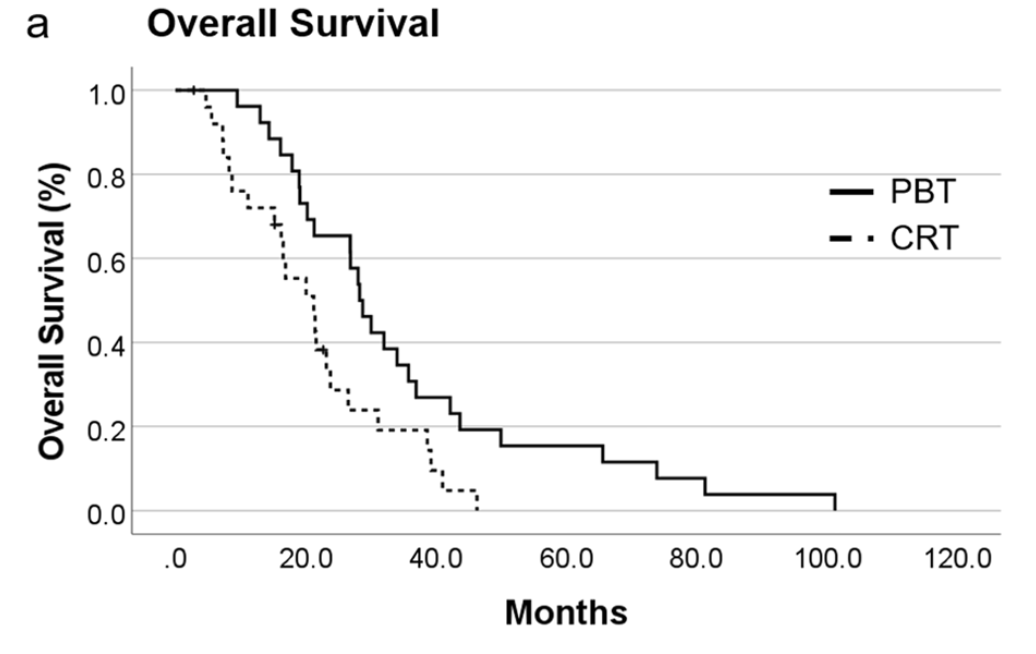
Primary Outcomes: Overall Survival
Overall Survival Results:
- PBT group: median OS 28.3 months (95% CI 24.3-32.2)
- CRT group: median OS 21.2 months (95% CI 14.2-28.3)
- Statistically significant difference (p=0.013)
- 1-year survival rate:
- PBT: 96.2%
- CRT: 72.0%
- 2-year survival rate:
- PBT: 65.4%
- CRT: 28.7%
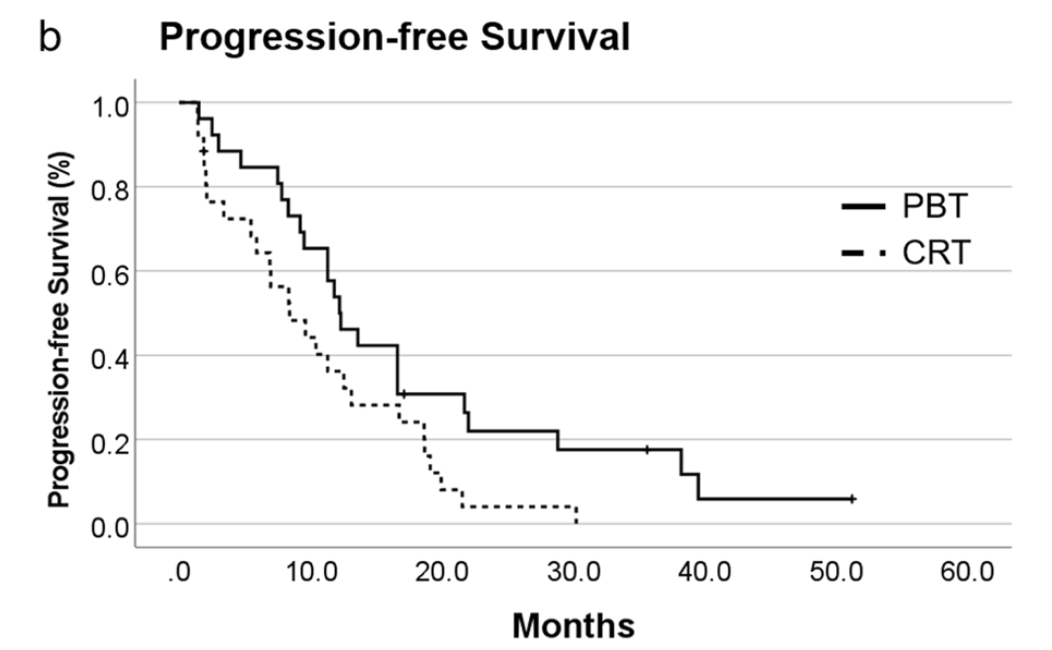
Secondary Outcomes: Progression-Free Survival
Progression-Free Survival Results:
- PBT group: median PFS 12.2 months (95% CI 9.3-15.1)
- CRT group: median PFS 8.4 months (95% CI 4.1-12.7)
- Statistically significant difference (p=0.029)
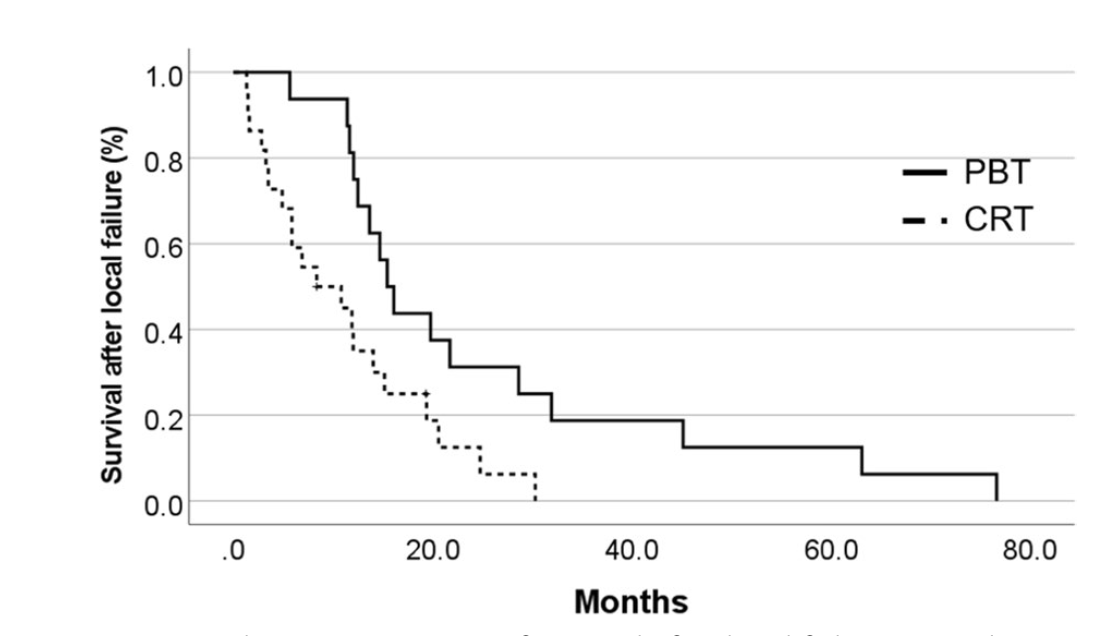
Failure Patterns:
- PBT group: 16 local failures, 2 distant failures, 5 disseminations
- CRT group: 22 local failures, 0 distant failures, 3 disseminations
- Median survival after local failure:
- PBT: 15.4 months (95% CI 12.7-18.2)
- CRT: 8.4 months (95% CI 1.0-15.7) (p=0.011)
Secondary Outcomes: Progression-Free Survival
Progression-Free Survival Results:
- PBT group: median PFS 12.2 months (95% CI 9.3-15.1)
- CRT group: median PFS 8.4 months (95% CI 4.1-12.7)
- Statistically significant difference (p=0.029)
Failure Patterns:
- PBT group: 16 local failures, 2 distant failures, 5 disseminations
- CRT group: 22 local failures, 0 distant failures, 3 disseminations
- Median survival after local failure:
- PBT: 15.4 months (95% CI 12.7-18.2)
- CRT: 8.4 months (95% CI 1.0-15.7) (p=0.011)
Secondary Outcomes: Toxicity
| Event | PBT (n=26) | CRT (n=26) | ||||
|---|---|---|---|---|---|---|
| Grade 1 | Grade 2 | Grade 3 | Grade 1 | Grade 2 | Grade 3 | |
| Acute toxicities, no.(%) | ||||||
| Alopecia | 1 (3.8%) | 25 (96.2%) | 0 (0%) | 1 (3.8%) | 25 (96.2%) | 0 (0%) |
| Radiation dermatitis | 14 (53.8%) | 8 (30.8%) | 0 (0%) | 11 (42.3%) | 3 (11.5%) | 0 (0%) |
| Radiation otitis | 2 (7.7%) | 0 (0%) | 0 (0%) | 4 (15.4%) | 0 (0%) | 0 (0%) |
| Late toxicities, no.(%) | ||||||
| Radiation necrosis | 3 (11.5%) | 2 (7.7%) | 2 (7.7%) | 0 (0%) | 0 (0%) | 0 (0%) |
Acute Radiation-Related Toxicities:
- Similar frequencies and severities in both groups
- Temporary alopecia (Grade 2) in almost all patients
- Radiation dermatitis:
- PBT: 22 patients (14 Grade 1, 8 Grade 2)
- CRT: 14 patients (11 Grade 1, 3 Grade 2)
- Radiation otitis: 2 patients in PBT group vs 4 patients in CRT group
Late Radiation-Related Toxicities:
- Radiation necrosis detected only in PBT group: 7 patients (26.9%)
- 3 Grade 1, 2 Grade 2, 2 Grade 3
- 5 patients were symptomatic and required treatment
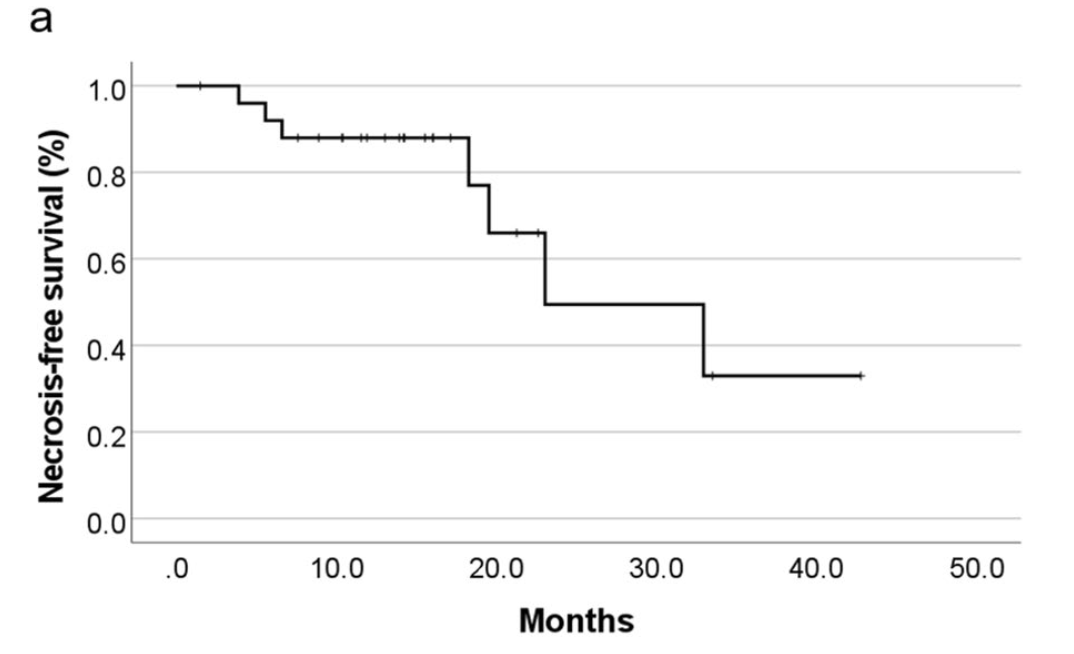
Radiation Necrosis Analysis
Radiation Necrosis and Management:
- Median time to development of radiation necrosis: 23.0 months (95% CI 8.8-37.3)
- Treatment of symptomatic necrosis:
- 2 patients: surgical resection (due to suspicion of tumor recurrence)
- 3 patients: medical treatment with bevacizumab after conventional therapy failure
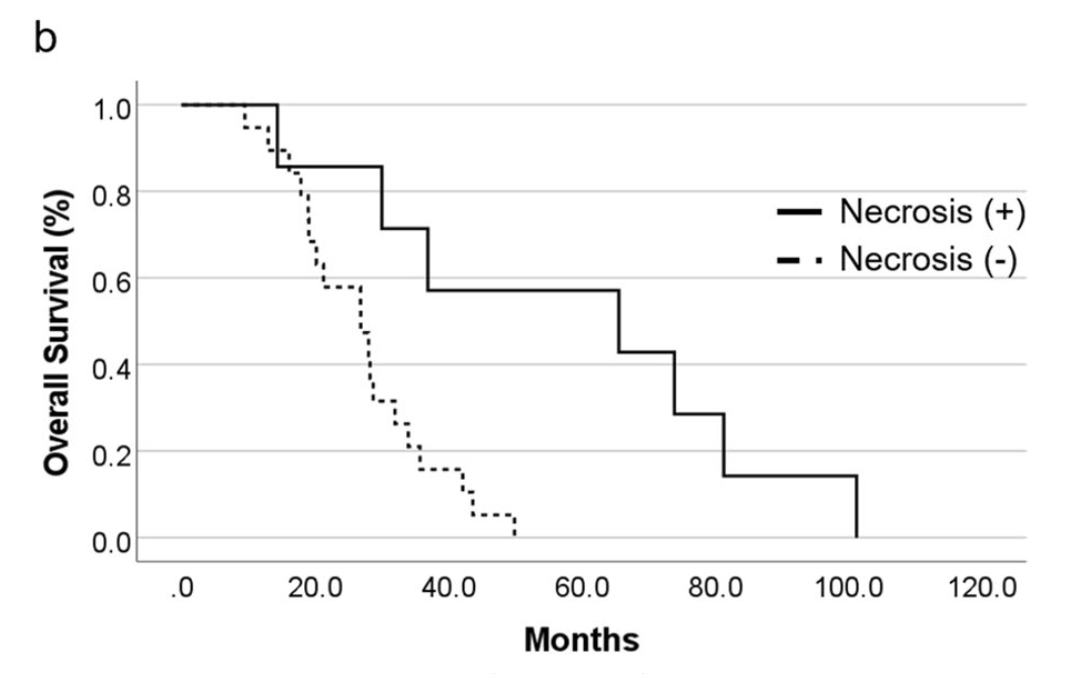
Impact on survival in PBT group:
- Patients with radiation necrosis: median OS 65.6 months (95% CI 0.0-139.0)
- Patients without radiation necrosis: median OS 26.9 months (95% CI 17.3-36.4)
- Significant association between radiation necrosis and prolonged survival (p=0.004)
Conclusions
- High-dose PBT provided significant survival benefits for patients with newly diagnosed GBM compared to CRT as shown by propensity score matching analysis
- Median OS: 28.3 months for PBT vs 21.2 months for CRT (p=0.013)
- Median PFS: 12.2 months for PBT vs 8.4 months for CRT (p=0.029)
- Acute radiation-related toxicities were equivalent between groups
- Radiation necrosis was observed only in the PBT group (26.9% of patients)
- Patients who developed radiation necrosis showed significantly longer survival (median OS 65.6 vs 26.9 months, p=0.004)
- Bevacizumab was effective in treating symptomatic radiation necrosis
Strengths & Limitations
Strengths:
- Use of propensity score matching to minimize selection bias
- Detailed characterization of both acute and late radiation-related toxicities
- Analysis of survival after local failure
- Inclusion of radiation necrosis outcome data and management strategies
Limitations:
- Retrospective design
- Relatively small sample size
- Lack of established method for distinguishing tumor recurrence from radiation necrosis
- Molecular information (MGMT, IDH1) available for limited cases only
- Possible remaining bias after propensity score matching
Limitations of Propensity Score Matching
Potential Issues with the Matching Process:
- Small sample size: Only 26 patients in each group, limiting statistical power
- Molecular markers not included in matching:
- MGMT promoter methylation (known prognostic factor) was significantly different in the original cohorts (4.8% in PBT vs 32.2% in CRT, p=0.009)
- IDH mutation status also showed differences (13.0% in PBT vs 5.0% in CRT)
- These differences persisted after matching (though non-significant due to small numbers)
- Remaining imbalances after matching:
- Sex distribution (42.3% female in PBT vs 26.9% in CRT)
- Extent of resection (88.5% GTR/STR in PBT vs 73.1% in CRT)
Retrospective Nature of the Study:
- Selection of patients for PBT was dependent on:
- Patient eligibility criteria (unlikely fatality of predicted radiation necrosis)
- Patient decision (suggesting potential socioeconomic confounders)
- Authors acknowledge "the other limitations of our study are its retrospective design, relatively small sample size, and remaining bias after propensity score matching"
Implications:
- The survival benefit of high-dose PBT may be partially due to residual confounding factors
- The association between radiation necrosis and improved survival suggests complex interactions
- Randomized controlled trials are needed to confirm findings (authors mention NRG BN001 trial)
Limitations of Propensity Score Matching
| Parameter | Issue | Before Matching | After Matching | Potential Impact |
|---|---|---|---|---|
| Sample Size | Small number of patients in matched cohorts | PBT: n=26 CRT: n=209 |
PBT: n=26 CRT: n=26 |
Limited statistical power; may overestimate treatment effect |
| MGMT Methylation | Not included in matching despite being a strong prognostic factor | PBT: 4.8% CRT: 32.2% (p=0.009) |
PBT: 4.8% CRT: 16.7% (p=0.318) |
Significant bias favoring CRT group (methylation associated with better outcomes); yet PBT still showed better survival |
| IDH Mutation | Not included in matching despite known prognostic significance | PBT: 13.0% CRT: 5.0% (p=0.140) |
PBT: 13.0% CRT: 5.6% (p=0.618) |
Potential bias favoring PBT group (IDH mutations associated with better outcomes) |
| Sex Distribution | Imbalance persisted after matching | Female in PBT: 42.3% Female in CRT: 41.6% (p=1.000) |
Female in PBT: 42.3% Female in CRT: 26.9% (p=0.382) |
Matching process actually worsened this balance; potential confounder |
| Extent of Resection | Improved after matching but still imbalanced | GTR/STR in PBT: 88.5% GTR/STR in CRT: 58.4% (p=0.002) |
GTR/STR in PBT: 88.5% GTR/STR in CRT: 73.1% (p=0.291) |
Greater extent of resection in PBT group may account for some of the observed survival benefit |
| Patient Selection | Non-randomized selection for PBT | PBT patients selected based on eligibility criteria (including predicted radiation necrosis risk) and patient decision | Selection bias and potential socioeconomic confounders not addressed by matching | |
| Radiation Necrosis | Complex relationship with outcomes | 7 PBT patients (26.9%) developed radiation necrosis; these patients had significantly better survival than PBT patients without necrosis | Suggests radiation necrosis may be a marker for treatment efficacy, complicating interpretation | |
Discussion Points
- How does this study's high-dose PBT protocol (96.6 Gy RBE) compare with other dose-escalation approaches in GBM? Is the benefit worth the risk of radiation necrosis?
- What is the clinical significance of the observation that patients who developed radiation necrosis had significantly longer survival?
- How should we weigh the potential survival benefit of high-dose PBT against the increased risk of radiation necrosis?
- What is the optimal management strategy for radiation necrosis after high-dose PBT? Is prophylactic bevacizumab warranted?
- How might these findings impact the design of future randomized trials comparing PBT and conventional radiation therapy?