From 120 to 800 MB of RAM usage in 5 minutes
A story of plugging memory leaks
dev.js Krk, 18.06.2019
Hi, I'm Rafal RUManek

Doing frontend stuff @Codewise
Event organizer @AngularDragons
@RafalRumanek
I have a poor sense of humour

(please, forgive me!)


Agenda
- Performance & memory leaks intro
- Learning your mistakes the hard way
- Leaks & fixes - case studies
- Synthetic memory tests
- Real User Measurements
Load time PLAYS A key role
- minification, compression, tree shaking
- bundling & code splitting
- CDN, DNS, no. of connections optimizations
- caching (static & dynamic content), browser & CDN
- HTTP push, pre-fetch, pre-connect, loading="lazy" ....
- ...
We need our (potential) users to get to use our app
But... What HAPPENS then?
- what if you as developer don't even get to experience their experience?
- what if your users spend hours, days or even weeks without page reload?
But... What HAPPENS then?
- what if you as developer don't even get to experience their experience?

- what if your users spend hours, days or even weeks without page reload?
- what if it's not good?
INDUSTRY STAnDARDS?
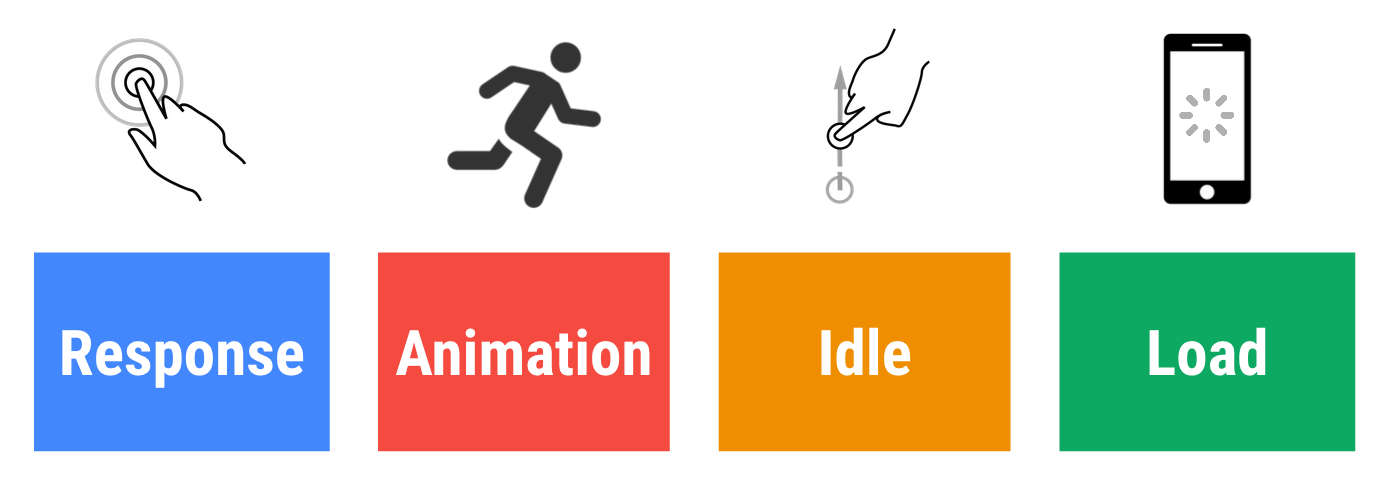
image src & read more at:
https://developers.google.com/web/fundamentals/performance/rail
WHAT If your app does that

WHAT If your app does that

memory management
High-level languages embed a piece of software called "garbage collector" whose job is to track memory allocation and use in order to find when a piece of allocated memory is not needed any longer in which case, it will automatically free it.
Browser Javascript engines use Garbage Collectors use Mark and Sweep algorithm with generational approach (as most of objects 'die' young)
memory leak- what is it?
Memory leak is a type of resource leak that occurs when a computer program incorrectly manages memory allocations in such a way that memory which is no longer needed is not released.
memory leak- how it happens?
- not removed event listeners (when no longer used), RxJS subscriptions, timers ...
- references kept in closure
- circular references*
- detached and not destroyed HTML nodes
- overusing global scope
*circular references aren't the case in Mark and Sweep algorithm,
but there are edge cases for JS + DOM
memory leak- what it does?
- keeps resources even when they are not needed
- most likely leads to downgrading performance of your app
speaking of which...



how did it happen?

Lil' bit of background
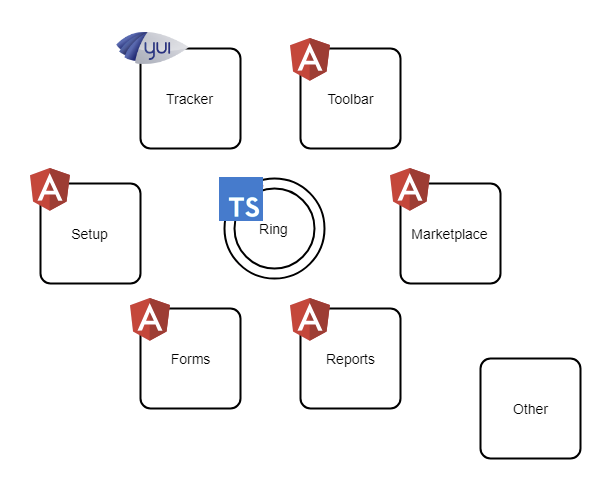
From YUI, through Polymer*, Angular JS,
Angular Dart to Angular starting from fall of 2012
START WITH profiling
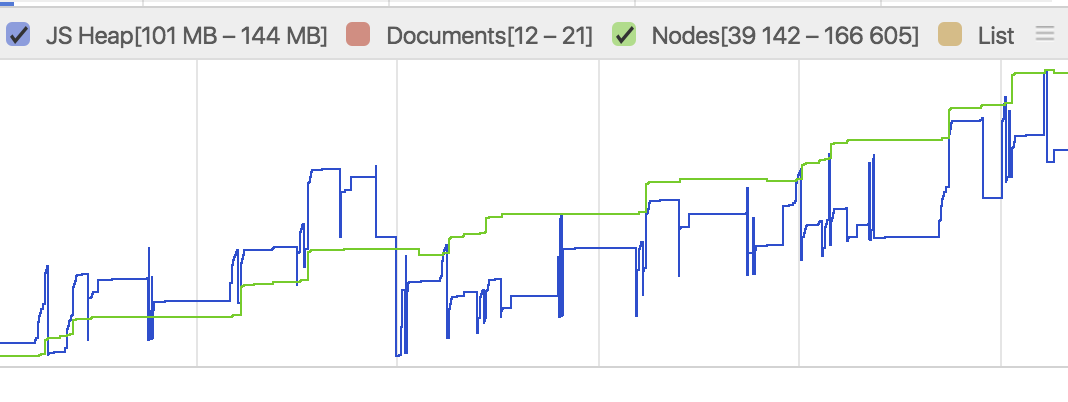
profiling

performance monitor
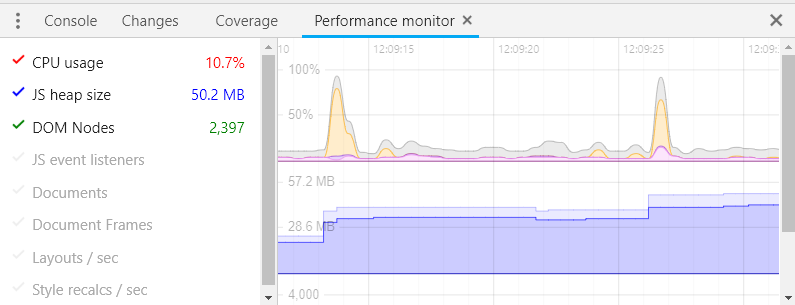

memory api
    // window.performance.memory

    {
      totalJSHeapSize: 29400000,
      usedJSHeapSize: 15200000,
      jsHeapSizeLimit: 1530000000
}- only in Chrome
- even in chrome requires flag
--enable-precise-memory-info
synthetic memory tests
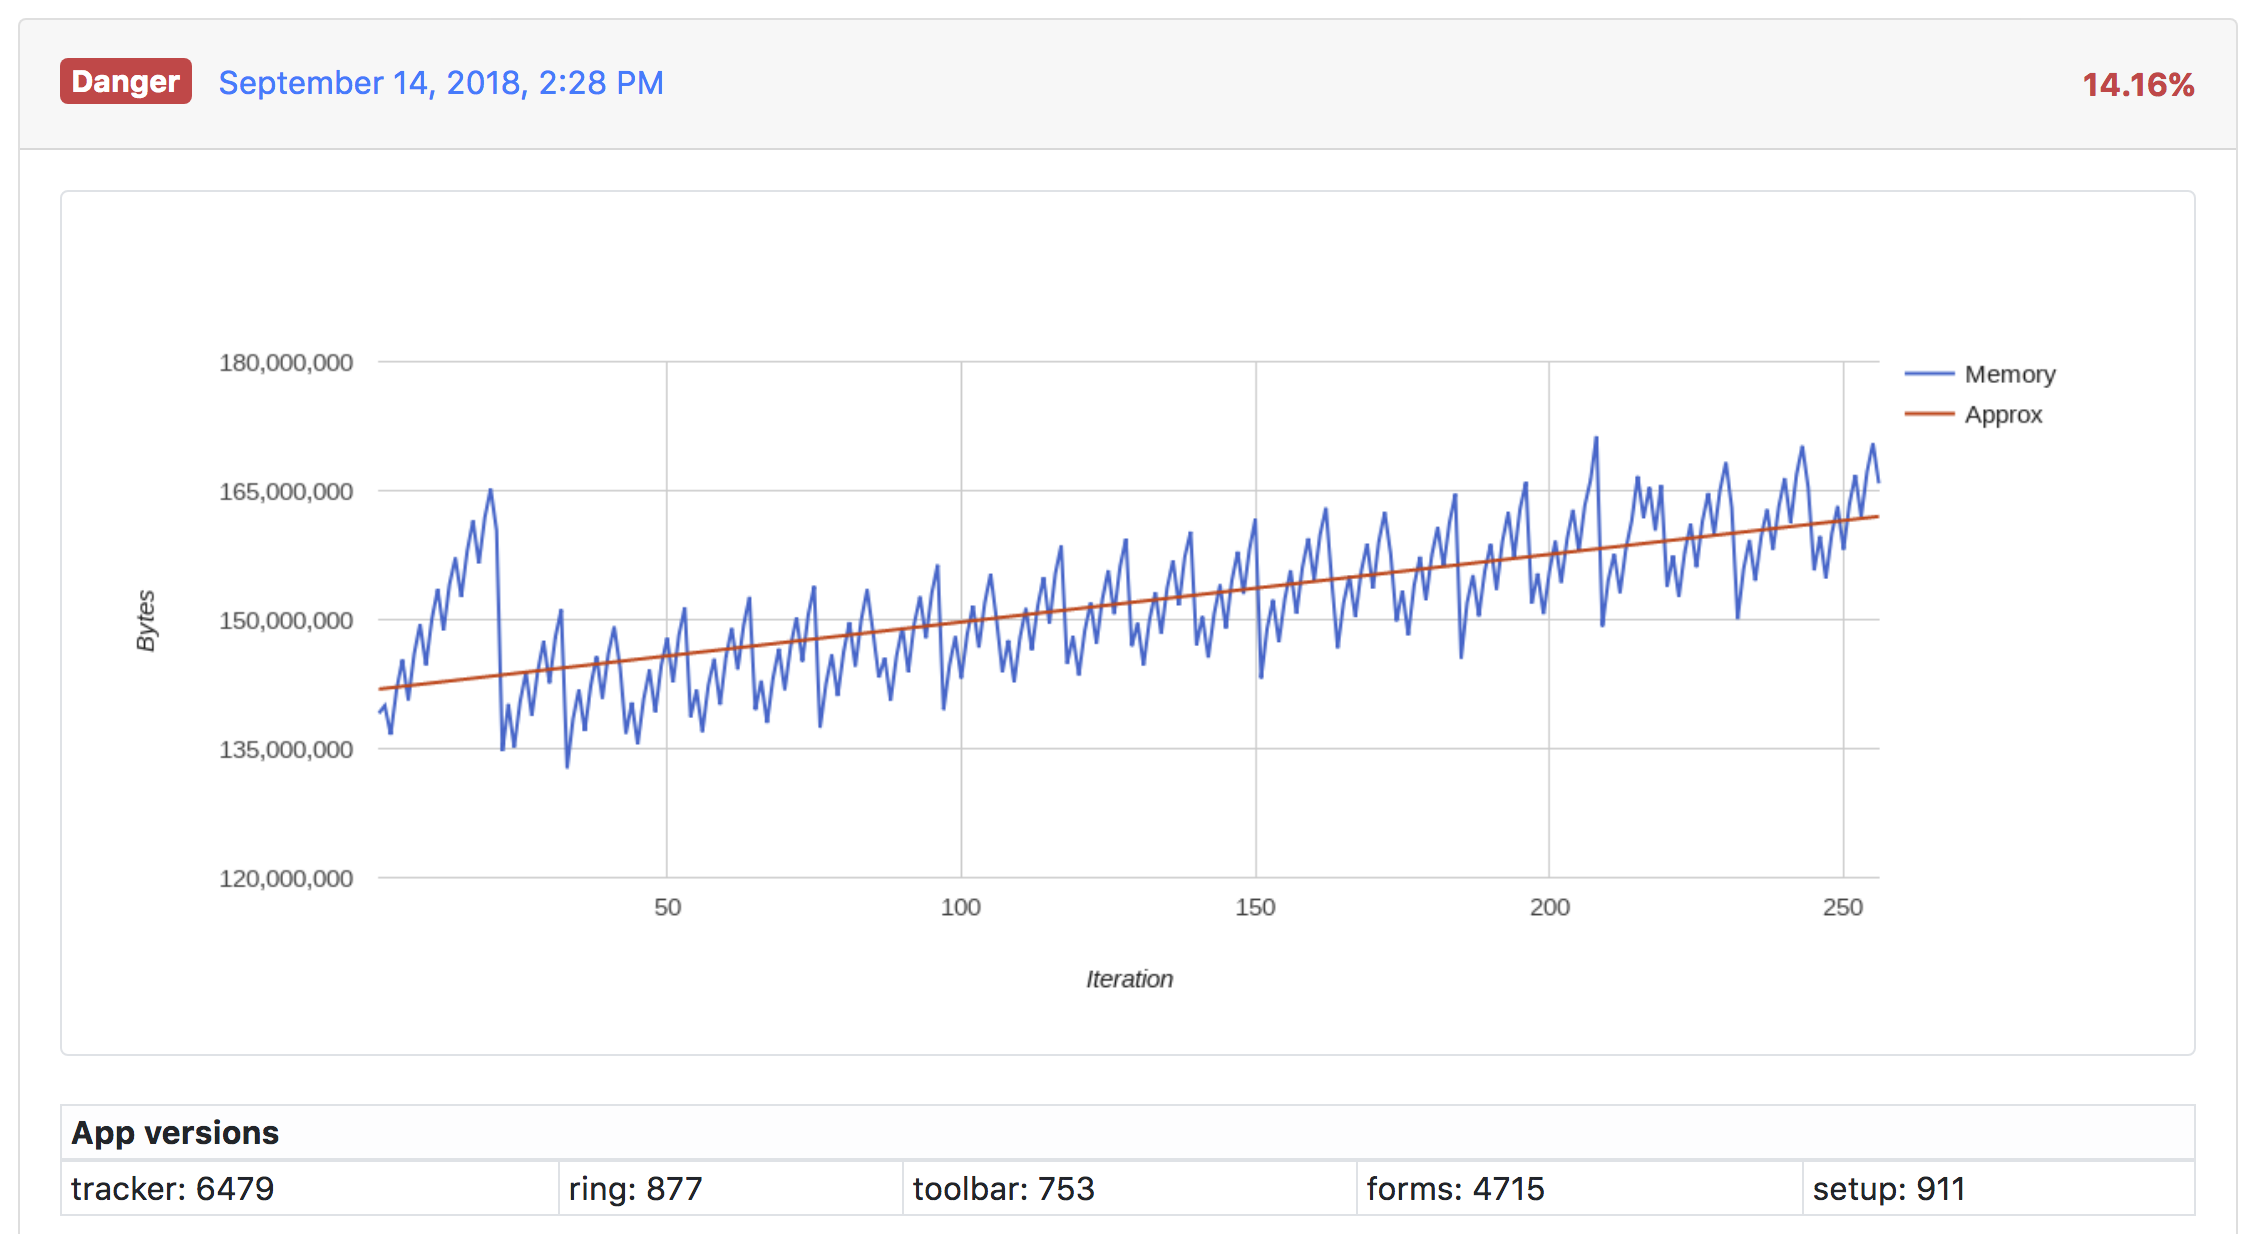
Memory snapshots
you can even ask your clients to send you a snapshot and analyze it ❤️
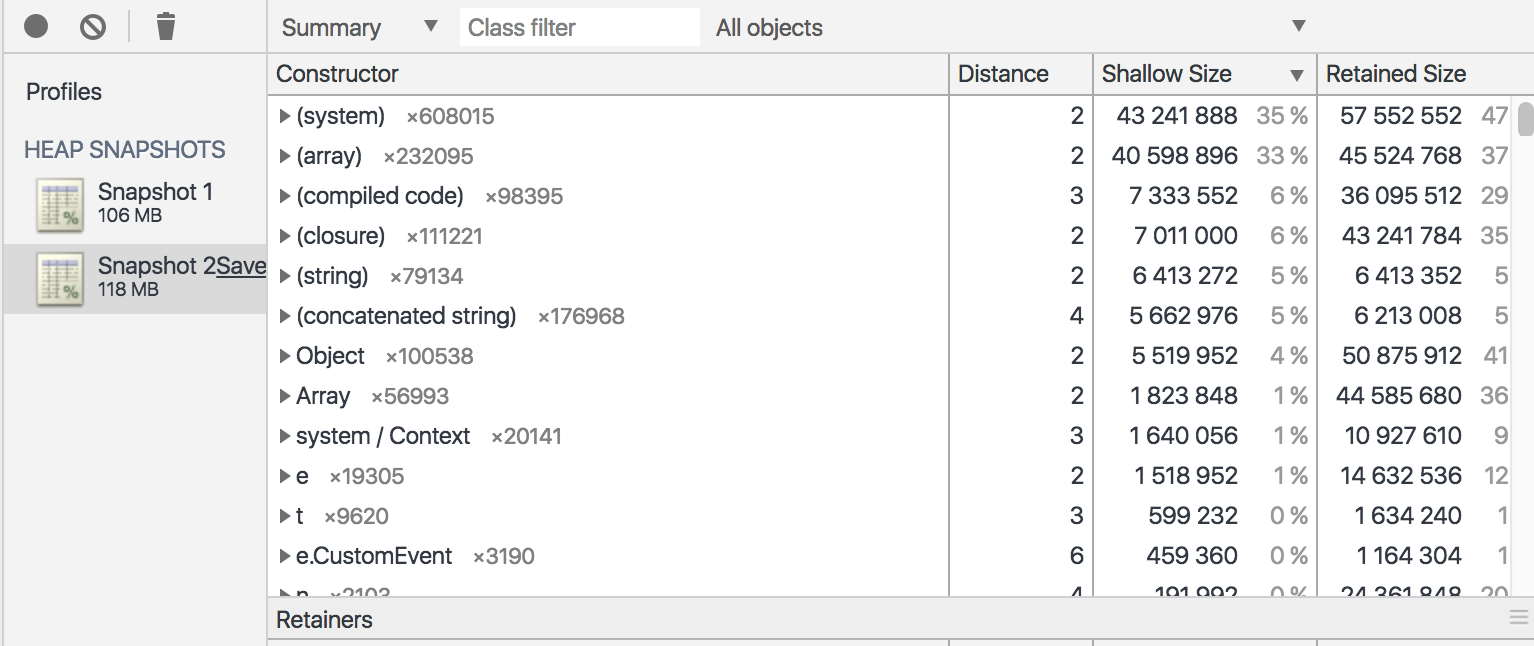
Memory snapshots comparison
przyklad, omowic retained vs shallow size
you can even ask your clients to send you their snapshots
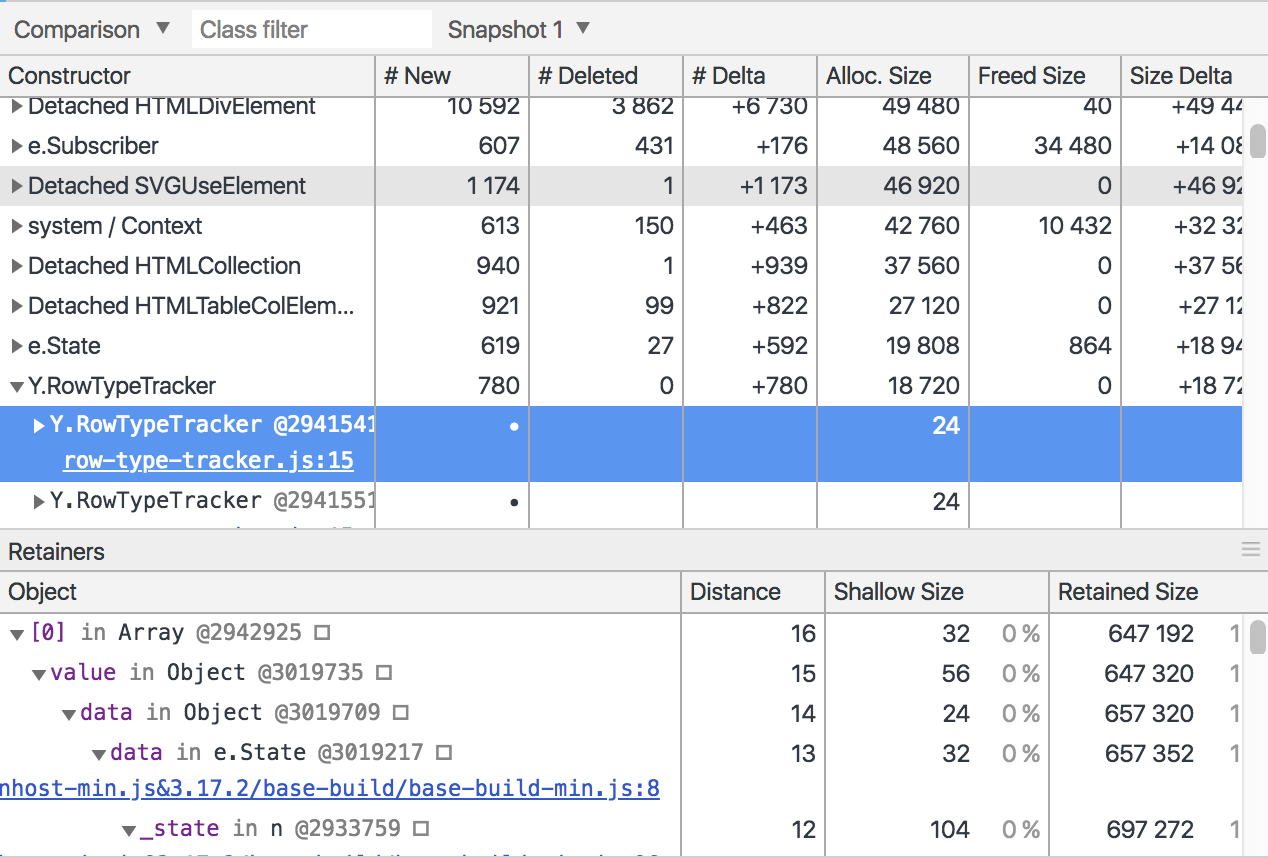
it's a delicious tooL, really

Disclaimer #1
- we did/do have solid (and sometimes painful) code reviews
- we did/do have very experienced engineers on team
- we did/do have multiple layers of regression tests
- ...but we are humans after all :)
Disclaimer #2
Causes of memory leaks are quite often trivial. Once you find them and understand them, they might be really easy to fix.
CASE study #1 - snapshot
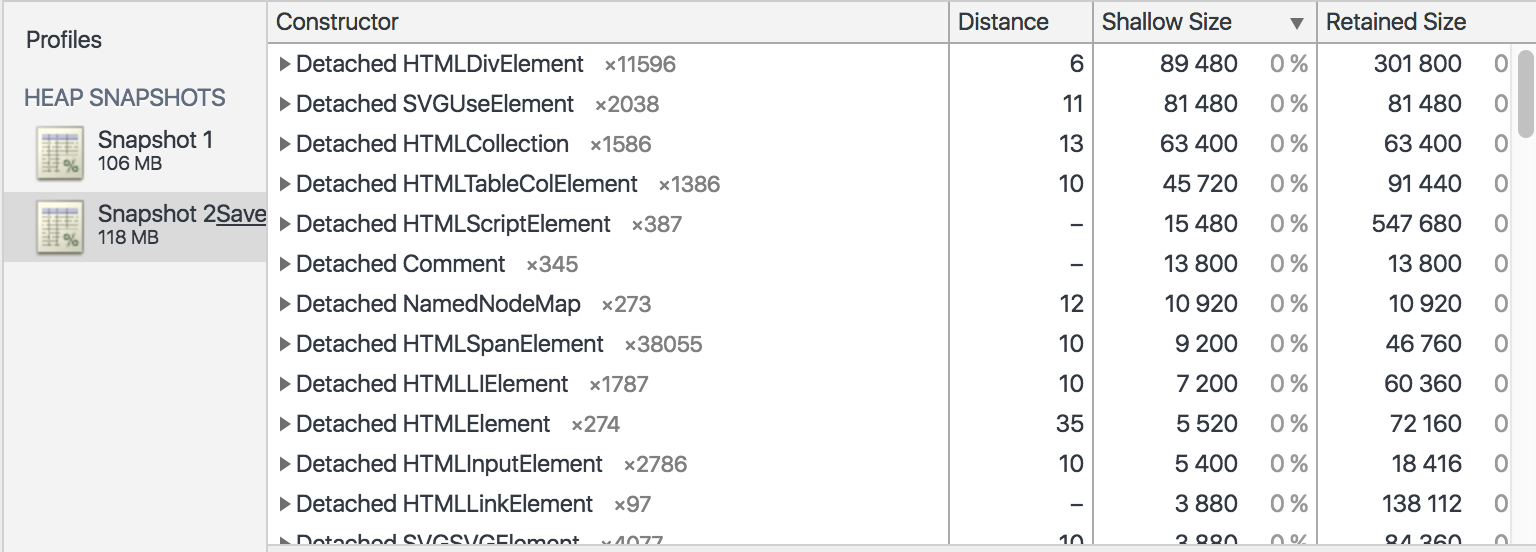
CASE STUDY #1 - cause

YUI Widget class:
// meanwhile in our code

this._toolbarWidget.destroy();
// ...
this._quickSearchWidget.destroy();
// ...
this._quickSearchWidget.destroy();
Really?
Really?
Well, it's getting better
CASE STUDY #2 - snapshot
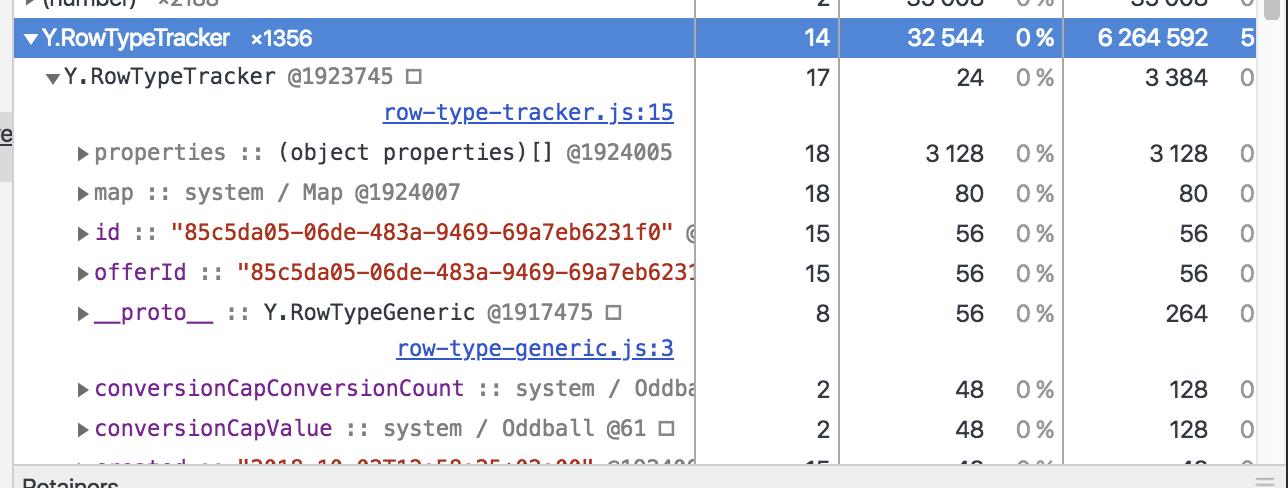
There shouldn't be more than 50 at that time, wtf

CASE STUDY #2 - snapshot

It turned out there's whole report model cached

CASE STUDY #2 - cause
- framework's global events' handlers not being detached
- not destroyed components at all
- view wasn't properly destroyed (zombie skeleton remained) - patch created
- plus some other smaller leaks at that time, including considerable amount of data kept in closure
CASE STUDY #2 - cause
// wrong - existed for 4 years <3
Y.on('reload-report-after-first-payment', this.load, this);

// our wrapper for auto detaching upon destruction
this.addEventHandler(Y.on('reload-report-after-first-payment', this.load, this));
_bindResizeEvent: function () {
const resizeCallback = Y.CommonHelpers.debounce(200, this.onWindowResize, this);
this._windowResizeHandle = Y.on('resize', resizeCallback, null, this);
},
// fixed
_bindResizeEvent: function () {
const resizeCallback = Y.CommonHelpers.debounce(200, this.onWindowResize, this);
this._windowResizeHandle = this.addEventHandler(Y.on('resize', resizeCallback, null, this));
},In general, mostly silly and too obvious mistakes (not only tho), but...
it kinda felt like this

CASE STUDY #3 - snapshot

CASE STUDY #3 - cause
@DestroyAware()
private readonly destroy$: Subject<void> = new Subject<void>();

// ...

this.campaignSave$.pipe(
        takeUntil(this.destroy$) // <--- this was doing the trick
        // ...
    ).subscribe(savedCampaign => this.onSaveSucceeded(savedCampaign));
faulty auto-unsubscribe
@DestroyAware relied on ngOnDestroy hook, which worked for us only when interface OnDestroy is explicitly implmenented
CASE STUDY #3 - cause
export function DestroyAware(destroyHookName: string = "ngOnDestroy"): Function {
    return (target: Object, key: string): void => {
        let originalDestroyHook: Function;
        if (destroyHookName in target && target[destroyHookName] instanceof Function) {
            originalDestroyHook = target[destroyHookName];
        }

        Object.defineProperty(target, destroyHookName, {
            value: function value(...args: any[]) {
                if (originalDestroyHook instanceof Function) {
                    originalDestroyHook.apply(this, args);
                }
                this[key].next(true);
                this[key].complete();
            }
        });
    };
}
syntH. memory tests - before
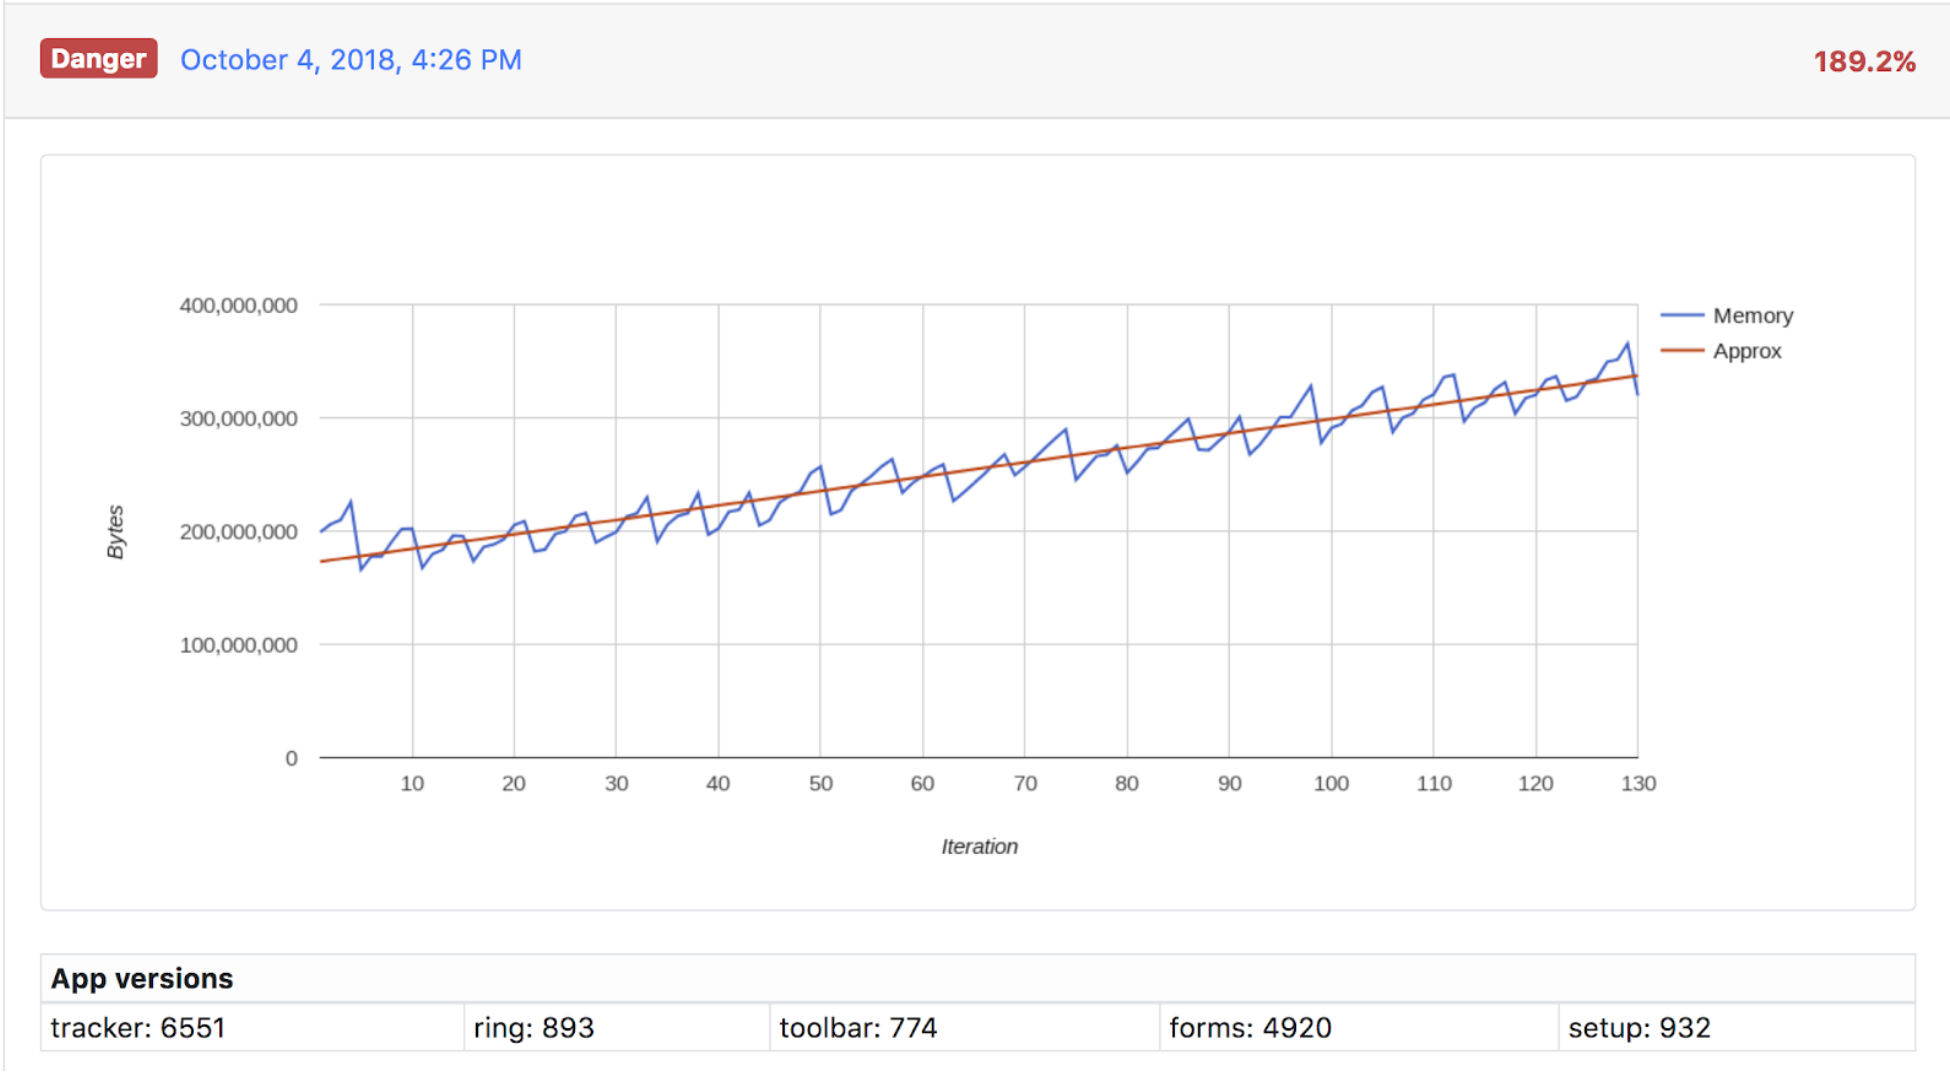
(one of scenarios)
syntH. memory tests - AFTER
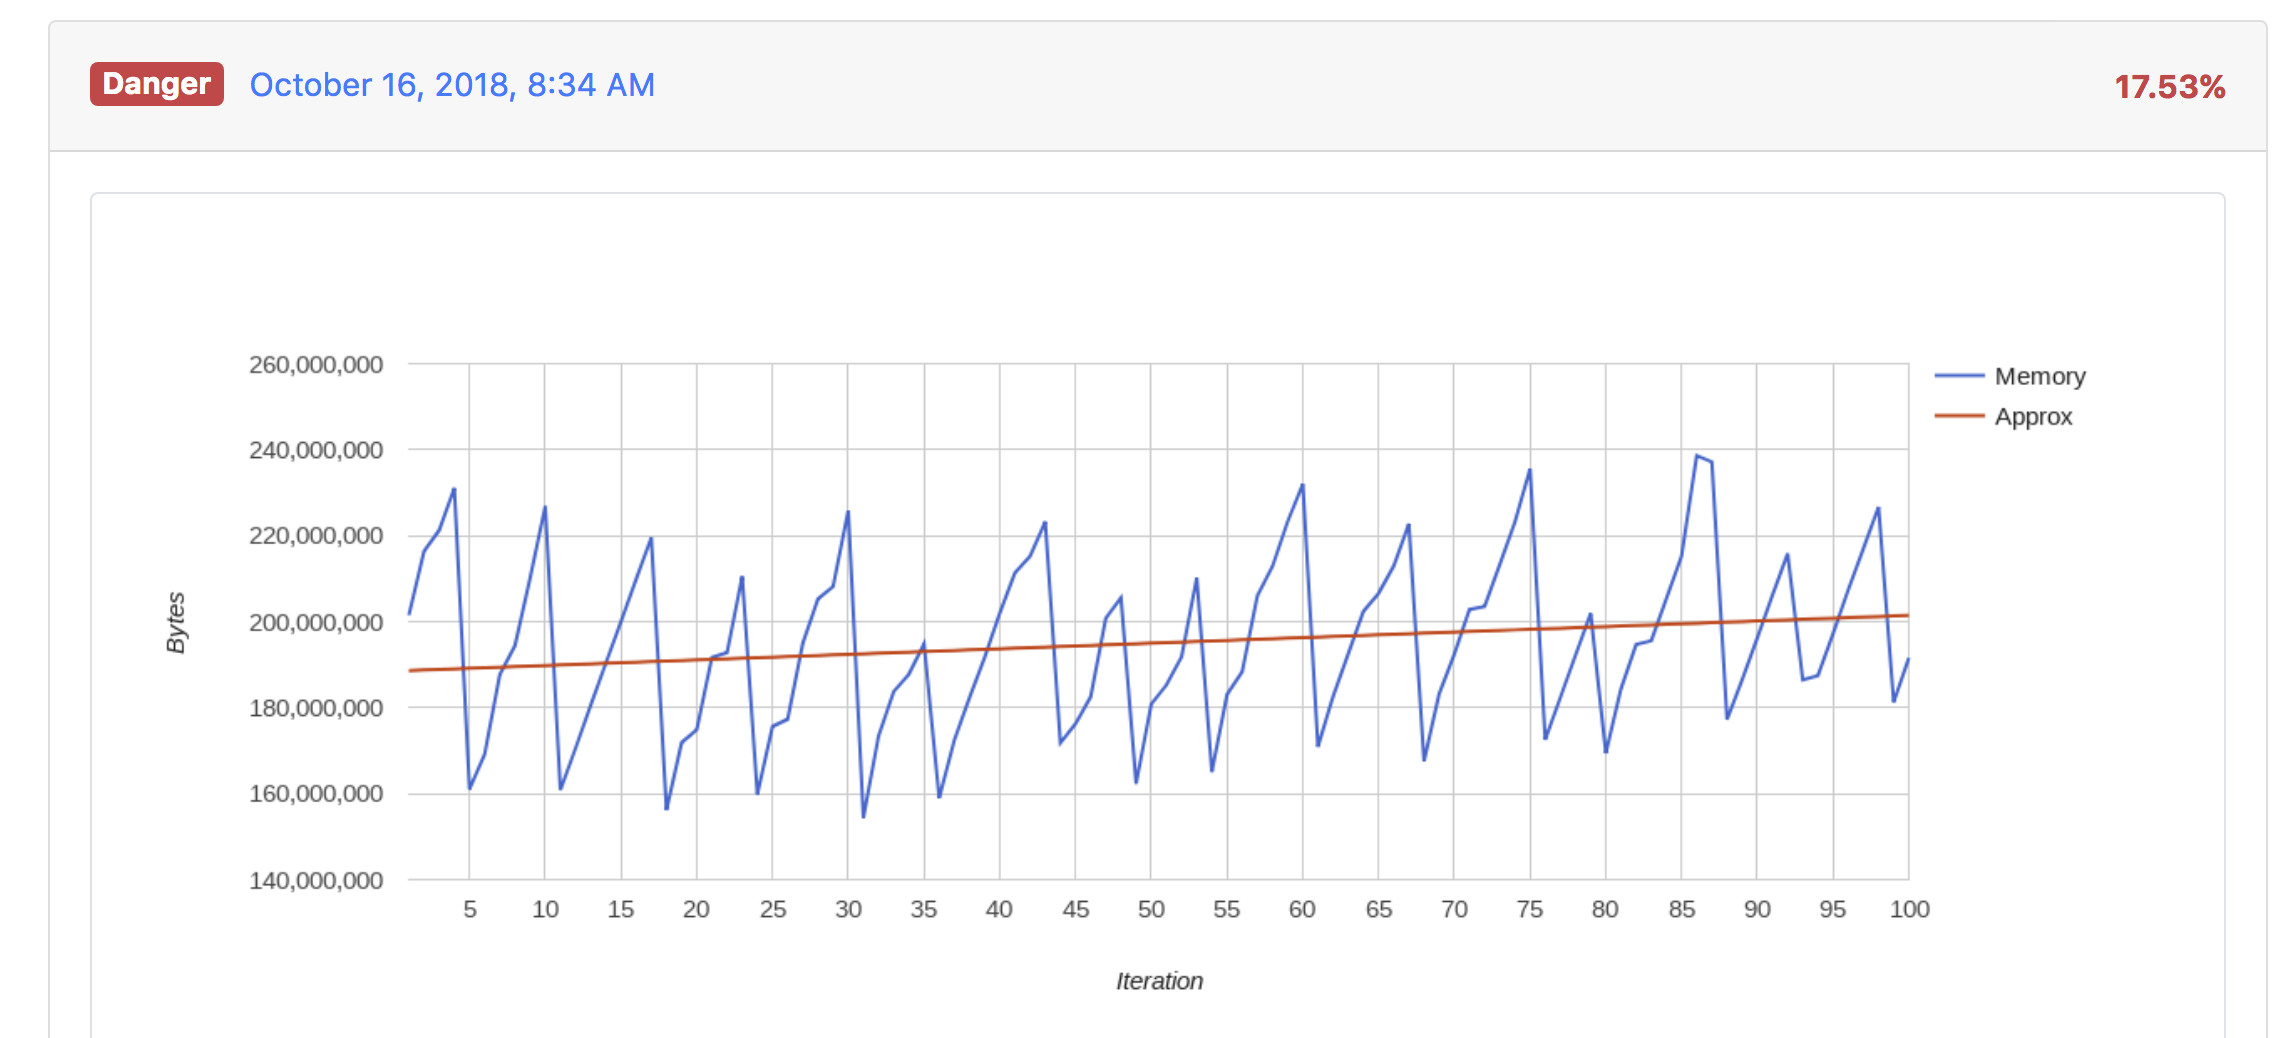
syntH. memory tests - AFTER


syntH. memory tests
import {Selector} from 'testcafe';
import {ITERATIONS_COUNT} from "../utils/consts";
import {testOnDemoAndProd, testOnProd} from "../utils/testWrappers";

fixture `Tracker memory leaks`;

testOnDemoAndProd('reports tabs', async t => {
    for (let i = 0; i < ITERATIONS_COUNT; i++) {
        await Selector('[data-button-id="cost-update"]');
        await t.click('[data-filterby="offer"]');
        await Selector('[title="Creates a new offer"]');

        t.ctx.memoryManager.snapshot();

        await t.click('[data-filterby="campaign"]');
    }
});
TestCafe + headless Chrome + CircleCI
syntH. memory tests
import {ClientFunction} from "testcafe";

export default async function initMemoryManager(t) {
    t.ctx.memoryManager = new MemoryManager();
}

class MemoryManager {
    memorySnapshots = [];

    // here it goes
    getUsedJSHeapSize = ClientFunction(() => performance.memory.usedJSHeapSize);

    async snapshot() {
        const usedJSHeapSize = await this.getUsedJSHeapSize();
        this.memorySnapshots.push([this.memorySnapshots.length + 1, usedJSHeapSize]);
    }
}
syntH. memory tests
export function testOnDemoAndProd() {
    testOnDemo.apply(null, arguments);
    testOnProd.apply(null, arguments);
}

export function testOnDemo(testName, testFunction) {
    initChart();

    test
        .page `${URL_DEMO}`
        .before(async t => {
            await initMemoryManager(t);
            await handleDemoIframe(t);
        })
        .after(makeReport)
        (`${testName} demo`, async function(t) {
            await testFunction(t, "DEMO");
        });
}
real user
measurements
tests in production
- calculations are only approximate
- yet another task that would slow down code execution on client's side
Manually calculate memory allocated on heap but:
...or look for symptoms
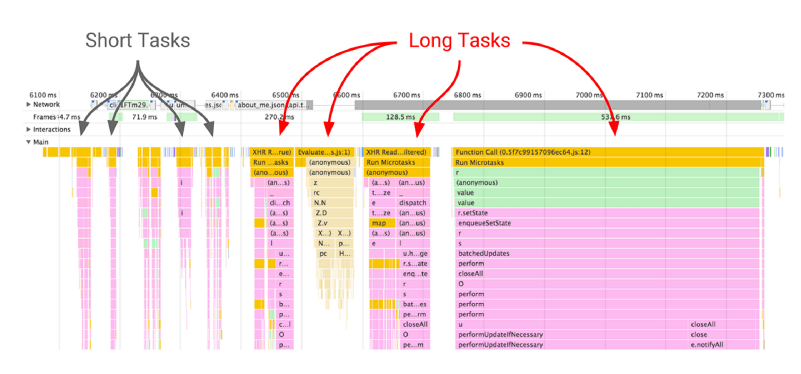
long tasks
read more at:
https://w3c.github.io/longtasks
    const observer = new PerformanceObserver(function(list) {
        const perfEntries = list.getEntries();

        // queue reporting for long tasks existance
    });

    observer.observe({entryTypes: ["longtask"]});

    // long task refers to occurrences of event loop tasks
    // or pauses caused by UI thread work
    // whose duration exceeds 50ms
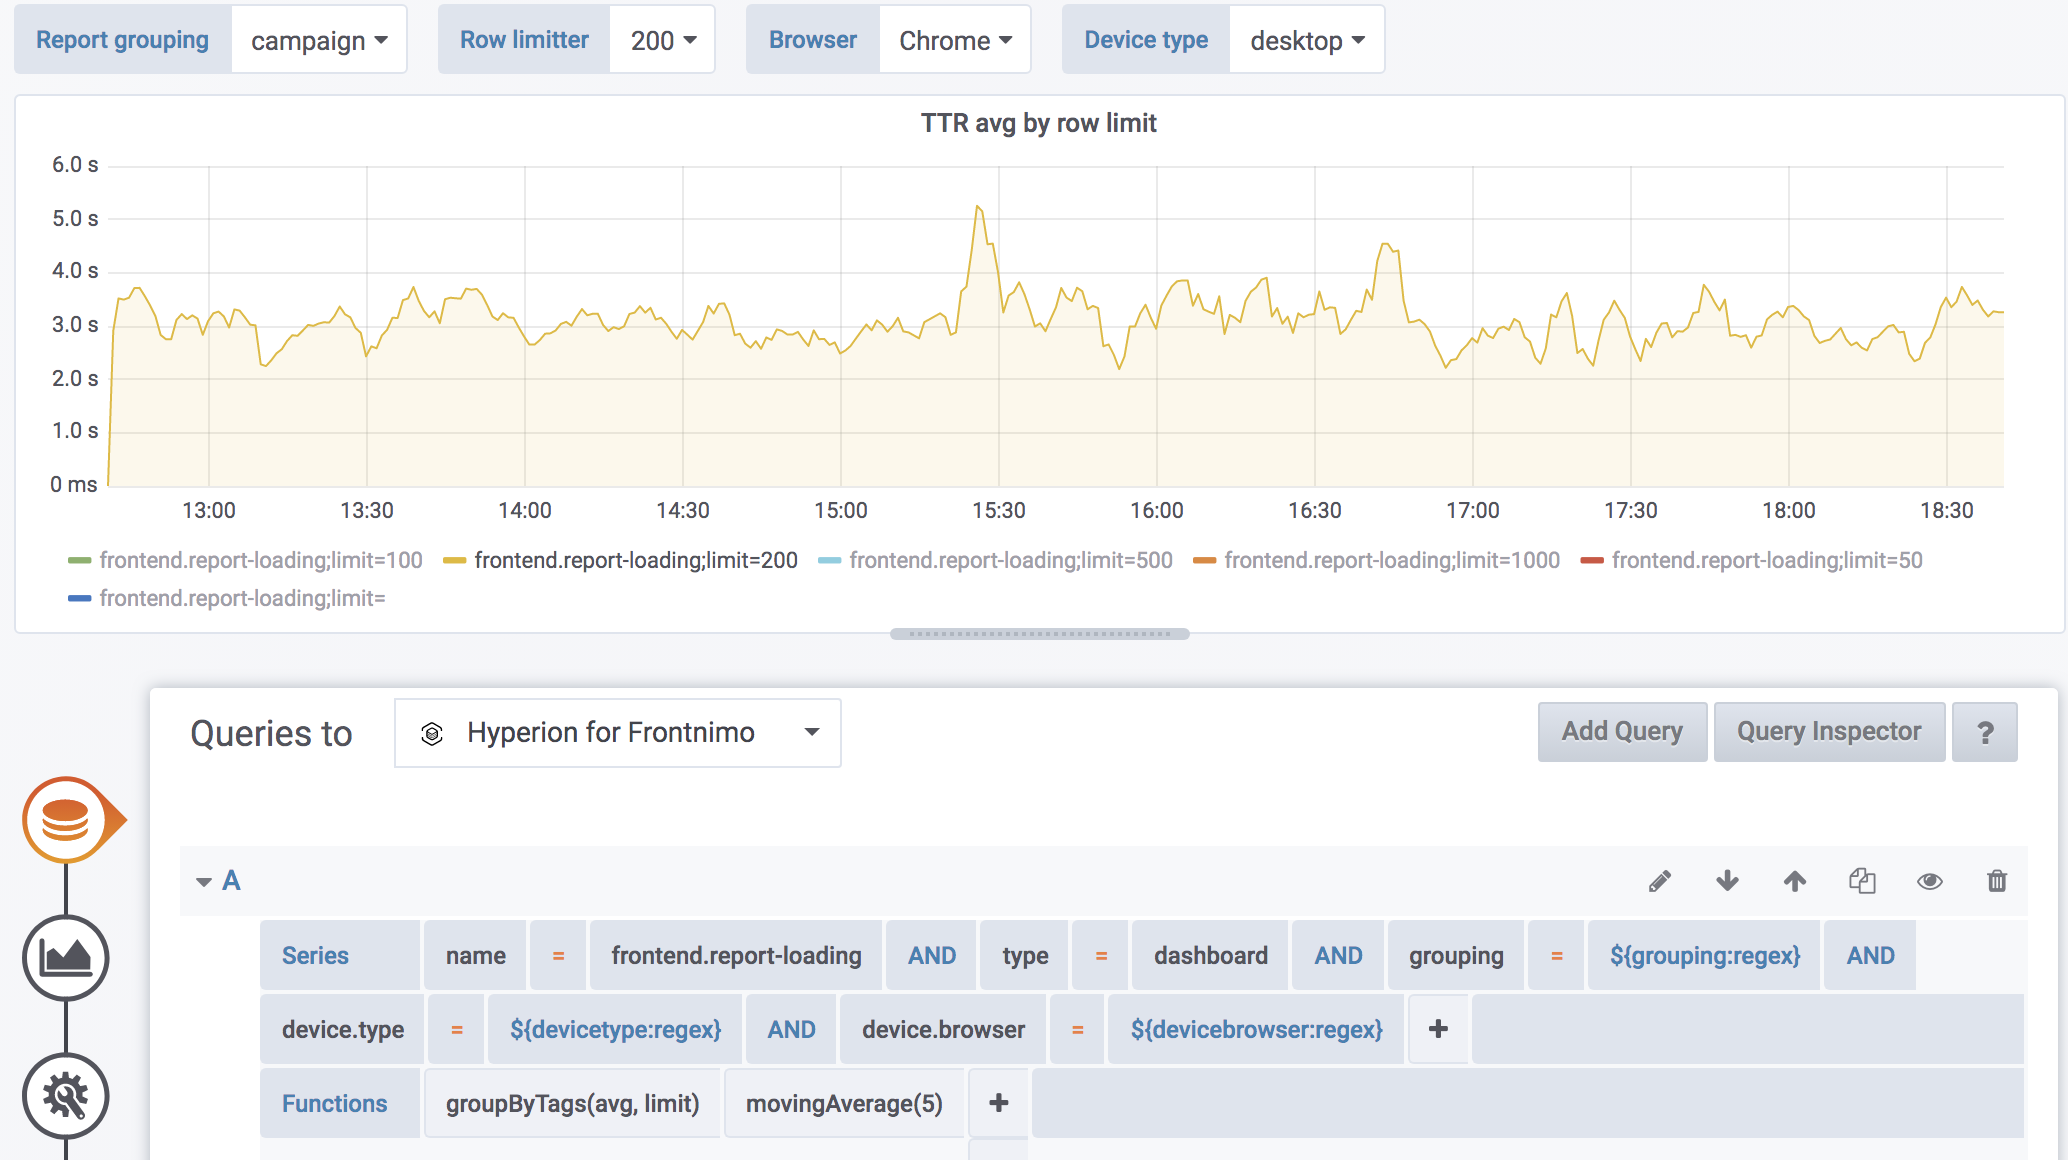
long tasks
long tasks
- chrome exclusive tho....
- ... but you get the idea of what's happening in general
downgrading percieved behavior
key take aways
- Poor performance (just like UX) could be the reason for your users to leave you!
- Tracking potential memory leaks on client's side isn't easy, but there are ways
- Over the years you won't avoid having even obvious mistakes in your code

Thank you!
@RafalRumanek

rumanek.r@gmail.com