
ENPM809V
Getting Started
What we will be covering
- Getting Familiar with Pwn.College Environment
- Learning pwndbg
- Introduction to Reverse Engineering
- Introduction to pwntools

Preliminary Knowledge
ENPM691
- We are going to build on the fundamentals of ENPM691
- Need to understand the tools and build an environment for exploiting vulnerabilities
- Combination of Reverse Engineering and Scripting
ENPM691
- We will not be going over too much on basic buffer overflows
- Review content of ENPM691
Classic Buffer Overflow
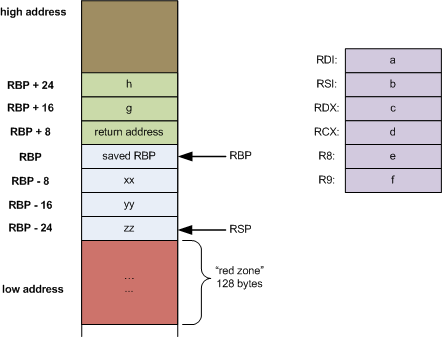
Local Variables
Parameters
Classic Buffer Overflow
What Now?
We can jump anywhere we want in our program!
What we will focus on today:
- ret2win
- ret2shellcode
Soon we will learn:
- ROP Chain
- Ret2libc
ret2win
ret2win is jumping to a function that does our desired behavior.
How do we do this?
- Choose function we want to jump to
- Get its address
- Buffer overflow
- Replace the return address with the function address (MAKE SURE IT'S IN LITTLE ENDIAN FOR X86_64)
ret2shellcode
Instead of jumping to a function, we write shellcode on the stack and jump to it
- Write shellcode
- Craft a buffer overflow payload with shellcode either at the very beginning or after return address.
- Make sure to overwrite return address to location of shellcode (or buffer)
- I recommend putting shellcode at beginning
- PROFIT
ret2shellcode
Shellcode
Padding/NOP Sled
Address to Shellcode
Shellcode
Padding/NOP Sled
Address to Shellcode
Introduction to Pwn.College
Why pwn.college
- Consistent environment for exploitation
- Comes with lots of tools
- DON'T NEED ANOTHER COMPUTER
- Browser or SSH connectable
What Pwn.College Offers
- Many exploitation tools (pwntools, pwndbg, gef, etc.)
- Emulation (helpful for kernel exploitation)
- Reverse Engineering Tools (IDA, Ghidra, Binary Ninja, etc.)
Lets Get Started!
- Go to https://pwn.college and create an account!
- Next go to the course pwn.college link (on ELMS)
- Select the classwork activity
- What is the difference between Start and Practice?
- Go to /challenge (play with the environment)
GDB and pwndbg
Why a debugger?
- We can step through a program and see what is happening at each point
- We can see values on the stack and registers as the program executes
- We can test various payloads and see if they work
- Or why they break.
Vanilla GDB Tricks
- break <addr> <func> <*func+offset>
- x/[length][format][address_expansion] - Display Bytes
- example x/20xi - Display 20 instructions
- eample x/20xg - Display
- p <val> - print the value (register, memory, etc.)
- Many many more
Reference - https://visualgdb.com/gdbreference/commands
Vanilla GDB Tricks
- ~/.gdbinit - commands for GDB to run every time
- hook-stop - Commands that are run after every step
- layout src - if you have source, show the source
- You can break out of this by doing Ctrl-x + a
- layout registers - display the registers
Reference - https://visualgdb.com/gdbreference/commands
Vanilla GDB Tricks
# This can be .gdbinit or whenever you run gdb.
define hook-stop
	x/20xi $rip
    info registers
end
Create your own hookstop!
Open pwn.college classwork and practice using the hook-stop.
pwndbg and GEF
- pwndbg and GEF are GDB Extensions
- They are designed for binary exploitation
- Pattern matching
- Better view of assembly/Registers
- etc.
Set up pwndbg/GEF
- pwn.college stores pwndebug and GEF into the /opt directory
- Other utilities are there too
- Modify your /home/hacker/.gdbinit file
- GEF: Add the line: source /opt/gef/gef.py
- pwndebug: Add the line source /opt/pwndebug/gdbinit.py
Set up pwndbg/GEF
- pwn.college stores pwndebug and GEF into the /opt directory
- Other utilities are there too
- Modify your /home/hacker/.gdbinit file
- GEF: Add the line: source /opt/gef/gef.py
- pwndebug: Add the line source /opt/pwndebug/gdbinit.py
pwndebug
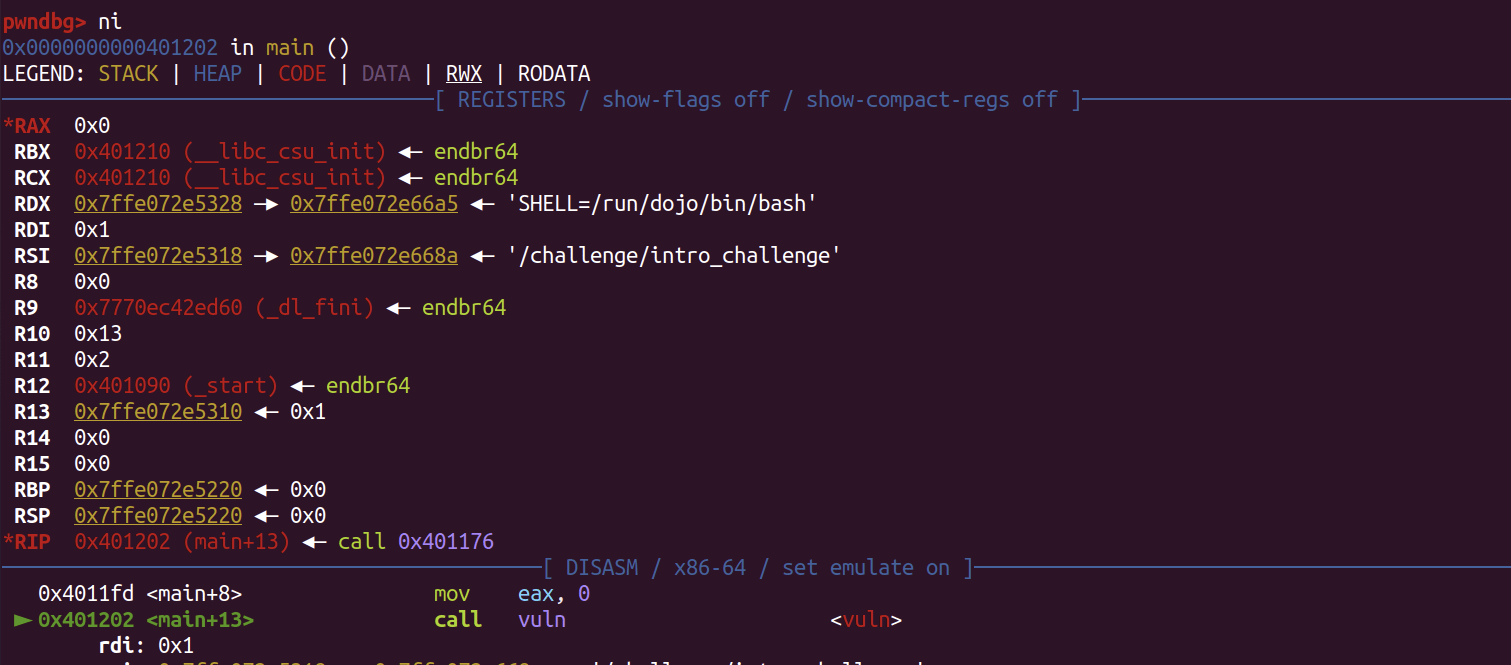
pwndbg
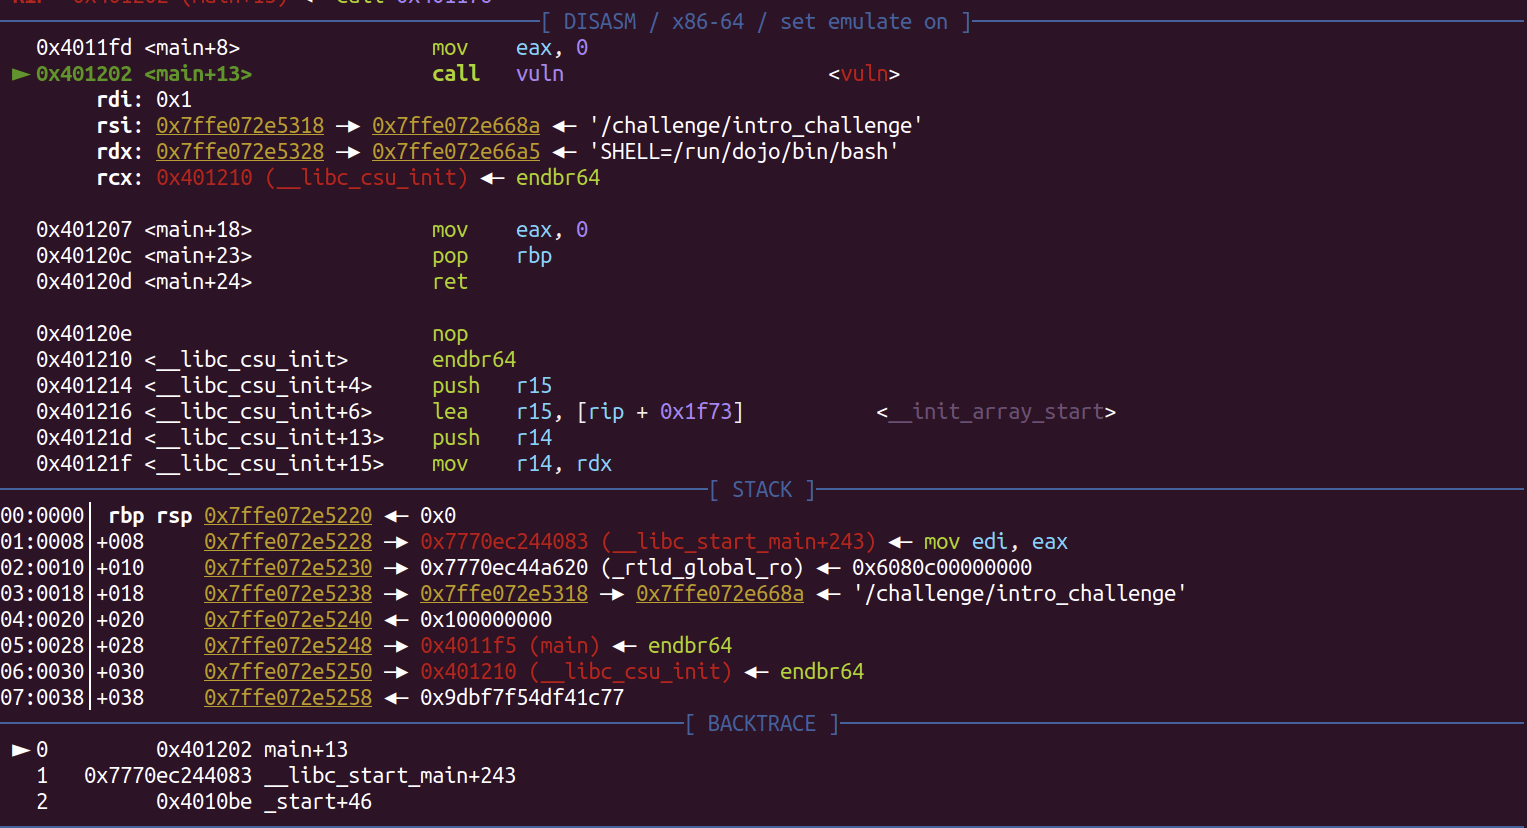
pwndbg
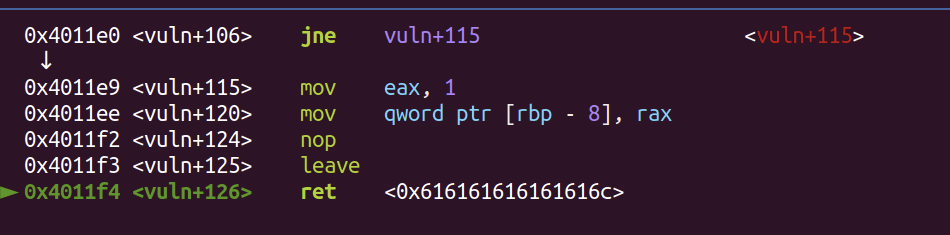
It tells you where it will return to!
pwndbg
- Lots and lots of commands: pwndbg will show them
- Important Commands:
- retaddr
- pwndebug heap
- pwndebug kernel
- cyclic
Demonstration
Reverse Engineering
Why Reverse Engineering?
- You are not necessarily going to have source code when determining vulnerabilities.
- Need to have some tools under your tool belt to figure this out
Static Reverse Engineering Tools
- Ghidra - Developed by NSA. Excellent decompiler, has scripting
- Binary Ninja - Made by Vector35
- radare2 - Open source - commandline. Super scriptable and extensible (r2ghidra)
- IDA Pro - The "gold standard" for Windows reverse engineering. Decompiler requires license.
Ghidra
- Ghidra - Developed by NSA. Excellent decompiler, has scripting
- Has an awesome decompiler!
- Lots of little things to make your life easier
- Easier to work with right out of the box
- DEMO!
Binary Ninja
- Developed by Vector35
- Is modern and sleek compared to its competitors
- Has an awesome graph view and decompiler
- Has the ability to support plugins in Python, C++, and rust
- Has a good debugger
- DEMO!!!!
Radare2
- Open Source (just like Ghidra is open source)
- The Vim of reverse engineering
- Hard to learn, but can be used
- Ability to script and add plugins
- Has the ability to support Ghidra Decompiler
- Has a GUI called Cutter
- DEMO!
IDA Pro
- The original decompiler
- Definitely not open source (EXPENSIVE)
- Has a free version without the decompiler
- Can be very good at disassembling Windows and C++
- Has a good debugger and graph view
- Has scripting, but is very sensitive to the version
Dynamic Reverse Engineering Tools
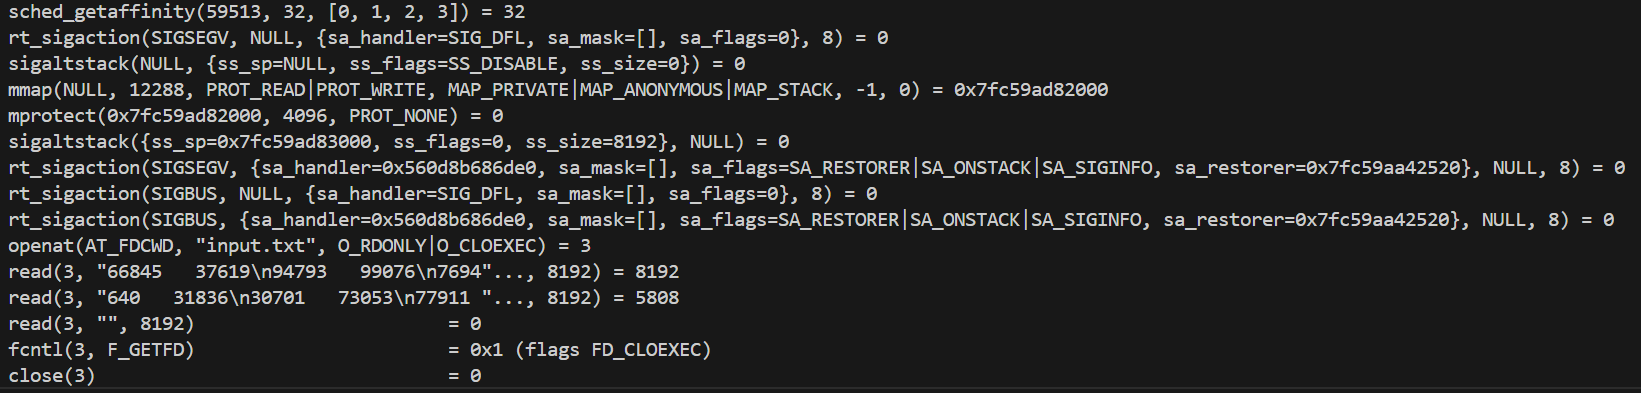
strace and ltrace
- Useful for seeing system calls and library calls
- Executes the binary and lists any time it sees a system call or library call
valgrind
- Memory tracker/leak detector
- Useful for debugging memory errors/determining if there is a memory vulnerability.
- Helpful for finding use-after-free, memory leaks, etc.
- This is more of a debugging tool than a vulnerability finder, but still useful to detect if something exists.
strace /path/to/binary
Tracers
- Tracers are great to determine whether certain code, system calls, or operating system behaviors are occurring.
- Can hook a function and execute log messaging before and/or after the function is executed
- Modify input/output based on parameters/return values.
Tracers
- uprobes/uretprobes - userspace tracer for functions
- kprobes/kretprobes - kernel tracer
- uprobes and kprobes hook on a particular function (either in userspace or kernel space)
- ftrace - kernel function tracer (similar to kprobes)
- perf-events - hardware performance counters
- eBPF - has all of the above plus more
- Many many others. Each with their own API.
pwntools
What is pwntools
- A suite of python scripts to help make exploitation prototyping easier (for Linux)
- Helps to create shellcode
- Helps with debugging
- Helps with remote exploitation
- Automating exploit creation
- Easier to parse ELFs
- Much much more....
Installing pwntools
- python3 -m pip install pwntools
- This is already done for you on pwn.college
How do I start?
# NOTE: This whole thing can be automated with (pwn template /path/to/binary > solve.py)

from pwn import *

#define the binary we are going to work with
exe = context.binary = ELF("/path/to/binary")

"""
If we want to create a new test process without GDB
"""

io = process([exe.path, arg1, arg2, ...])

"""
If we are going to debug
"""
# Optional gdb script if we are going to debug

gdbscript = '''
break main
break func1
continue
'''

io = gdb.debug([exe.path, arg1, arg2, ...], gdbscript=gdbscript)
Interacting with the Binary
# Receive until it sees the data specified
io.recvuntil(b"line from stdio")

#Send as a new line
io.sendline(b"line to send")

# Sends without the new line
io.send(b"data to send")

# Receive until seeing a new character
io.recvline()

# combination of recvuntil and send
io.sendafter(b"data to recv", b"data to send")

# Combination of recvuntil and sendline
io.sendlineafter(b"data to recv", b"data to send in newline")
Shellcraft
- pwntool's shellcode writing utility (for various architectures)
- Many different python methods to generate specific shellcode.
- Assemble it via asm function
- Example:
- shellcraft.cat("/flag")
- shellcraft.sh()
- shellcraft.mov('r9', 0x1234)
- More here: https://docs.pwntools.com/en/dev/shellcraft.html
Logging
- Generate messages for various purposes (better than just printing)
- log.debug(msg)
- log.info(msg)
- log.warning(msg)
- log.error(msg)
- etc.
Others
- Pwntools ROP Library (will be covered later)
- fmtstr - for format string based exploitation
- p32, p64, u32, u64 - Packing and unpacking bytes of certain bits (good for addresses)
- Fit and flat - functions for packing whole payloads
- iters - extension of itertools
- cyclic - for creating repeatable patterns
- Net - for working with network interfaces
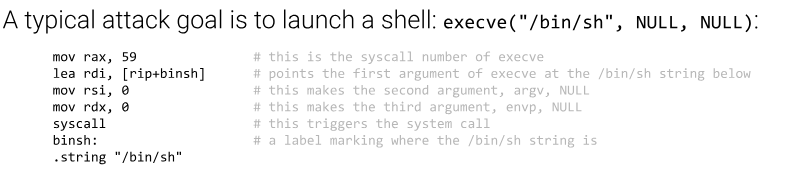
Shellcoding
What is shellcoding
- Small piece of code used to gain further access into a vulnerability (generally written in assembly).
- Often called shellcode because it is used to get a shell
- Often chaining together various system calls
- Don't have access to library calls as often in shellcode.
What is shellcoding
# binsh shellcode
   0:    6a 68                    push   0x68
   2:    48                       dec    eax
   3:    b8 2f 62 69 6e           mov    eax,  0x6e69622f
   8:    2f                       das
   9:    2f                       das
   a:    2f                       das
   b:    73 50                    jae    0x5d
   d:    48                       dec    eax
   e:    89 e7                    mov    edi,  esp
  10:    68 72 69 01 01           push   0x1016972
  15:    81 34 24 01 01 01 01     xor    DWORD PTR [esp],  0x1010101
  1c:    31 f6                    xor    esi,  esi
  1e:    56                       push   esi
  1f:    6a 08                    push   0x8
  21:    5e                       pop    esi
  22:    48                       dec    eax
  23:    01 e6                    add    esi,  esp
  25:    56                       push   esi
  26:    48                       dec    eax
  27:    89 e6                    mov    esi,  esp
  29:    31 d2                    xor    edx,  edx
  2b:    6a 3b                    push   0x3b
  2d:    58                       pop    eax
  2e:    0f 05                    syscall
Properties of Shellcode
- Cannot have null characters.
- Position Independent
- Smaller = Better
- Self-Contained (as much as possible)
Why?
How do I write Shellcode
- Use pwn.tools
- Use C/Assembly and compile/assemble it
How do I write Shellcode
- pwn.tools has the shellcraft library (as mentioned earlier) which can generate shellcode
- Can be used via command line or in python script
#asm uses the assembler to write it
#shellcraft generates the assembly
shellcode = asm(shellcraft.sh())
How do I write Shellcode
- To use GCC/Assembly - you first write your shellcode (this example uses assembly)
- Assemble it:
gcc -nostdlib -static shellcode.s -o shellcode-elf
- Extract the text section using objcopy
objecopy --dump-section .text=shellcode-raw shellcode.elf
How do I Run Shellcode
- You need a mechanism for executing it in a binary program.
- Exploit that executes shellcode
- Allocate memory
- Create a test program to execute it
Creating a Test Program
/* Create a program with the following lines */

//Allocate memory
page = mmap(0x1337000, 0x1000, PROT_READ|PROT_WRITE|PROT_EXEC, MAP_PRIVATE|MAP_ANON, 0, 0);
//Read shellcode into the mmaped memory
read(0, page, 0x1000);
//Execute the mmapped memory
((void(*)())page)();
Commands Reference

Source: pwn.college
Classwork
Classwork
- You have some 32 bit vulnerable binaries to exploit.
- Practice some of the tools that you are learning on these binaries.
- Get comfortable with debugging
- Practice Vanilla GDB
- Practice GDB with an extension (recommend pwndbg)
- Start using reverse engineering tools!