Characterizing the Complexity of
ML-Enabled Systems
2026
Institute of Mathematics and Statistics (IME)
University of São Paulo (USP) – Brazil
Jheronimus Academy of Data Science (JADS)
Technical University of Eindhoven (TUe) / Tilburg University (TiU) – The Netherlands
MLOps Complexity Metrics

Thesis

Slides
https://renatocf.xyz/phd-defense-live
Renato Cordeiro Ferreira
Our goal was to
characterize the complexity of
ML-Enabled Systems
allowing devs to choose which kind of complexity to add to their systems:
code / data / model
Contributions
Dimensions of Complexity
of MLES
S1
MLOps
Reference
Architecture
S2
MLOps
Complexity
Metrics
S3
Patterns / Practices Reusability
MLES
T1
Case Study
OCEAN GUARD
MLES
T2
Publications
All available at https://renatocf.xyz/research-gate
Discussed in the presentation
Out of scope
20
supervisions
Brazil
10
supervisions
Netherlands
4
primary
used in the thesis
6
secondary
related to SE4AI
7
tertiary
other activities
Research
Questions
Research Questions
Which metrics can characterize the complexity
of ML-enabled systems?
How can complexity metrics be operationalized
over an ML-enabled systems?
RQ1
RQ2
RQ3
What is the applicability of the complexity metrics by developers of ML-enabled systems?
Research Questions
How do developers of MLES accept
the complexity metrics?
How do developers of MLES understand
the complexity metrics?
RQ3.1
RQ3.2
RQ3
What is the applicability of the complexity metrics by developers of ML-enabled systems?
Research
Methodology

Phase 1
Understanding
the architectural
complexity of MLES
Phase 2
Analyzing
the architectural
complexity of MLES
Phase 3
Assessing
the architectural complexity of MLES
Step 1.1
Systematic
Mapping Study
Step 1.2
Measurement
Theory
Step 2.1
Longitudinal
Case Study
Step 2.2
Longitudinal
Case Study
Step 3.1
Survey
Study
Step 3.2
Focus
Group
Phase 1
Phase 2
Phase 3
Step 1.1
Systematic
Mapping Study
Step 1.2
Measurement
Theory
Step 2.1
Longitudinal
Case Study
Step 2.2
Longitudinal
Case Study
Step 3.1
Survey
Study
Step 3.2
Focus
Group
Phase 1
Phase 2
Phase 3
S1
S2
T1
T2
S3
T1
T2
S3
S3
S1
Systematic
Mapping Study

Search query executed on
The ACM Guide to Computing Literature
ML-Based System was popular first
ML-Enabled System became popular later
Searched on title, abstract or body

Reference Analysis
Key conferences / workshops on SE4AI
Classification
based on body
Classification
based on abstracts

Automated snippet extraction
Based on the suffix "complex"
In particular, "complexly"
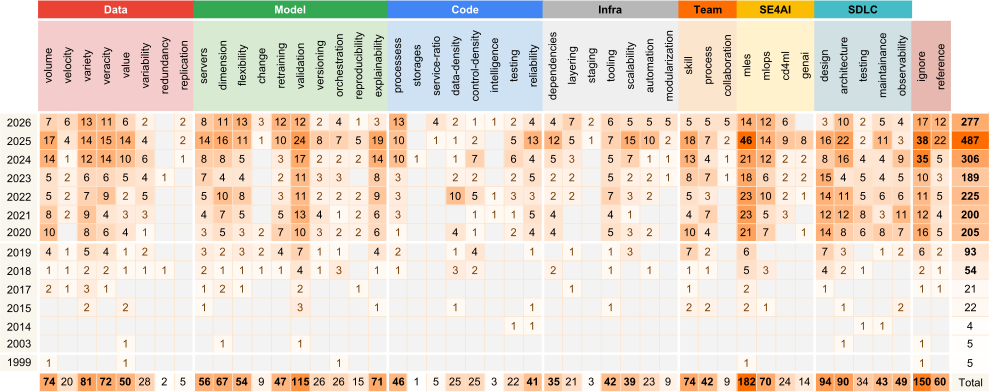
Codes Assigned to Papers
During the Keywording Stage of the SMS

Minor categories
highlighted were inspired by the MLOps Complexity Metrics
Three of the
major categories
were based on the
dimensions of change of MLES
Four other
major categories
emerged during
the keywording
of the SMS
No categories
correspond to
auxiliary codes
such as ignore
or reference
Dimensions of
Complexity of MLES
S1
Reference
Architecture
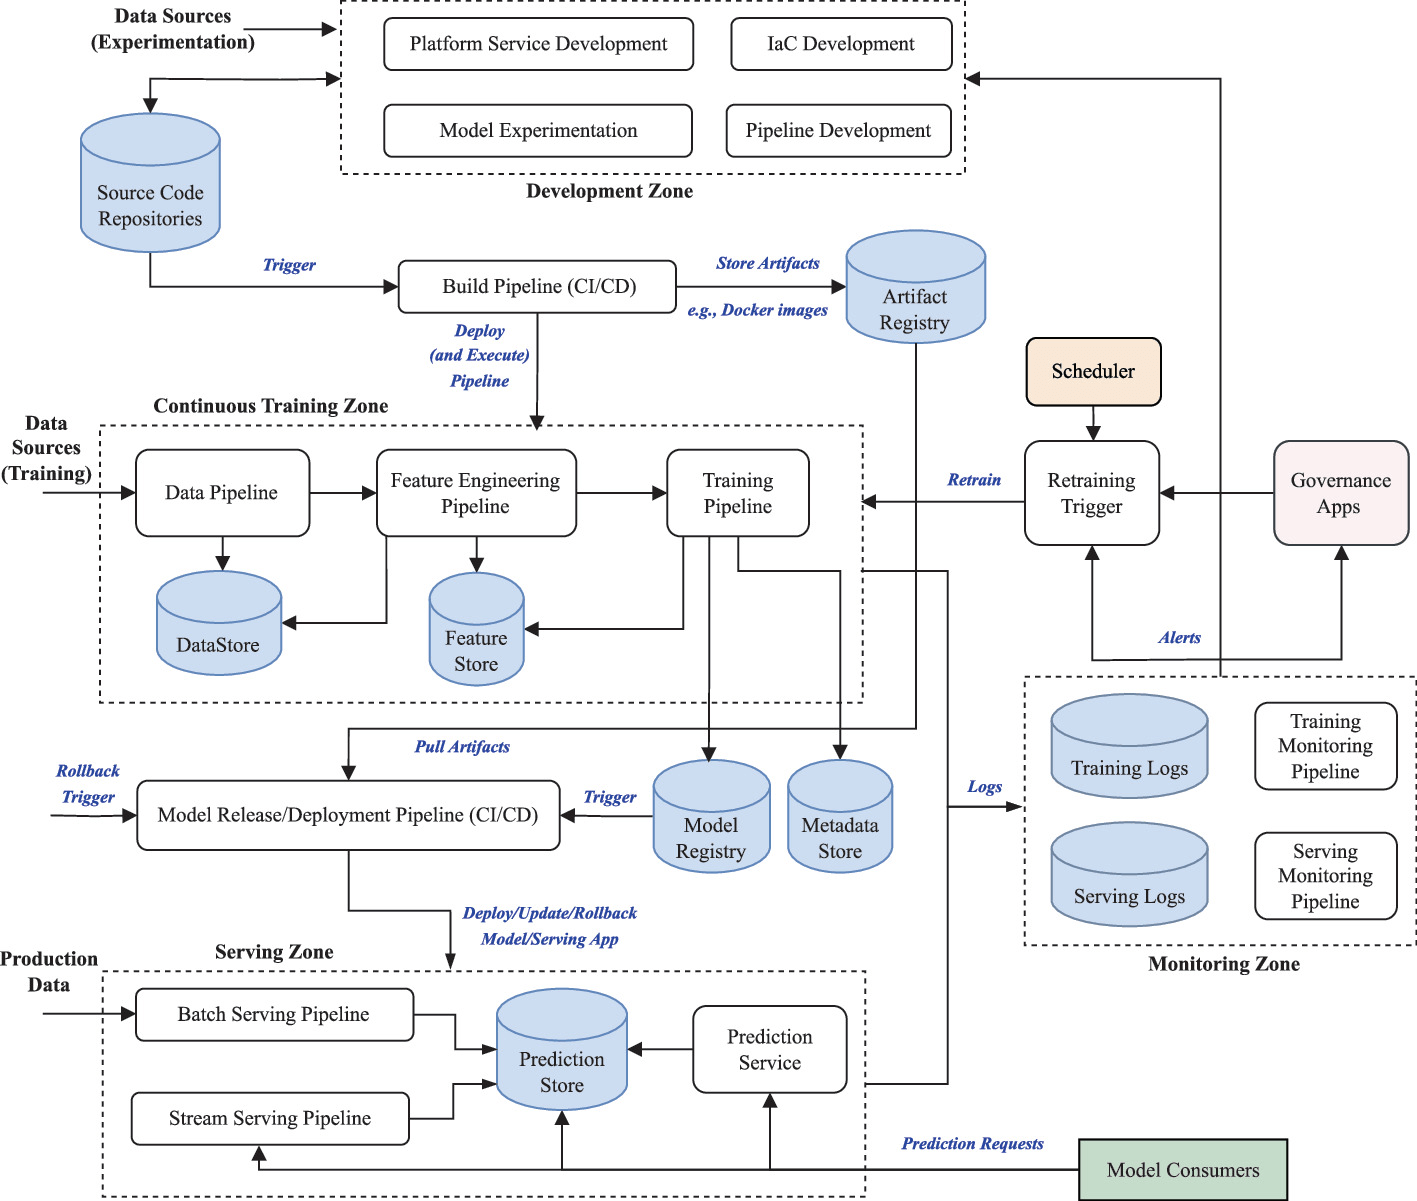

Published at:
ECSA 2025
MLOps in Practice:
Requirements and a Reference Architecture from Industry
renatocf.xyz/ecsa25-paper
Some modules are not grouped
Data sources are not represented

New subsystems
Existing subsystems

Published at:
DS @ CAIN 2025
A Metrics-Oriented Architectural Model
to Characterize Complexity on
ML-Enabled Systems
renatocf.xyz/cain25-paper
MLOps
Reference Architecture
S2
OCEAN GUARD
Architecture

Core Dev Team
Scientific Programmers
Innovation Team
PDEng Trainees
Research Team
MSc Students
UI Dev Team
Hired Developers

Published at:
SummerSOC 2025
MLOps with
Microservices:
A Case Study in the Maritime Domain
renatocf.xyz/ssoc25-paper

Published at:
SAiP @ ICSA 2026
Reusability
in MLOps:
Leveraging Ports and
Adapters to Build a
Microservices Architecture
for the Maritime Domain
renatocf.xyz/icsa26-paper

Patterns / Practices
Reusability
MLES
T1

Development
Sequence
shows the order components were built according to the commit history
MLOps
Complexity Metrics
Data
Volume
Value
Velocity
Variety
Veracity
Model
Retraining
Dimension
Flexibility
Change
Servers
Code
Processes
Control Density
Storages
Service Ratio
Data Density
Data
Inspired by
Data
Engineering
+
Big Data
Model
Inspired by
Machine Learning
Engineering
+
Data Science
Code
Inspired by
Software
Architecture
+
Microservices
Data
Volume
the average number of bytes collected by the architecture in a daily run
Velocity
the average number of bytes collected by the architecture per second
Variety
the number of features collected by the
architecture
Veracity
the lenght of the longest path of data flow
connecting a data source and a model
Value
the percentage of features used over features collected by the architecture
Model
Servers
the number of model servers included in the architecture
Dimension
the sum of parameters * input features
for all models included in the architecture
Flexibility
the sum of hyperparameters for all models
included in the architecture
Change
the highest expected rate of change
by a model in the architecture
Retraining
the highest expected rate of retraining
by a model in the architecture
Code
Processes
the number of process components
(services + pipelines) in the architecture
Storages
the number of storage components
in the architecture
Service Ratio
the percentage of services over processes
(services + pipelines) in the architecture
Data Density
the percentage of existing over possible data flow connections in the architecture
Control Density
the percentage of existing over possible control flow connections in the architecture
MLOps
Complexity Metrics
S3
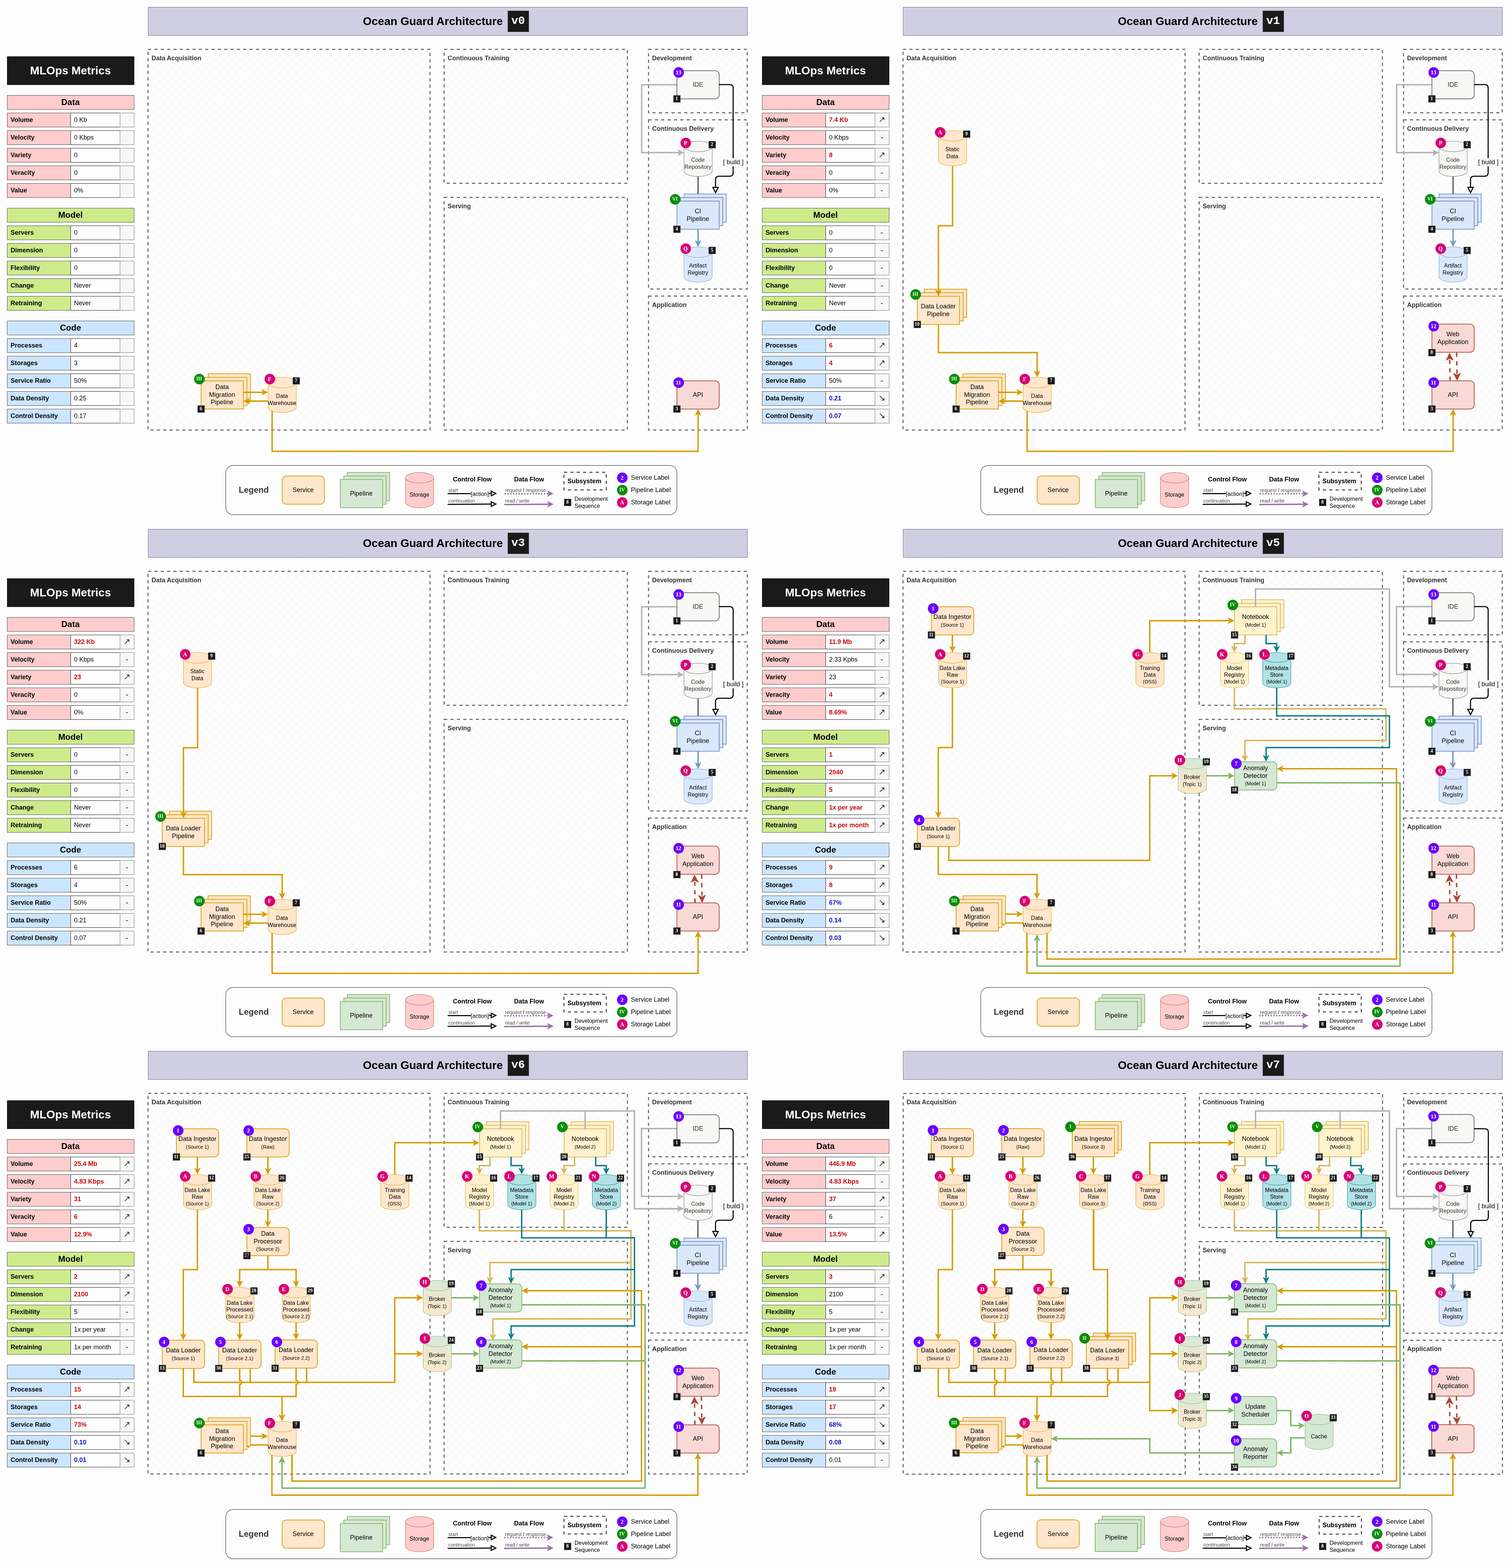
OCEAN GUARD
Complexity Metrics
Data
Volume
Value
Velocity
Variety
Veracity
0 b
0 bps
0
0
0%
v0
7.4
Kb
0 bps
8
0
0%
v1
322
Kb
0 bps
23
0
0%
v3
8.3
Mb
2.33
Kbps
23
0
0%
v4
1.9
Mb
2.33
Kbps
23
4
9%
v5
25.4
Mb
4.83
Kbps
31
6
13%
v6
446.9
Mb
4.83
Kbps
37
6
14%
v7
Model
Retraining
Dimension
Flexibility
Change
Servers
0
0
0
Never
Never
v0
0
0
0
Never
Never
v1
0
0
0
Never
Never
v3
0
0
0
Never
Never
v4
1
2040
5
1x per year
1x per month
v5
2
2100
5
1x per year
1x per month
v6
3
2100
5
1x per year
1x per month
v7
Code
Processes
Control Density
Storages
Service Ratio
Data Density
4
3
50%
0.25
0.17
v0
6
4
50%
0.21
0.07
v1
6
4
50%
0.21
0.07
v3
7
4
71%
0.20
0.05
v4
9
8
67%
0.14
0.03
v5
15
14
73%
0.10
0.01
v6
19
17
68%
0.08
0.01
v7
Case Study
OCEAN GUARD
MLES
T2
Survey
Questions
Consent
Mandatory
1
Demographic
Multiple Choice
8
Tech Assessment Model
Likert Scale
21
Critique
Open-Ended
12
Associative
Grid
2
Future Results
Optional
1
June 24th 2026 - July 23rd 2026
27 participants
Technology Assessment Model
User
Acceptance
Perceived
Usefulness
Perceived
Ease of Use
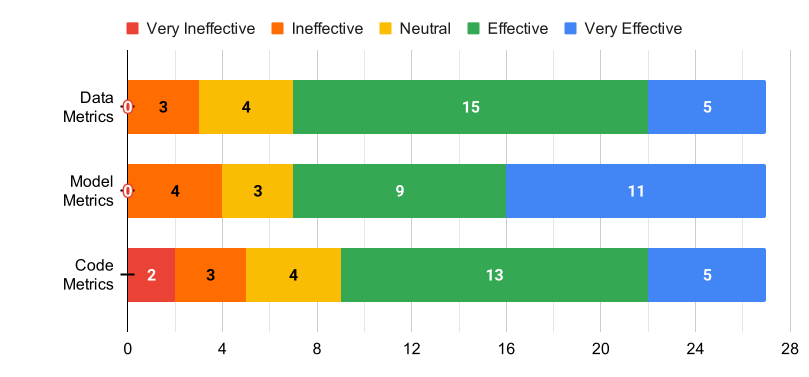
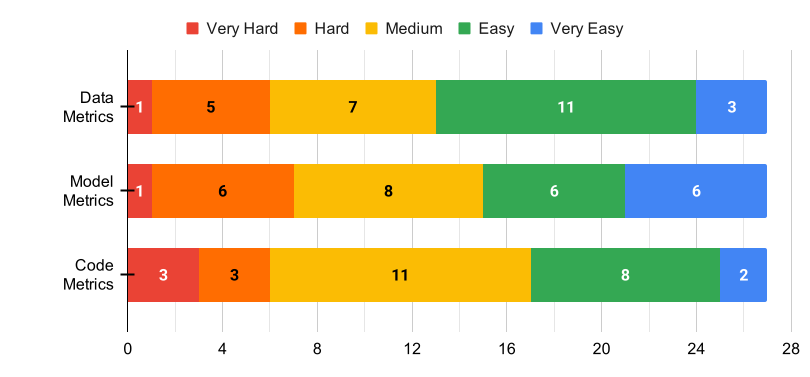
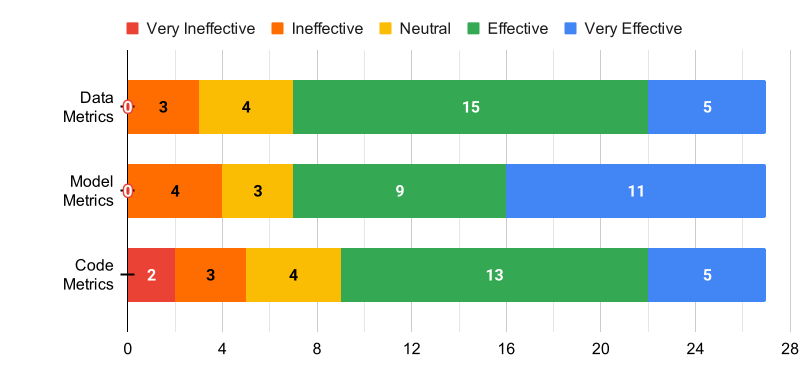
A large majority of the participants (at least 2/3, 66.7%)
perceived the metrics as effectively useful
Technology Assessment Model
Perceived Usefulness
#1
#2
#3
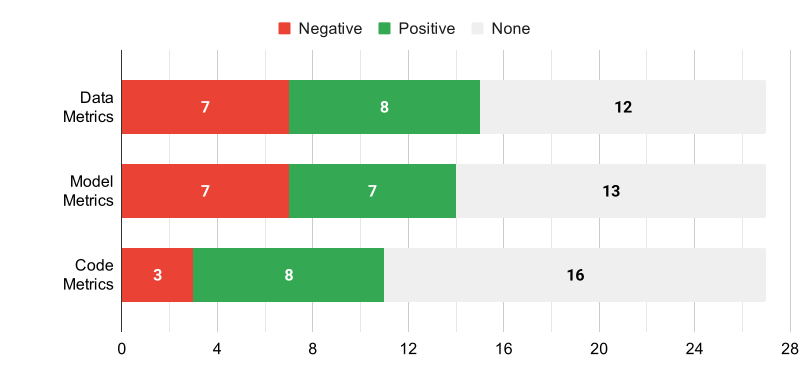
Technology Assessment Model
Perceived Usefulness
#2
#1
#1
+40% of the participants made remarks
I’m not sure that being able to measure the complexity of a given MLE is particularly useful, at least from my experience. Code complexity and COST are more relevant IMO.
Based on my experience, people would agree these kind of metrics are useful, but they would stop worrying about them.
Technology Assessment Model
Perceived Ease of Use
A minority of the participants (~1/4, 25%)
perceived the metrics as hard to use
A larger cohort (>1/3, 37%)
considered them easy to use
#2
#1
#3
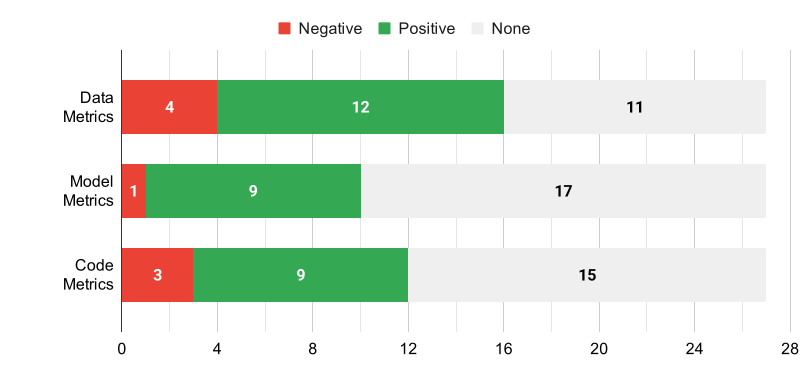
Technology Assessment Model
Perceived Ease of Use
#2
#1
#2
+1/3 of the participants made remarks
These metrics are harder to automatically assess, since parts of MLES are prone to be
merged, separated or rewritten along the development processes, either by a change in
project goal or by evaluating bottlenecks.
All of these metrics should be easily identified and answearable through basic
architectural documentation that should not demand much effort to obtain in a minimally organized development team.
Technology Assessment Model
User
Acceptance
Personal
Perspective
Potential
Adoption
Ease of
Application
Recommen-
dation
Potential Use in Industry
Industry
Perspective
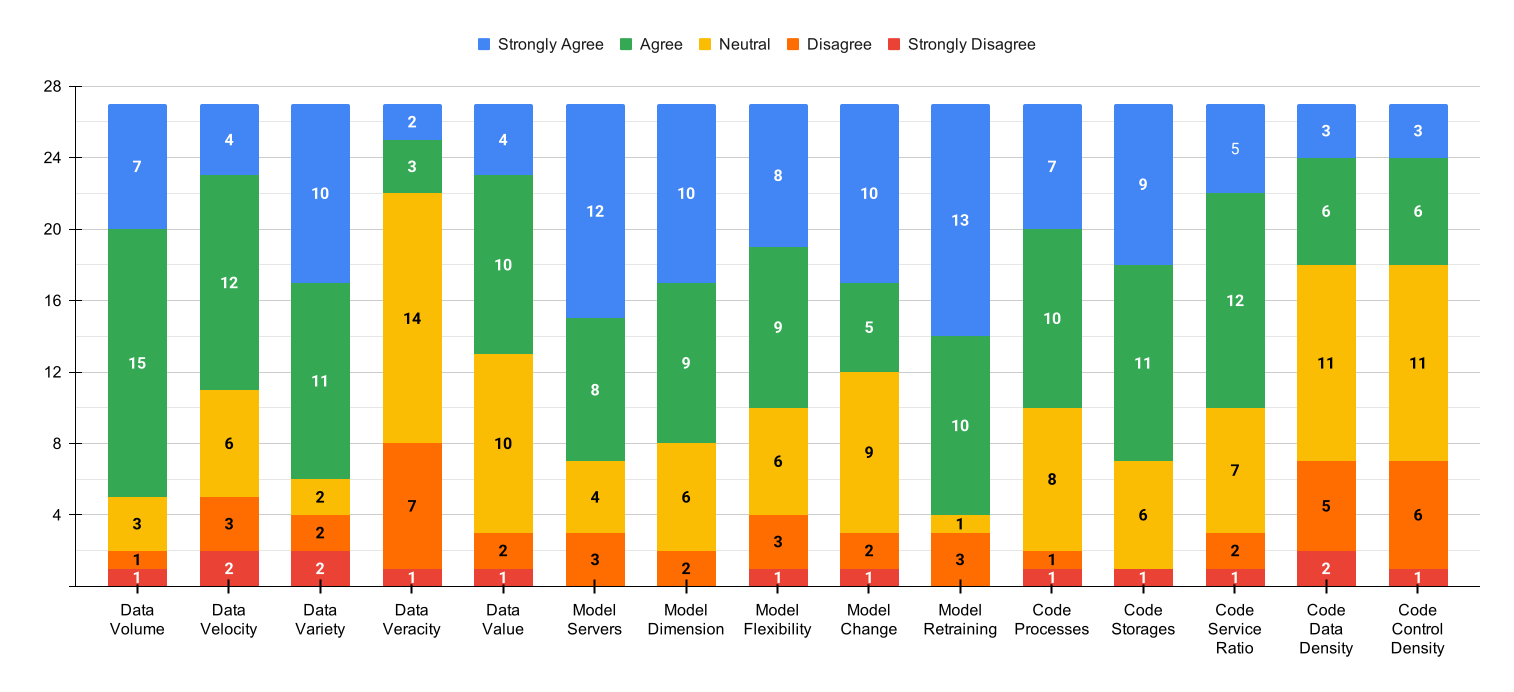
Ease of Application
"It would be easy for me to apply the metric to measure the complexity of my MLES"
12 metrics (80%) were considered easy to apply
(at least 50% agreement with the statement)
Potential Adoption
"I see a potential in the adoption of the metric to understand the complexity of my MLES"
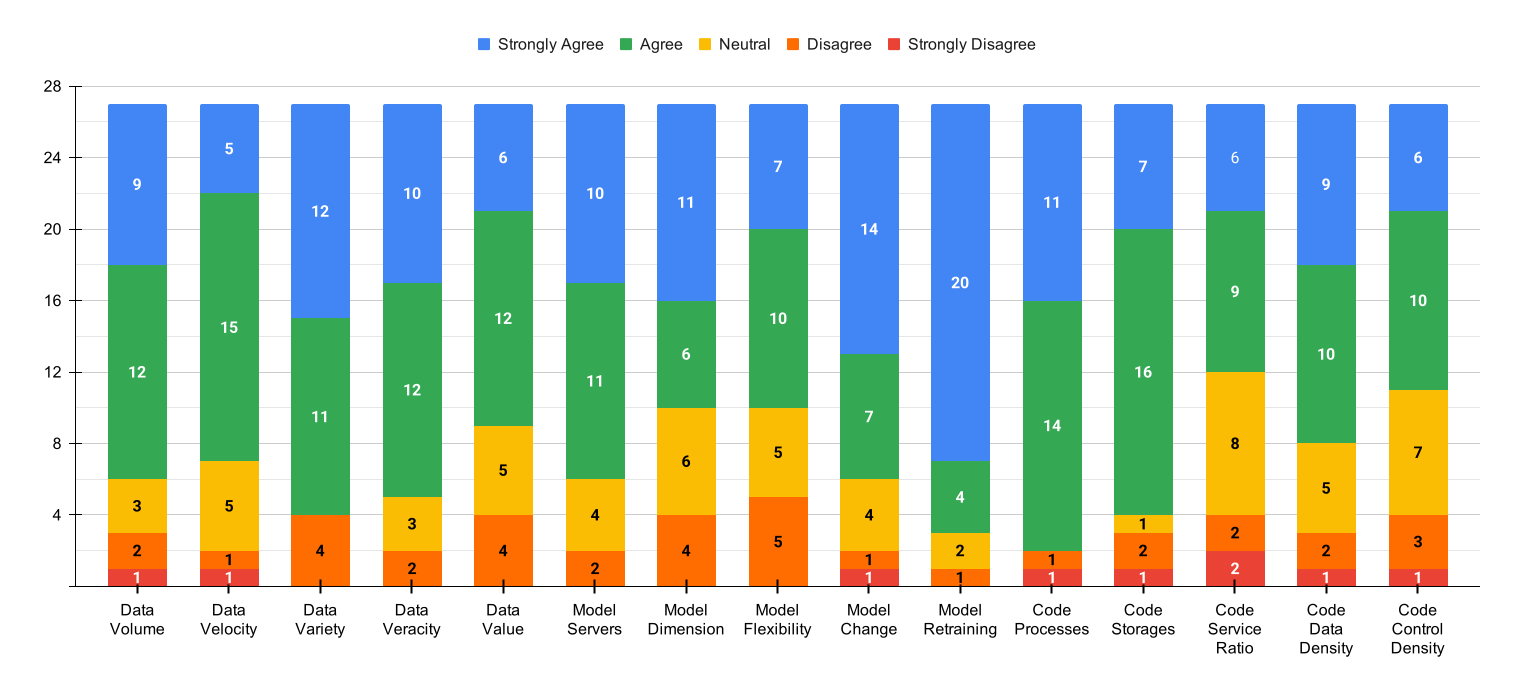
All metrics were considered potentially adoptable
(at least 50% agreement with the statement)
Recommendation
"I would recommend the metric to automate the measurement of complexity of MLES"
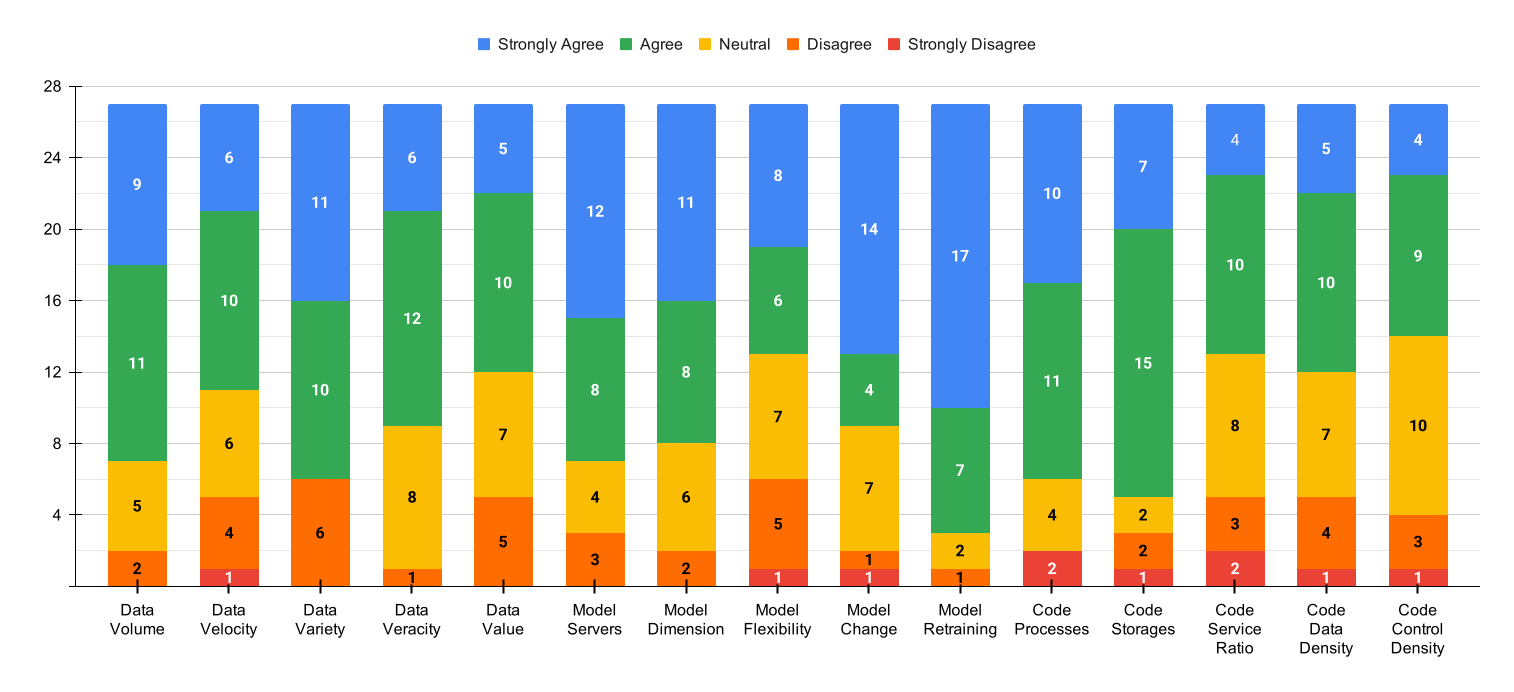
13 metrics (86.7%) were considered recommendable
(at least 50% agreement with the statement)
Potential Use in the Industry
"If I am working at a company in the future, I would like to use the metric to measure the complexity of my MLES"
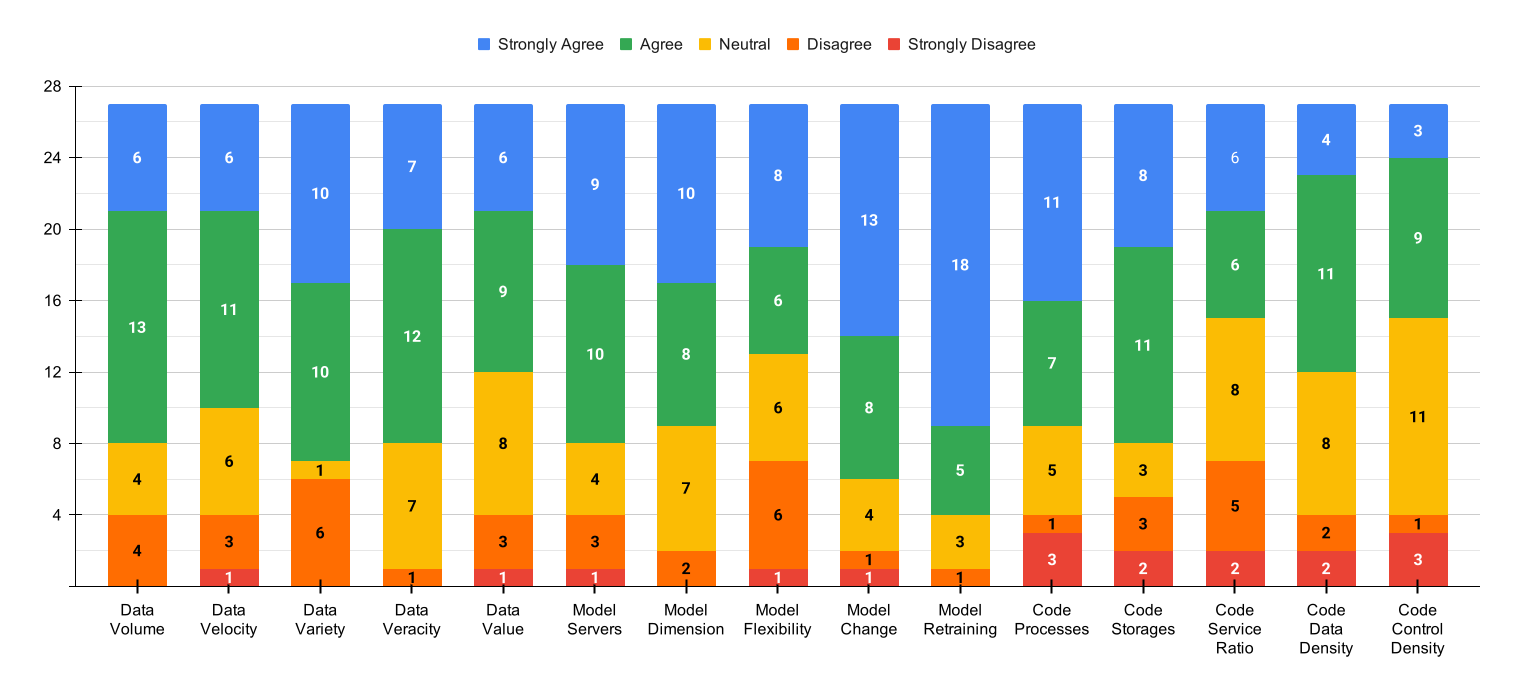
13 metrics (86.7%) were considered
potentially usable in the industry
(at least 50% agreement with the statement)
To what extent do the developers of MLES accept the metrics?
RQ3.1
high level of
acceptance
15 / 15
potentially adoptable
personally
12 / 15
easy to apply
13 / 15
recommendable
10 / 15
potentially adoptable
in the industry
[The metrics] appear especially useful for comparing different versions of the same architecture, identifying complexity trends, and supporting architectural discussions.
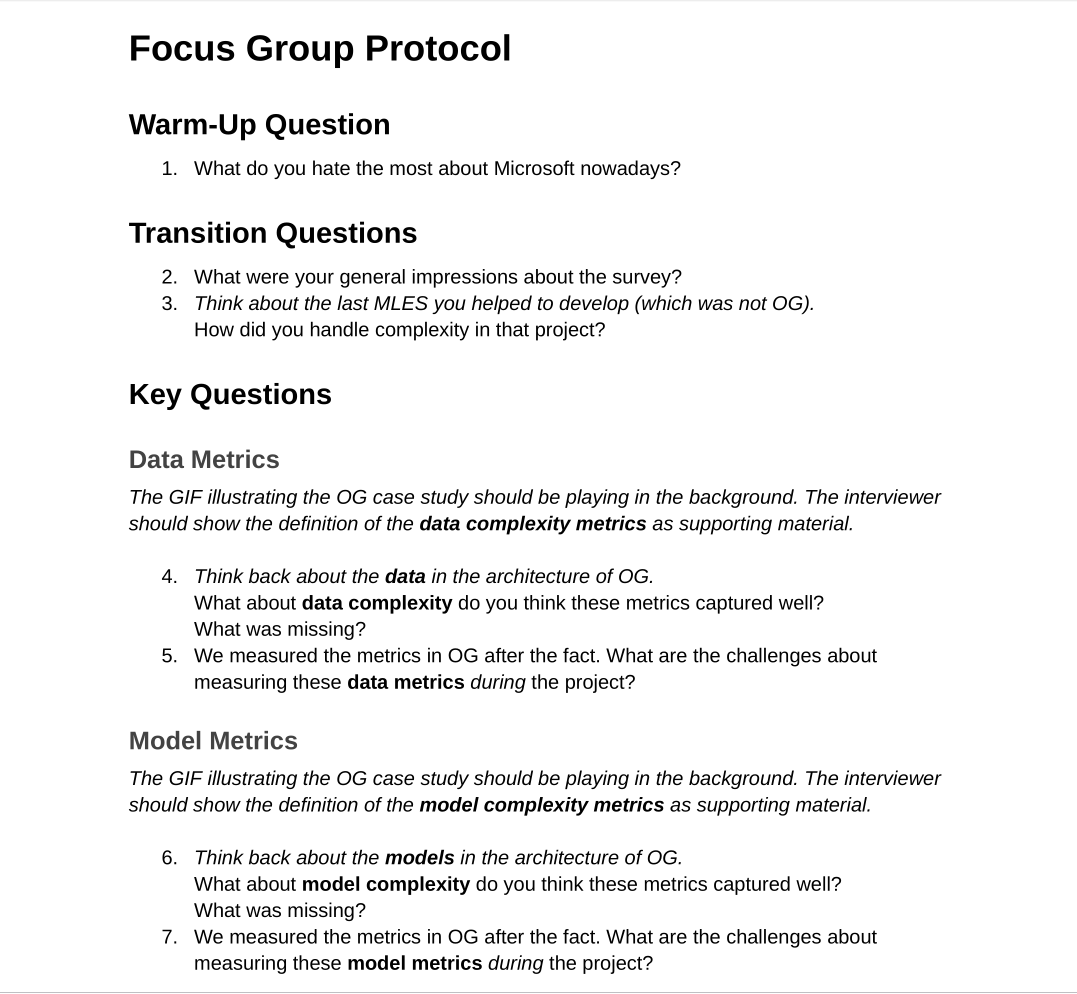
Focus Group
Protocol
Cool-Down Questions
Relax the participants after conversation
1
End Questions
Guide the participants away
from the main topic
2
Key Questions
Main questions, where most of the time is allocated
6
Transition Questions
Guide the participants toward
the main topic
2
Warm-Up Questions
Engage the participants in conversation
1
July 16th 2026
4 participants
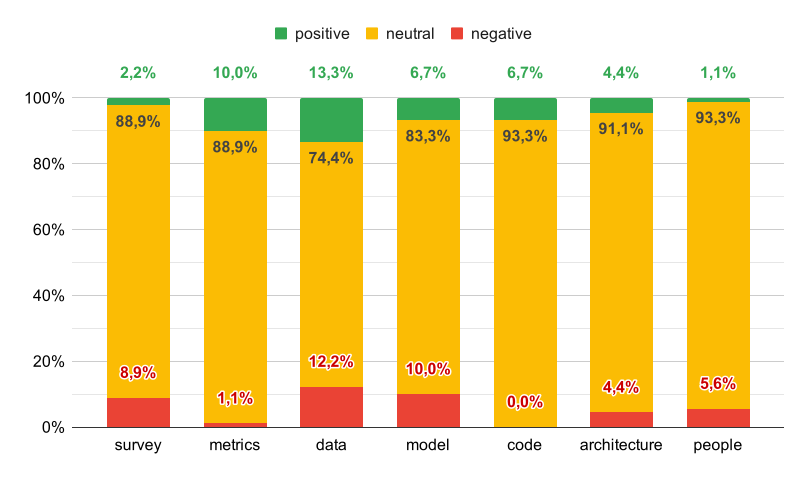
Sentiment Analysis
per subject of conversation
Metrics
received positive comments in general, even if the sentiment varied more for each category
Subjects
were defined using open coding
Sentiment Analysis
Metrics
But I would, I would definitely like think about the three dimensions at least, and like the code, the data, and the and the model, and then you know, okay, so how much model do we have? How much data do we have? How much code do we have? Are they like growing exponentially, like without control, or like are we actually aware of what’s going on?
But before you actually introduced me to this concept, I wouldn’t even think about it. But I think that’s mostly due to my inexperience, probably.
Ocean Guard was one of the very first projects, or was one of the projects where...
or was one of the first projects where everything was very well documented,
which makes sense because you [the author of the thesis] had this in the back of your mind and you were thinking about this.
In other projects, model complexity with these metrics or in combination with these metrics were not in the back of my mind. So I wasn’t thinking or I wasn’t writing these things down in a way they probably should have been.
To what extent do the developers of MLES understand the metrics?
RQ3.2
Explaining the thing about the data and the code and the models that like, of course, were things that I knew, but I never really thought about like, okay, so these can actually be, you know, a good way of like measuring things. I don’t know if I would exactly still like use the metrics themselves.
But I would, I would definitely like think about the three dimensions at least, and like the code, the data, and the and the model, and then you know, okay, so how much model do we have? How much data do we have? How much code do we have? Are they like growing exponentially, like without control, or like are we actually aware of what’s going on?
good level of
understanding
Discussion
Data
Volume
Value
Velocity
Variety
Veracity
Model
Retraining
Dimension
Flexibility
Change
Servers
Code
Processes
Control Density
Storages
Service Ratio
Data Density
Which metrics can characterize the complexity of MLES?
RQ1
How can complexity metrics be operationalized over an MLES?
RQ2
The metrics are relatively easy to understand and appear straightforward to calculate
when the architecture and its data flows are properly documented.
As I also said in the survey, like I think it really most depends on like the documentation, how well you are aware of what’s going on in the system. So that makes things, I think, easier to measure. But yeah, that’s my point.
What is the applicability of the complexity metrics by developers of MLES?
RQ3
Their usefulness could be further strengthened by providing interpretation guidelines, reference ranges, or examples showing what increases or decreases in each metric may imply in practice.
applicable
easy to use
effective useful
As I also said in the survey, like I think it really most depends on like the documentation, how well you are aware of what’s going on in the system. So that makes things, I think, easier to measure. But yeah, that’s my point.
Contributions
Dimensions of Complexity
of MLES
S1
MLOps
Reference
Architecture
S2
MLOps
Complexity
Metrics
S3
Patterns / Practices Reusability
MLES
T1
Case Study
OCEAN GUARD
MLES
T2
Publications
Discussed in the presentation
Out of scope
4
primary
used in the thesis
6
secondary
related to SE4AI
7
tertiary
other activities
3
planned
based on the thesis
Our goal was to
characterize the complexity of
ML-Enabled Systems
allowing devs to choose which kind of complexity to add to their systems:
code / data / model
Future Work
Refine
current metrics
based on feedback from
survey + focus group
Create
new metrics
for new dimensions
of complexity of MLES
(infra, teams)
Create
new metrics
for current dimensions
of complexity of MLES
(data, model, code)
Benchmark
the metrics
with other production systems to
further assess their operationalization
Validate
the metrics
with more industry professionals to
further assess their definition
Characterizing the Complexity of
ML-Enabled Systems
https://renatocf.xyz/phd-defense-live
2026
Renato Cordeiro Ferreira
Institute of Mathematics and Statistics (IME)
University of São Paulo (USP) – Brazil
Jheronimus Academy of Data Science (JADS)
Technical University of Eindhoven (TUe) / Tilburg University (TiU) – The Netherlands
MLOps Complexity Metrics
Thesis
Slides
Committee
is on
Evaluation