@sarah_edo : twitter || @sdras : codepen
Sarah Drasner

var svg = document.createElementNS("http://www.w3.org/2000/svg", "svg"),
  svgNS = svg.namespaceURI,
  vbx = document.createElementNS(svgNS, "viewBox"),
  width = Math.round(window.innerWidth),
  height = Math.round(window.innerHeight),
  ...

document.body.appendChild(svg);
document.body.style.background = '#222';
svg.setAttribute("viewBox", "0 0 " + width + " " + height);
svg.style.cursor = "pointer";
Build the SVG
for (var i = 0; i < allT; i++) {
  var circ = document.createElementNS(svgNS, "circle");
  svg.appendChild(circ);
  circ.setAttribute("r", radius);
  circ.setAttribute("fill", "rgb(225, " + i + ", 0)");
  circ.setAttribute("cx", (i % allW) * st);

  if (i % allW === 0) {
    startY += st;
  }
  circ.setAttribute("cy", (startY));
  ...
}
Plot the circles
circ.addEventListener("mouseover", function(e) {
  this.style.transform = "scale(2)";
  this.style.opacity = 1;
});

circ.addEventListener("mouseleave", function(e) {
  var nowCirc = this;
  this.style.transition = "0.6s all ease-in";
  setTimeout(function() {
    nowCirc.style.transform = "scale(1)";
    nowCirc.style.opacity = 0.5;
  }, 600);
});
Event Listeners
Particles
function createParticle(i) {
  // initial position in middle of canvas
  var x = width*0.5;
  var y = height*0.5;
  // randomize the vx and vy a little -
  // but we still want them flying 'up' and 'out'
  var vx = -2+Math.random()*4;
  var vy = Math.random()*-3;
  ...
  var p = new Particle(x, y, vx, vy, size, color, opacity);
  particles.push(p);
}
Create Particles
function Particle(x, y, vx, vy, size, color, opacity) {

  function reset() {
    x = width*0.5;
    y = height*0.5;
    opacity = 0.5 + Math.random()*0.5;
    vx = -2+Math.random()*4;
    vy = Math.random()*-3;
  }

  this.update = function() {
    ...

    // add gravity to vy
    vy += gravity;
    x += vx;
    y += vy;
  }
  ...
}
Bubble.prototype = {
init: function (x, y, vx, vy) {
this.x = x;
this.y = y;
this.vx = vx;
this.vy = vy;
},
update: function (dt) {
// friction opposes the direction of velocity
var acceleration = -Math.sign(this.vx) * friction;
// distance = velocity * time + 0.5 * acceleration * (time ^ 2)
this.x += this.vx * dt + 0.5 * acceleration * (dt ^ 2);
this.y += this.vy * dt + 0.5 * gravity * (dt ^ 2);
// velocity = velocity + acceleration * time
this.vy += gravity * dt;
this.vx += acceleration * dt;
this.circ.setAttribute("cx", this.x);
this.circ.setAttribute("cy", this.y);
this.circ.setAttribute("stroke", "rgba(1,146,190,"
+ this.opacity + ")");
}
};function repeatOften() {
// Do whatever
requestAnimationFrame(repeatOften);
}
requestAnimationFrame(repeatOften);requestAnimationFrame
(function animate(currentTime) {
  var dt;
  requestAnimationFrame(animate);
  if (!prevTime) {
    // only save previous time
    prevTime = currentTime;
    return;
  } else {
    // calculate the time difference between frames
    // it has to be less than 25ms because of switching between tabs
    dt = Math.min(currentTime - prevTime, 25);
    prevTime = currentTime;
  }
  for (var i = 0; i < lots.length; i++) {
    lots[i].update(dt);
    ...
  }
}());
rAF in Practice
ES6 Template Literals
Previously: String Concatenation
var stringie = "Hi, I ordered " + num1 + " " +
product1 + "s and " + num2 + " " + product2 + "s.";
Hi, I ordered 5 apples and 2 oranges.
const stringie = `Hi, I ordered ${num1}
${product1}s and ${num2} ${product2}s.`;
SVG Paths
Paths

<path d="M7.3 75L25.9 6.8s58.4-6.4 33.5 13-41.1 32.8-11.2
 30.8h15.9v5.5s42.6 18.8 0 20.6" />
<path d="M133.1 58.2s12.7-69.2 24.4-47.5c0 0 4.1 8.6 9.5.9
 0 0 5-10 10.4.9 0 0 12.2 32.6 13.6 43 0 0 39.8 5.4 15.8
 15.4-13.2 5.5-53.8 13.1-77.4 5.9.1 0-51.9-15.4 3.7-18.6z" />
Path Data

Paths: Curve Commands


M two points x,y
Q two points for the bezier handle x,y,
two points x,y
function plotter(points, startX) {
  var pathArr = [],
      pathpoints = [];
  for (i = 0; i <= inc; i++) {
    pathpoints.push(points + ((i * (points*2)) + points));
    pathArr.push(` ${startX} ${pathpoints[i]}`);
  }
  return pathArr;
}

rope1.setAttribute("d", `M ${plotter(50, start1)}`.join(" L") );
Plot the points
M xcoord ycoord L xcoord ycoord
function newWobble(rate, startX) {
  var in1 = startX + rate,
      pathArr2 = plotter(rate, startX);

  for (i = 0; i <= inc; i++) {
    var QRate = rate + (i + 1) * (rate * 2);
    if (i % 2 === 0) {
      pathArr2[i] = `${pathArr2[i]} Q ${Math.round(in1)} ${QRate}`;
    } else {
      pathArr2[i] = `${pathArr2[i]} Q ${Math.round(in2)} ${QRate}`;
    }
  }
  return `M ${pathArr2.join("")} ${startX} ${(inc * (rate*2) + rate)}`;
}
Make the wobble
Q xcoord ycoord xcoord ycoord
Distortion Filters
<filter id="turb">
  <feTurbulence id="turbwave" type="fractalNoise" baseFrequency="0"
    numOctaves="2" result="turbulence_3" data-filterId="3" />
  <feDisplacementMap xChannelSelector="R" yChannelSelector="G"
    in="SourceGraphic" in2="turbulence_3" scale="40" />
</filter>
function addFilter() {
var all = document.getElementById("all");
all.setAttribute("filter", "url(#turb)");
};
(function addFilterTimed() {
window.setTimeout(addFilter, 5000);
}());Set the filter on a timer

let turb = document.querySelectorAll('#filter-ripple-2 feImage')[0],
    feD = document.querySelectorAll('#filter-ripple-2 feDisplacementMap')[0];

function sceneOne() {
  var tl = new TimelineMax();

  tl.add('begin');
  ...
  tl.fromTo(feD, 8, {
    attr: {
      scale: 30
    }
  }, {
    attr: {
      scale: 0,
      transformOrigin: '50% 50%'
    }
  }, 'begin+=0.4');
}
Animate the filter
Oscillator
//***** helper functions *****//

//function to set multiple attributes at once
function setAttributes(el, attrs) {
  for (let key in attrs) {
    el.setAttribute(key, attrs[key]);
  }
}

//function to append children because typing
function append(el, addition) {
  el.appendChild(addition);
}
Helpers!
//***** Create the Ball *****//
function Ball (radius, color) {
  this.circ = document.createElementNS(svgNS, "circle");
  this.radius = radius;
  this.color = color;
  this.x = 0;
  this.y = 0;
}

Ball.prototype.draw = function() {
  append(svg, this.circ);
  setAttributes(this.circ, {
    "r": this.radius,
    "cx": this.x,
    "cy": this.y,
    "fill": this.color
  });
};
Create the ball
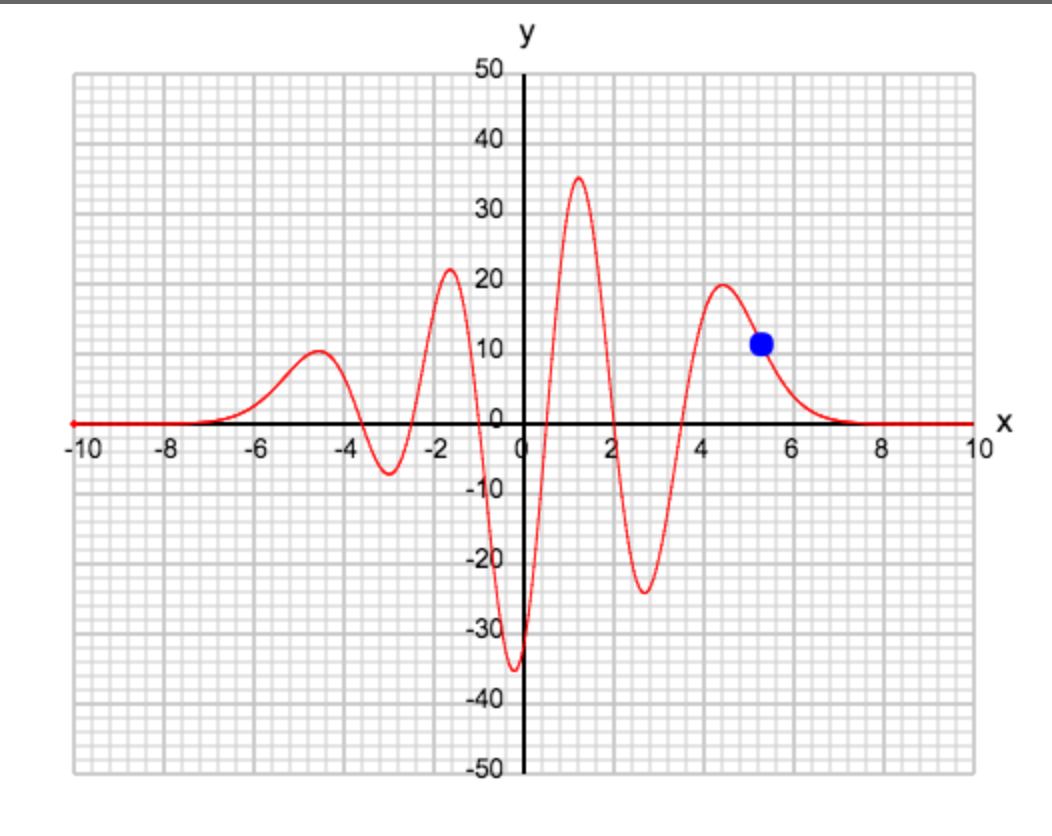
function plotter(){
  xscal = (xmax-xmin)/(width/4);
  yscal = (ymax-ymin)/(height/4);
  for (var i = 0; i <= 1200; i++){
    xA[i] = (i - 550) * 0.02;
    yA[i] = f(xA[i]);
  }
}

function f(x) {
  let y;
  y = (x+3.6)*(x+2.5)*(x+1)*(x-0.5)*(x-2)*(x-3.5)*Math.exp(-x*x/4);
  return y;
}
Set the motion
Reuse the same motion
M two points x,y
Q two points for the bezier handle x,y,
two points x,y
//***** Create the Bk *****//
function Background(color) {
  this.panel = document.createElementNS(svgNS, "path");
  this.color = color;
  this.y = 0;
  this.y2 = 0;
  this.inc = 150;
  this.start = 175;
}

Background.prototype.draw = function() {
  append(g, this.panel);
  setAttributes(this.panel, {
    "d": `M ${this.start} 100 Q ${this.start+50} ${this.y2} ${this.start+75} 100 Q
          ${width/2} ${this.y} ${width-(this.inc+75)} 100 Q ${width-this.inc}
          ${this.y2} ${width-this.inc} 100 L ${width} 0 L 0 0 Z`,
    "fill": this.color,
  });
};
//***** Create the Ball *****//
function Ball (radius, color) {
	this.circ = document.createElementNS(svgNS, "circle");
  this.radius = radius;
  this.color = color;
  this.y = 0;
}

Ball.prototype.draw = function() {
  append(g, this.circ);
  setAttributes(this.circ, {
  	"r": this.radius,
    "cx": width/2,
    "cy": this.y,
    "fill": this.color,
  });
};
Styling an SVG Icon
<svg class="icon" width="24" height="14" alt="Menu">
  <use xlink:href="/svg/sprites.svg#icon-hamburger"></use>
</svg>

<!-- the svg -->
<?xml version="1.0" encoding="UTF-8"?><!DOCTYPE svg PUBLIC "-//W3C//DTD SVG 1.1//EN" "http://www.w3.org/Graphics/SVG/1.1/DTD/svg11.dtd">
<svg xmlns="http://www.w3.org/2000/svg" xmlns:xlink="http://www.w3.org/1999/xlink">
  <symbol id="icon-hamburger" viewBox="0 0 24 14">
    <g fill="#FFF" fill-rule="evenodd">
     <!-- I guess this is the part I need to style..
          But I have tried everything..
          literally, I tried styling * {fill: red} -->
      <path d="M0 0h24v2H0zM0 6h24v2H0zM6 12h18v2H6z"/>
    </g>
  </symbol>
</svg>
The original question code
Creating Shapes that Bind to Data
Without d3
Polyline
<polyline points="14,17 136,37 77,117 230,87 132,158 172,158 "/>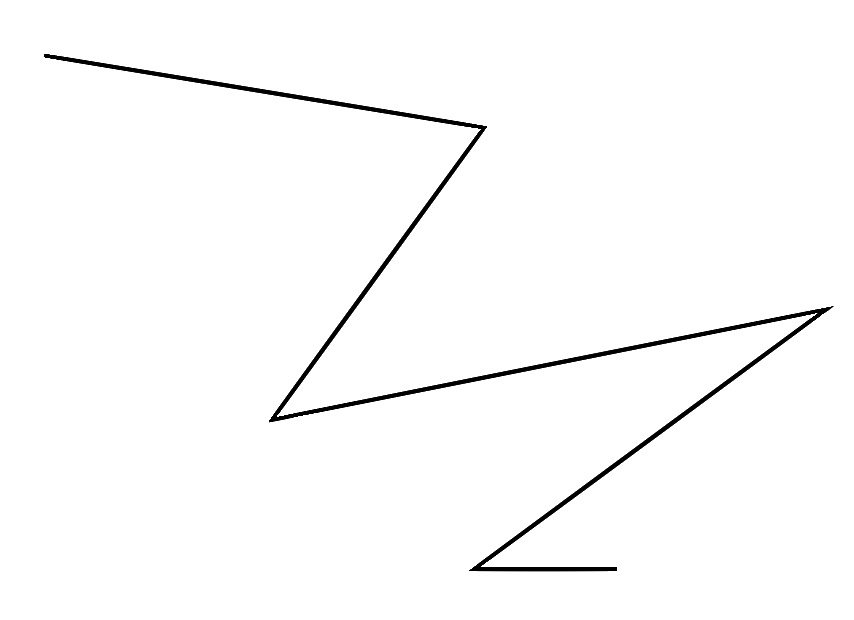
  //create the polyline for the data
  const data = JSON.parse(chartdata),
        dataline = document.createElementNS(svgNS, "polyline"),
        st2 = startL*2,
        datalineP = endLW / data.books.length,
        polylineA = [];

  for (let i = 0; i < data.books.length; i++) {
    let xaxis = (datalineP * i) + st2,
        yaxis = endLH - data.books[i].reviews;
    polylineA.push([xaxis, yaxis]);
Create the Polyline
  //gradients
  const defs = document.createElementNS(svgNS, "defs"),
        lg = document.createElementNS(svgNS, "linearGradient"),
        stop1 = document.createElementNS(svgNS, "stop"),
        stop2 = document.createElementNS(svgNS, "stop");

  append(svg, defs);
  append(defs, lg);
  append(lg, stop1);
  append(lg, stop2);

  lg.setAttribute("id", "linear-gradient");
  setAttributes(stop1, {
    "offset": "0%",
    "stop-color": "#FFF33B"
  });
  setAttributes(stop2, {
    "offset": "100%",
    "stop-color": "#E93E3A"
  });
Create the Gradient
Without d3
  const svg = document.createElementNS("http://www.w3.org/2000/svg", "svg"),
        svgNS = svg.namespaceURI,
        vbx = document.createElementNS(svgNS, "viewBox"),
        bars = [];

  append(document.body, svg);
  setAttributes(svg, {
    "viewBox": "0 0 " + svgwidth + " " + svgheight,
    "width": svgwidth,
    "id": "svg",
    "height": svgheight
  });
Create the SVG
With d3
var w = 300,
    h = 300;

//create svg
var svg = d3.select("body")
            .append("svg")
            .attr("width", w)
            .attr("height", h);
Create the SVG
Axis
  //make axis
  const line1 = document.createElementNS(svgNS, "line"),
        line2 = document.createElementNS(svgNS, "line"),
        startL = 10,
        endLH = svgheight - (startL * 2),
        endLW = svgwidth - (startL * 2);
  append(svg, line1);
  append(svg, line2);

  setAttributes(line1, {
    "x1": startL,
    "y1": startL,
    "x2": startL,
    "y2": endLH,
    "class": "line1"
  });

  setAttributes(line2, {
    "x1": endLW,
    "y1": endLH,
    "x2": startL,
    "y2": endLH,
    "class": "line2"
  });

  //xaxis ticks
  const xticks = endLW / 10;
  for (let i = 0; i < xticks; i++) {
    let lx = document.createElementNS(svgNS, "line");
    append(svg, lx);
    setAttributes(lx, {
      "x1": (startL*i) + startL,
      "y1": endLH,
      "x2": (startL*i) + startL,
      "y2": endLH + (startL/2),
      "class": "xticks"
    });
  }

  //yaxis ticks
  const yticks = endLH / 10;
  for (let i = 0; i < yticks; i++) {
    let ly = document.createElementNS(svgNS, "line");
    append(svg, ly);
    setAttributes(ly, {
      "x1": startL/2,
      "y1": (startL*i) + startL,
      "x2": startL,
      "y2": (startL*i) + startL,
      "class": "yticks"
    });
  }
axisBottom(x)
// Add the x Axis
  svg.append("g")
      .attr("transform", "translate(0," + h + ")")
.call(d3.axisBottom(x));$elements: 2000;
@for $i from 0 to $elements {
.hexagons path:nth-child(#{$i}) {
$per: $i/50;
animation: 2s #{$per}s ease hexagons both;
}
}
@keyframes hexagons {
100% {
opacity: 1;
}
}
Viewbox as a Camera


get bbox();

This pen.
FLOW CHART
with Val Head
🎉
O'Reilly Book
SVG Animation


Thank you!
@sarah_edo on twitter
@sdras on codepen/github