Presentation of scientific work
Sebastian Hörl
13 October 2021
Université Gustave Eiffel
Course plan
-
29 September (CM)
Scientific process and reproducibility
-
13 October (CM, afternoon)
Presentation and visualisation
-
13 October (TD, morning)
Preparation of mini project
-
9 November (CM)
Presentation and visualisation
Course plan
-
29 September (CM)
Scientific process and reproducibility
-
13 October (CM, afternoon)
Presentation and visualisation
-
13 October (TD, morning)
Preparation of mini project
-
9 November (CM)
Presentation and visualisation
Work session
-
Some remarks
- Minimum: Provide instructions on how to replicate the analysis process step by step. Better: Provide an automated process (shell scripts, etc.) along the report.
- The final report should be a "report" as in a "readable / printable" document, ideally in PDF format or other common formats (Word / LibreOffice).
- Additional visualizations or interactive reports can be submitted, but they must be referenced in a meaningful way in the basic report (e.g. adding a static version of a dynamic visualization in the report, ...). They can lead to extra points if the extra visualization provides an added value (must be justified!).
- Minimum: Provide instructions on how to replicate the analysis process step by step. Better: Provide an automated process (shell scripts, etc.) along the report.
Work session
-
Some remarks
- Report in English
- 1-2 pages report
- Not necessary to put code/report on git
- Submit report document (PDF, ...) and additional files needed (R/Python scripts, ...) as zip or single files
- But: Focus is on methods, the report must describe how somebody can replicate the results based on the processing steps (mentioning the algorithms, the aggregation steps, etc.), and not only by "running script XYZ on the data ABC"
- Submission of report: 23 November at latest
Scientific process
Question / Hypothesis
Data
Processing
Analysis
Exploration
Results
Scientific process
Question / Hypothesis
Data
Processing
Analysis
Exploration
Documentation / Presentation
- Internship report
- Master thesis
- Scientific paper
Results
Steps
Intention
Content
Structure
Style
Refine
Talk
Presentation
Example
Steps
Intention
Content
Structure
Style
Refine
Talk
Before you start
-
Your intention
- What point do you want to get across?
- What information do you want to transmit?
- What should remain with the listeners?
Before you start
-
Your intention
- What point do you want to get across?
- What information do you want to transmit?
- What should remain with the listeners?
-
Audience
- Who is listening?
- What do they know already?
- What don't they know?
- What do they want to know?
- Readable after the talk?
Structuring the content
-
First thoughts ...
- How to start?
- Why should somebody listen?
- Give a preview? Spoiler?
- How to set the context?
Structuring the content
-
First thoughts ...
- How to start?
- Why should somebody listen?
- Give a preview? Spoiler?
- How to set the context?
-
... in between ...
- Logical build up of arguments and information
- Which bits are necessary one after another?
- Which examples, images, plots, to bring?
- How to bring in a logical order?
-
... last thoughts
- How to end?
- Worth making a summary / conclusion?
- How to transmit last message?
Structuring the presentation
-
A question of taste / length ...
- Table of contents
- Summary at the end
- Progress / chapter slides
Structuring the presentation
-
A question of taste / length ...
- Table of contents
- Summary at the end
- Progress / chapter slides
-
Text vs graphics
- Avoid too much text
- Focus on graphics and oral presentation
- (Exception: if presentation should be readable without the talk)
Structuring the presentation
-
A question of taste / length ...
- Table of contents
- Summary at the end
- Progress / chapter slides
-
Text vs graphics
- Avoid too much text
- Focus on graphics and oral presentation
- (Exception: if presentation should be readable without the talk)
-
Timing
- Rule of thumb
1 slide = at least 1-2 minutes - Leave time to explain what you show (figures, axes, units)
- Rule of thumb
-
Procedural build-up
- From left to right
- From top to bottom
- Valuable tool to make audience follow a chain of thought
Structuring the presentation
Dense
Sparse
- Plan time for audience to understand
- Ideally, build up step by step
- Allows to put thoughts in context and to see complex information on one page
- Audience may get overwhelmed
- Quick to grasp
- Less time needed to introduce the slide
- Allows to bring across one specific points, but context may be lost
Style of the presentation
-
Making design decisions
- Goal is to transfer information, showcase developments, explain things, ...
- Does my design decision help achieving my goal? Why? Why not?
-
Color
- Use to highlight things (avoid for default text)
- Take into account color blindness!
- Does my design decision help achieving my goal? Why? Why not?
- Stay consistent (choose a palette if necessary)
Style of the presentation
-
Making design decisions
- Goal is to transfer information, showcase developments, explain things, ...
- Does my design decision help achieving my goal? Why? Why not?
-
Graphics
- Add a legend
- Use axis labels
- Use grids
Style of the presentation
-
Making design decisions
- Goal is to transfer information, showcase developments, explain things, ...
- Does my design decision help achieving my goal? Why? Why not?
-
Size
- Ideally: What screen will you use? Test it on that screen!
- From how far should people see the slides (both too large/small are problematic)
- Don't waste space by using large headings
- Stay consistent (stick to 1-2 font sizes)
Practical remarks on plotting (reports vs. presentations)
-
Graphics
- Labels
- Legends
- Grids
-
Colors
- Using palettes
- Markers, line styles, ...
Practical remarks on plotting (reports vs. presentations)
-
Dimensions
- Wherever possible, try to be explicit:
- Know the dimensions of your report (A4, ...)
- Define width and size explicitly when plotting
- Wherever possible, use vector graphics
- Primitives are saved geometrically, vs.
- raster graphics, which are saved as pixel information
- When rastering, keep in mind DPI / resolution
- Wherever possible, try to be explicit:
Practical remarks on plotting (reports vs. presentations)
-
Dimensions
- Try to synchronize with your text font size
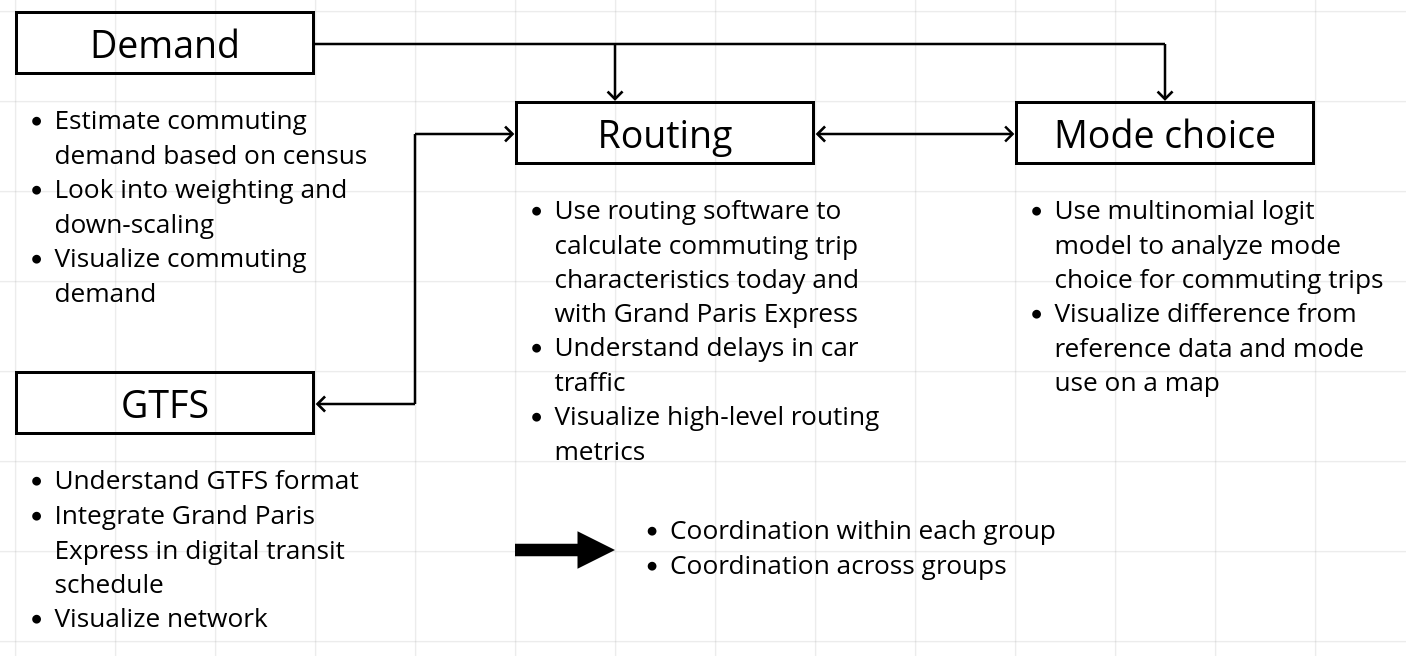
Outlook
-
Second semester
- Group project on the Grand Paris Express
- You will work in groups of 3-4 students performing one part of a larger planning project
- You will need to work between groups to exchange results
Contact
-
Sebastian Hörl
sebastian.horl@irt-systemx.fr