Dalitz plot analysis of the \(D^{+}\rightarrow K^{-}K^{+}K^{+}\) decay
Sebastián Ordoñez-Soto
Universidad Nacional de Colombia
Supervisors: Alberto C. dos Reis and Diego Milanés
November 4th, 2022


IJCLab LHCb group meeting
Contents
- Introduction
- Data sample
- Data analysys
- Preliminary results
- Outlook
Introduction
Motivation
- Decays of \(D\) mesons into three pseudoscalars are excellent laboratories to study light-meson spectroscopy.
- In a \(D\rightarrow K^{-}K^{+}K^{+}\) decay, the \(K\bar{K}\) scattering amplitudes can be determined.
- Need phenomenological models.
Problem
- No tools for a description from first principles.
- The challenge:
- Dynamics: Heavy-quark weak transitions, hadron formation and final-state interactions (FSI)
- Strong part: effects of coupled channels, three-body interactions and isospin.
Data sample
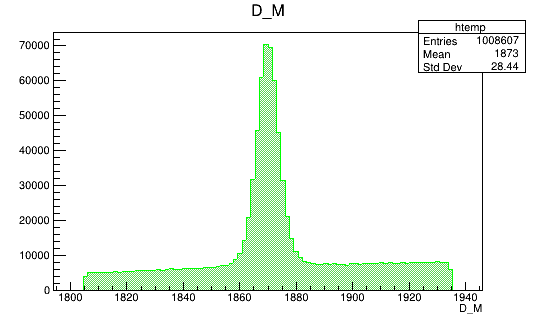
Original sample
2016-Down
- Data from the Run 2 of the LHCb is used in this analysis. The corresponding Monte Carlo samples are also available.
(GeV)
(GeV)
(GeV)
(MeV)
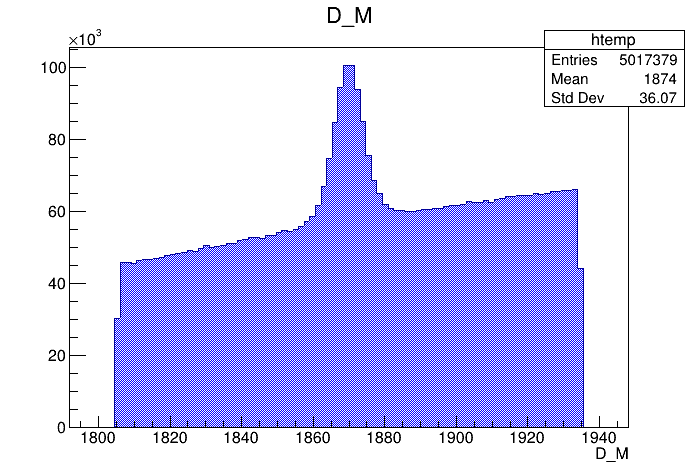
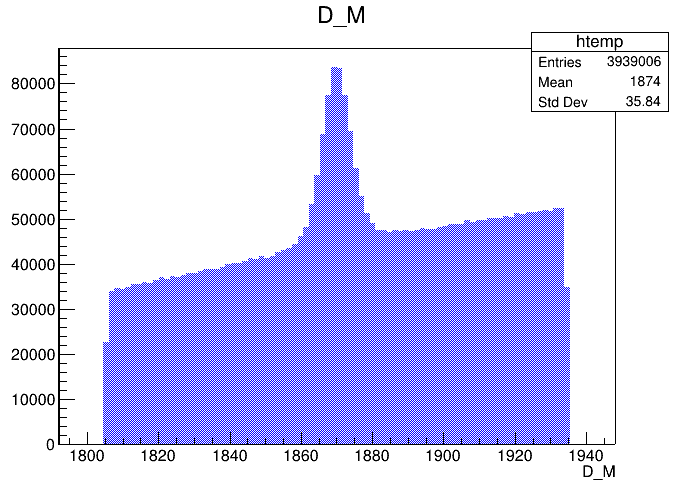
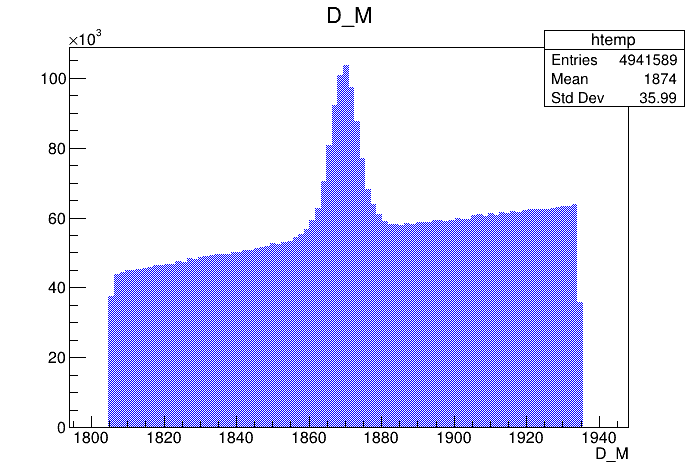
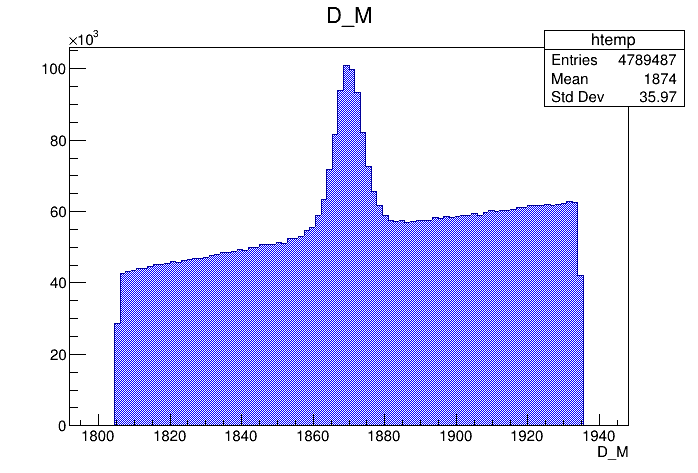
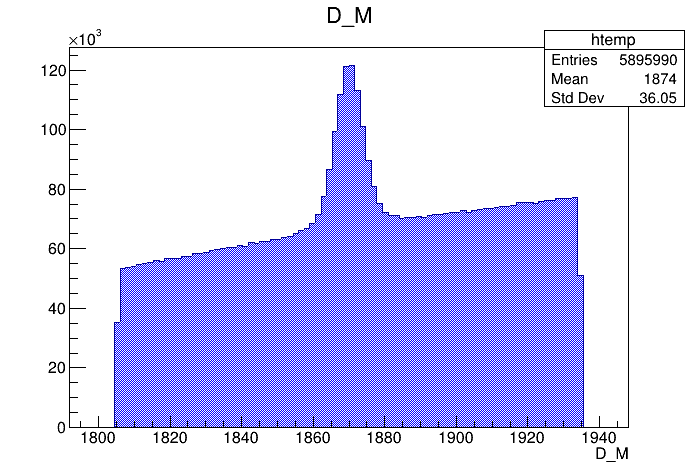
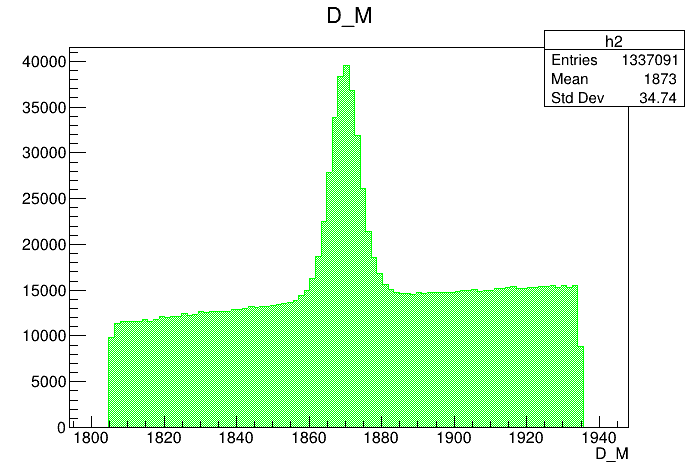
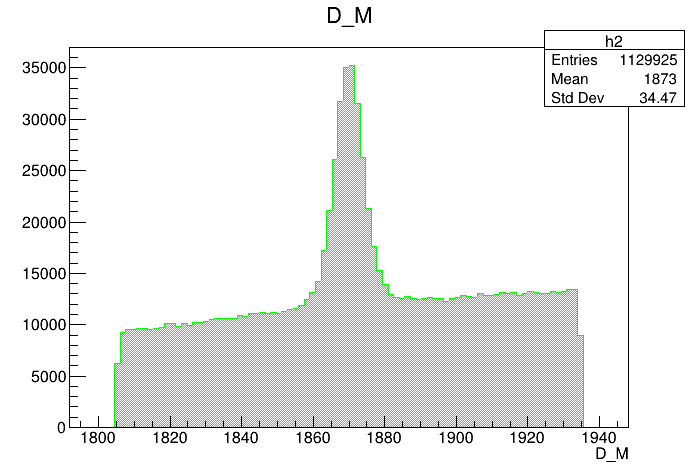
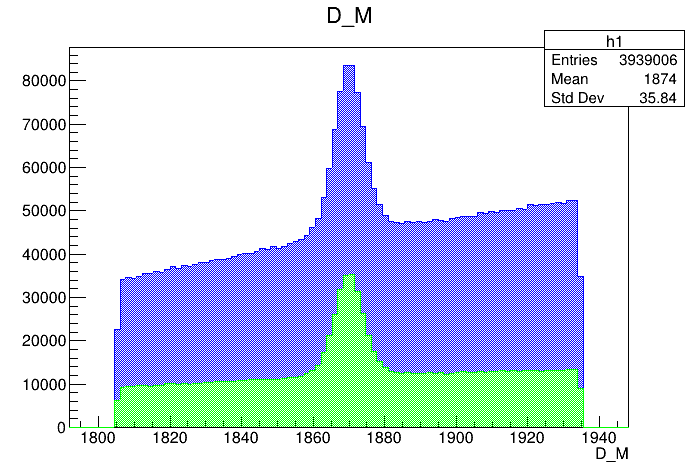
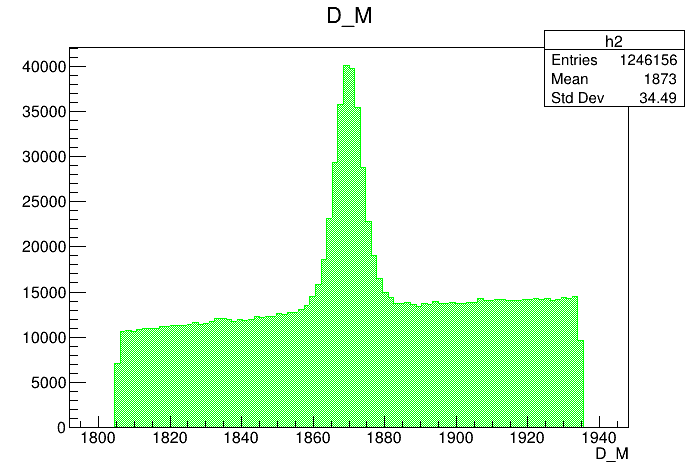
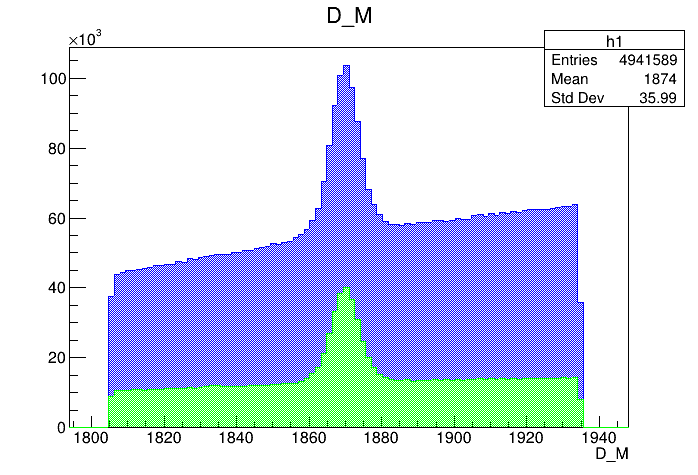
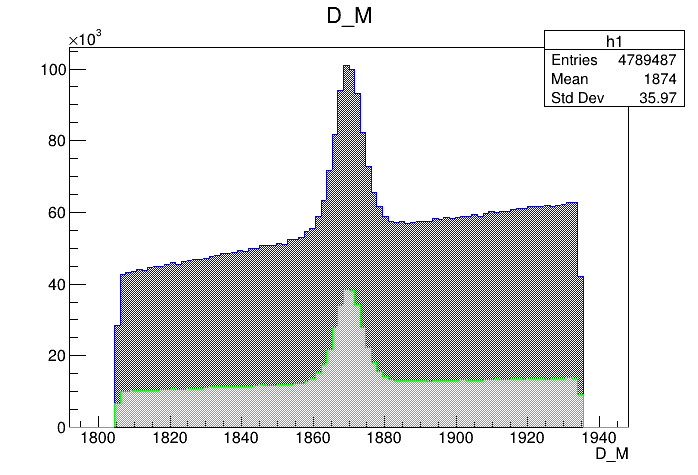
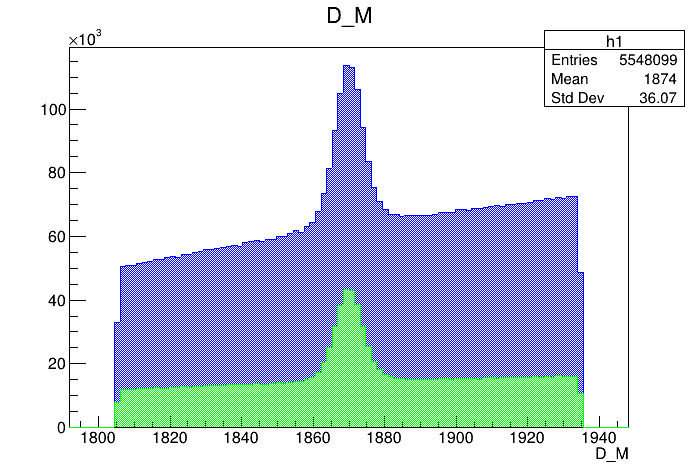
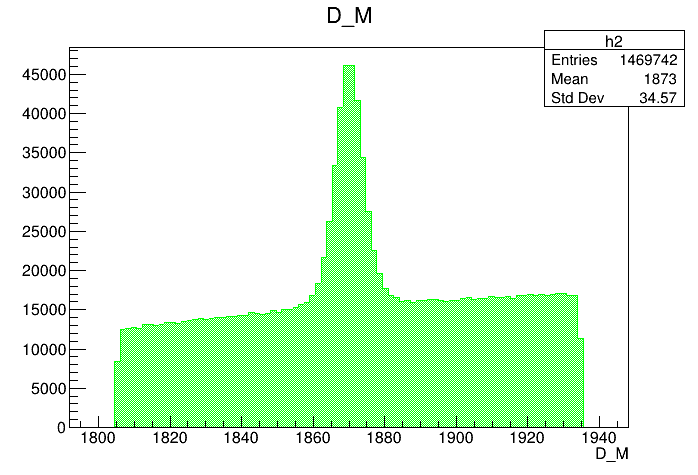
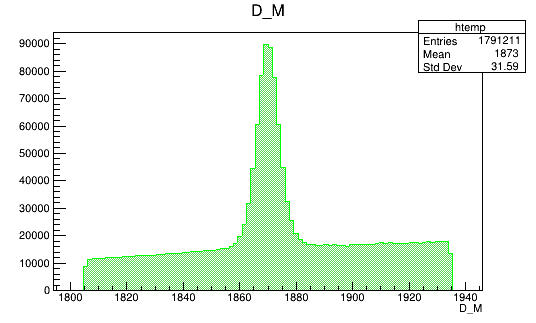
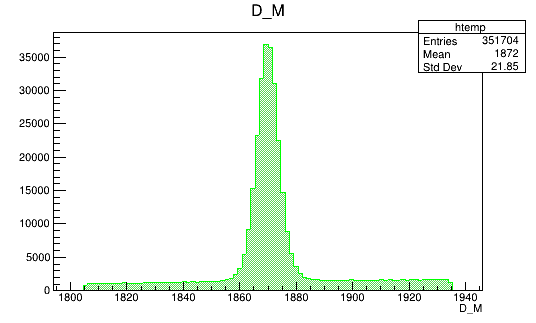
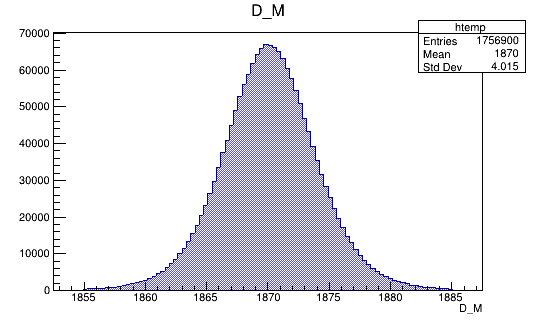
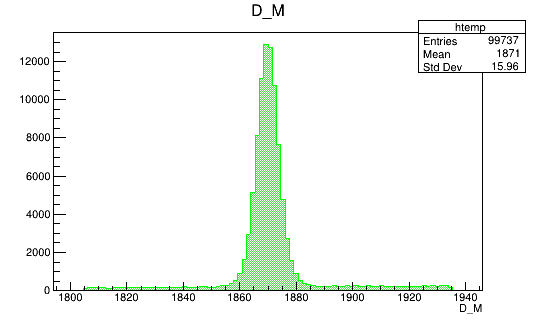
Invariant mass distribution of the \(D\) candidates
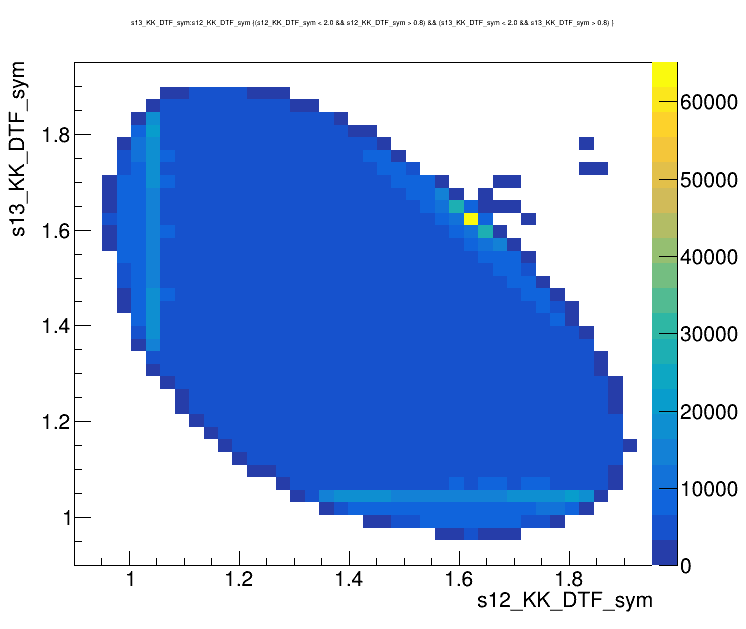
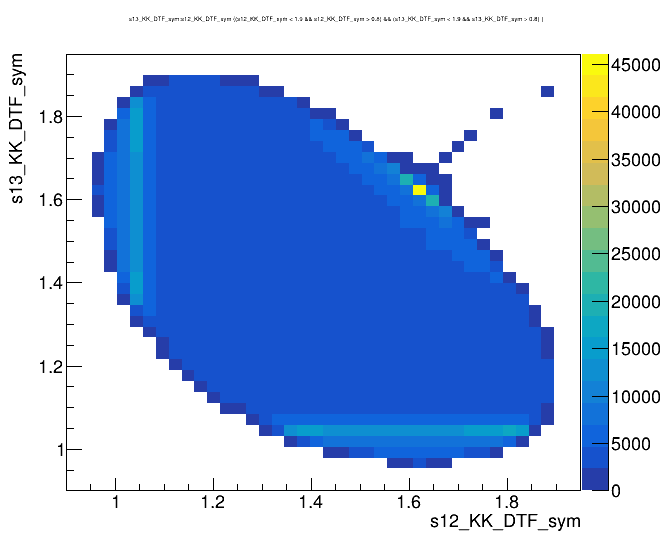
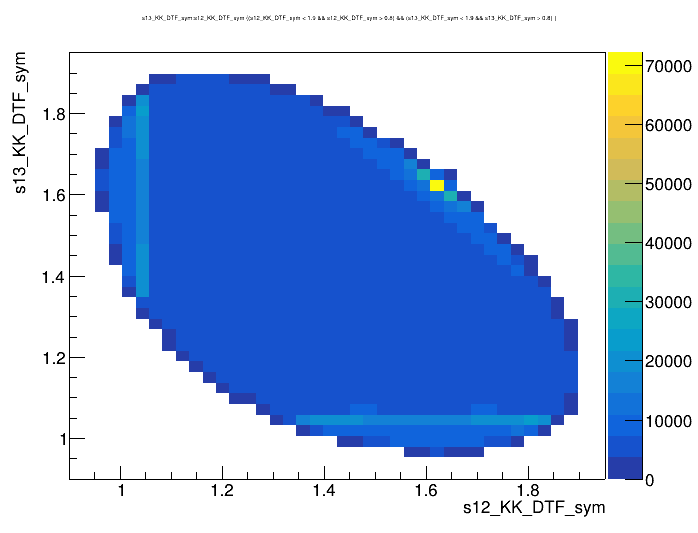
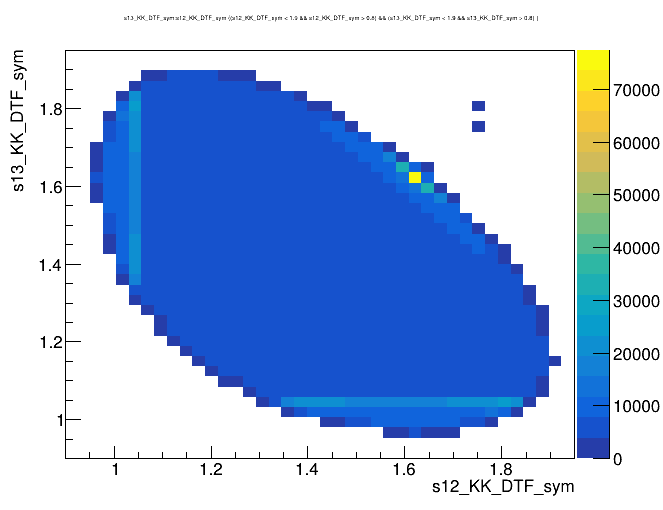
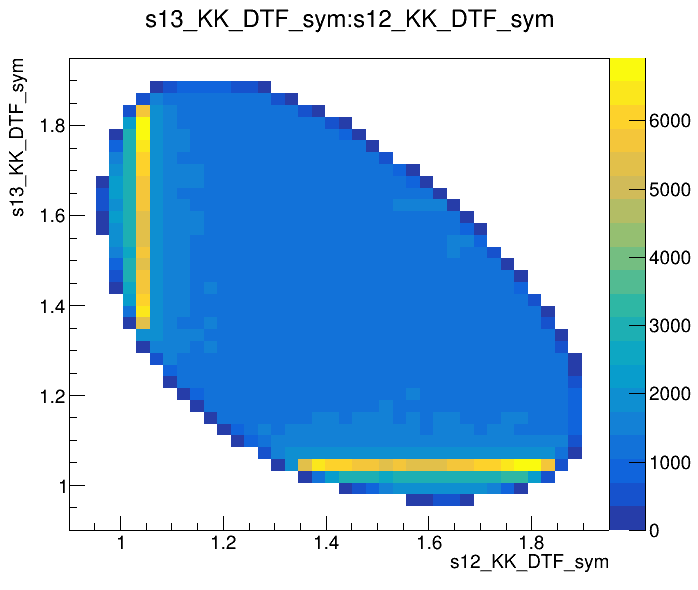
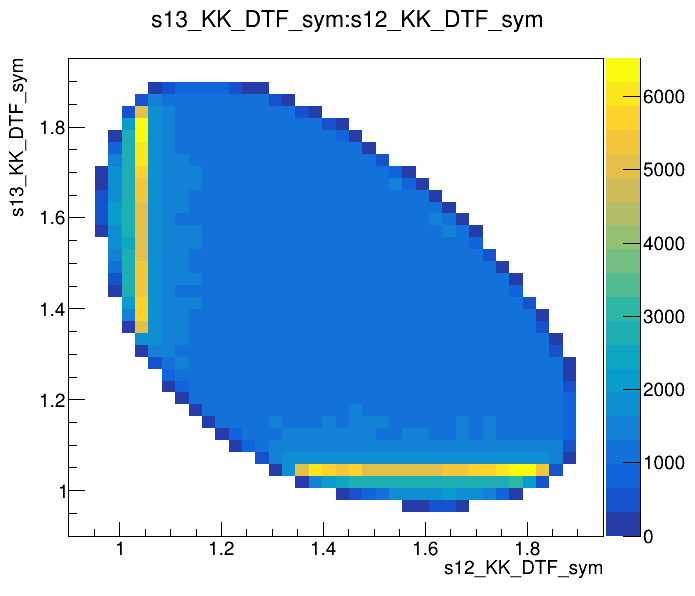
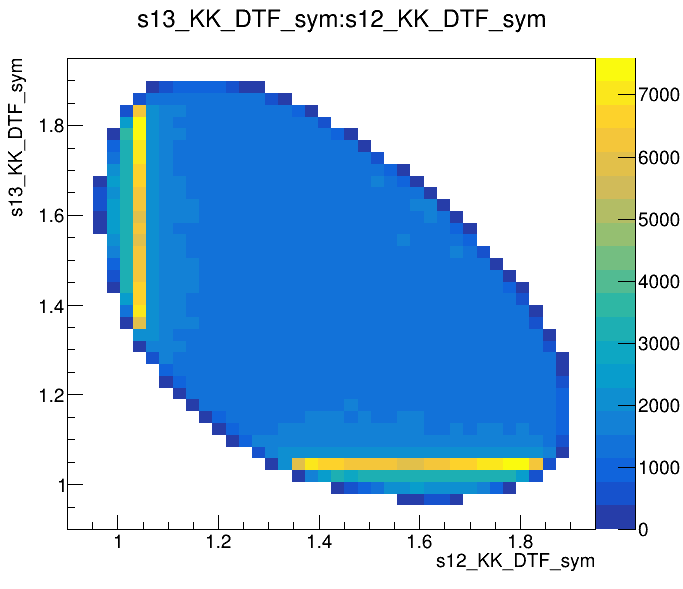
Dalitz plot of the \(D\) candidates
Original sample

2016-Down
(GeV)
(GeV)
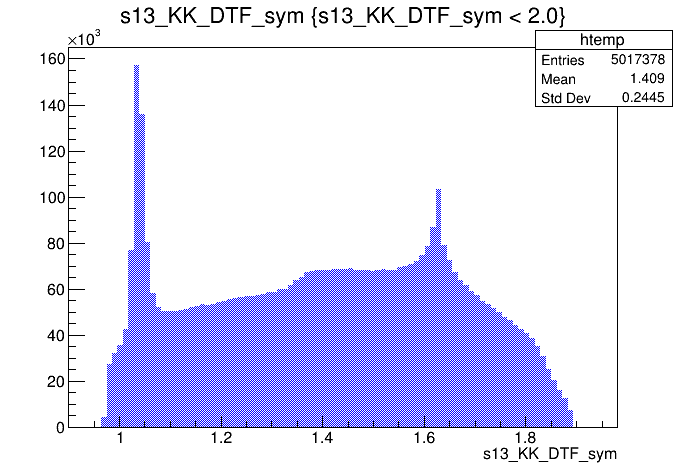
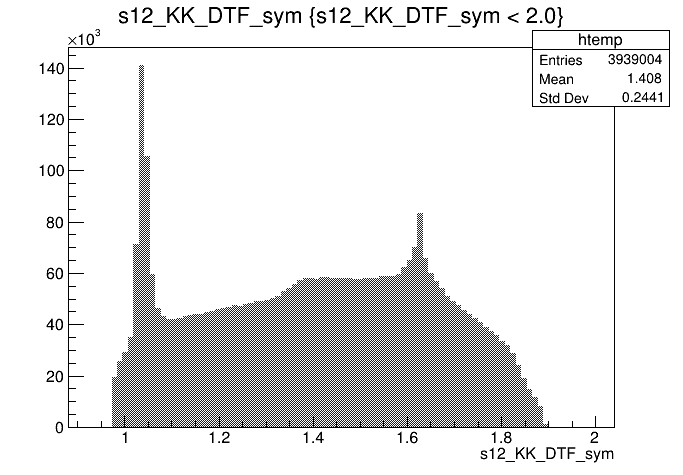
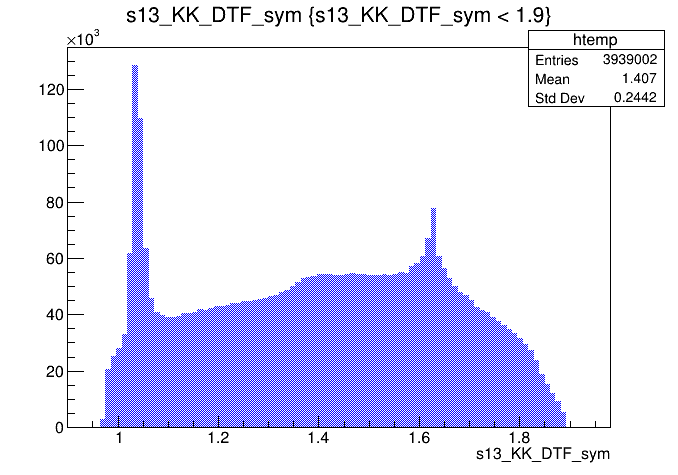
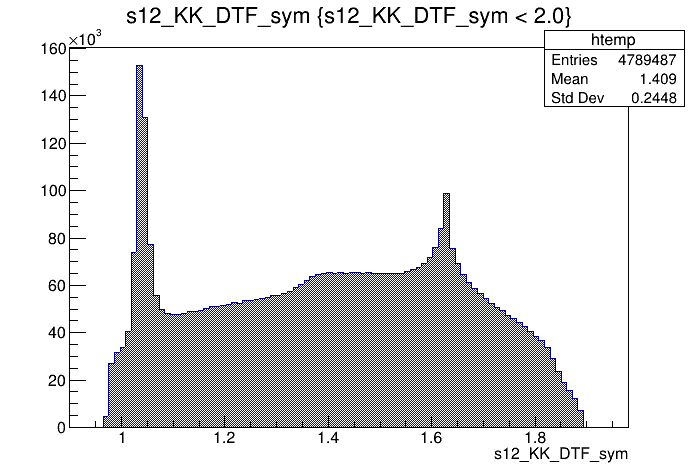
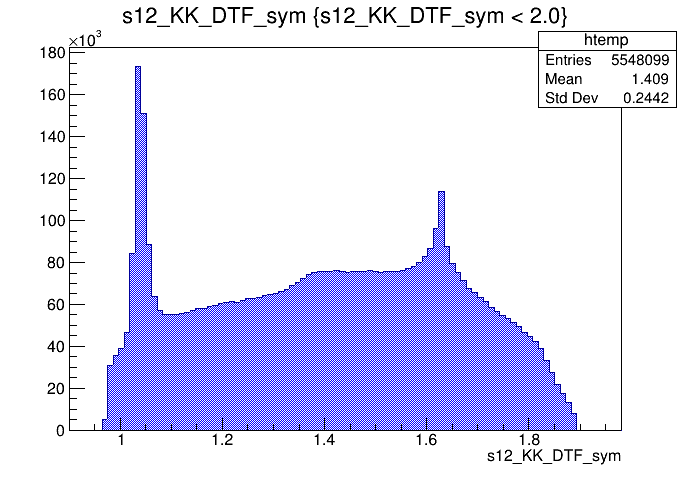
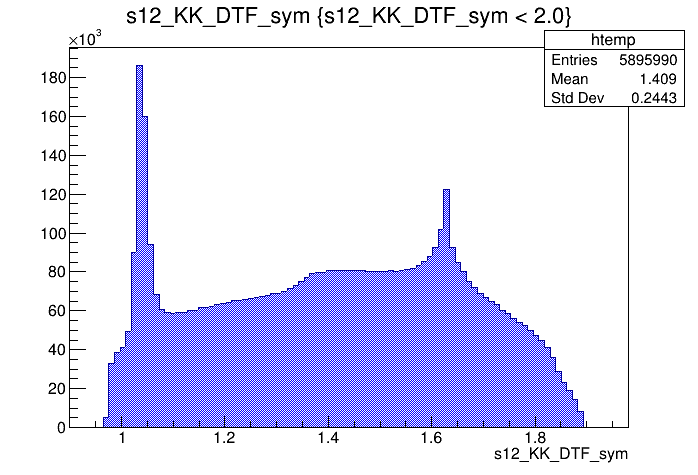
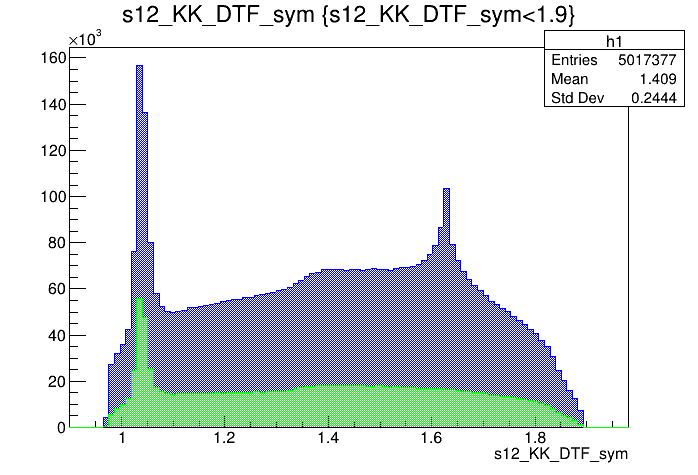
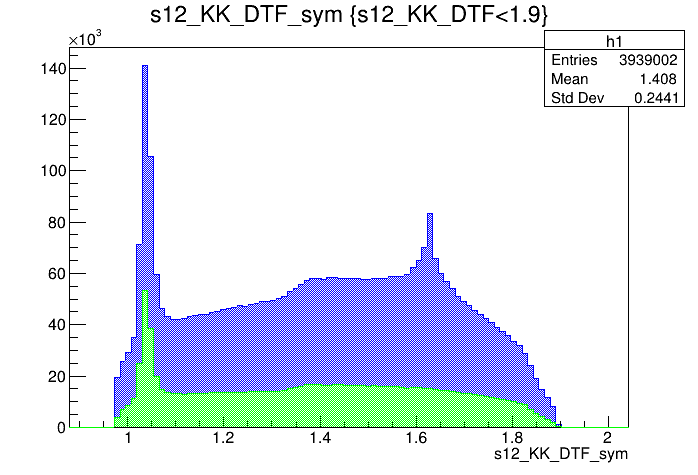
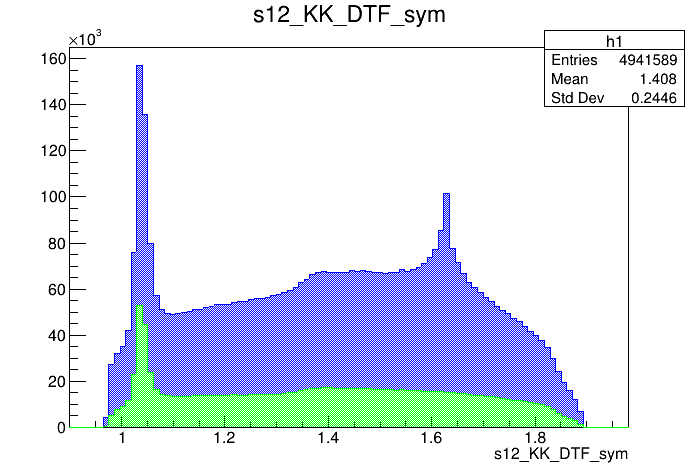
\(s_{K^{-}K^{+}}\) projection of the Dalitz
\(s_{K^{-}K^{+}}\) projection of the Dalitz
Data sample
Original sample
2016-Up
(GeV)
(MeV)
Dalitz plot of the \(D\) candidates
Data sample
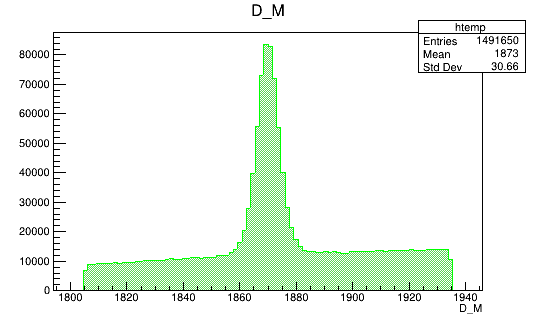
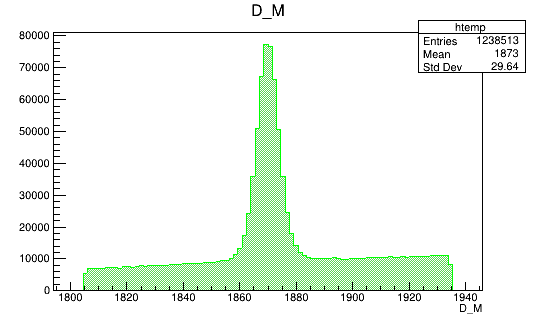
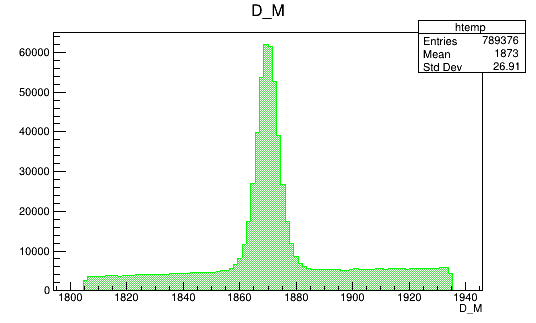
Invariant mass distribution of the \(D\) candidates
Original sample
2016-Up
(GeV)
(GeV)
Data sample
Original sample
2017-Down

(GeV)
(MeV)
Dalitz plot of the \(D\) candidates
Data sample
Invariant mass distribution of the \(D\) candidates
Original sample
2017-Down


(GeV)
(GeV)
Data sample
Original sample
2017-Up

(GeV)
(MeV)
Dalitz plot of the \(D\) candidates
Data sample
Original sample
2017-Up

(GeV)
(GeV)
Data sample
Original sample
2018-Down

(GeV)
(MeV)
Dalitz plot of the \(D\) candidates
Data sample
Original sample
2018-Down

(GeV)
(GeV)
Data sample
Original sample
2018-Up
(GeV)
(MeV)
Dalitz plot of the \(D\) candidates
Data sample
Original sample
2018-Up

(GeV)
(GeV)
Data sample
Data analysis: Pre-selection
Pre-selected sample
2016-Down
- Preselection cuts include PID (pi_ProbNNk) and clone tracks (slope variables)
(GeV)
(GeV)
(MeV)
Dalitz plot of the \(D\) pre-selected candidates
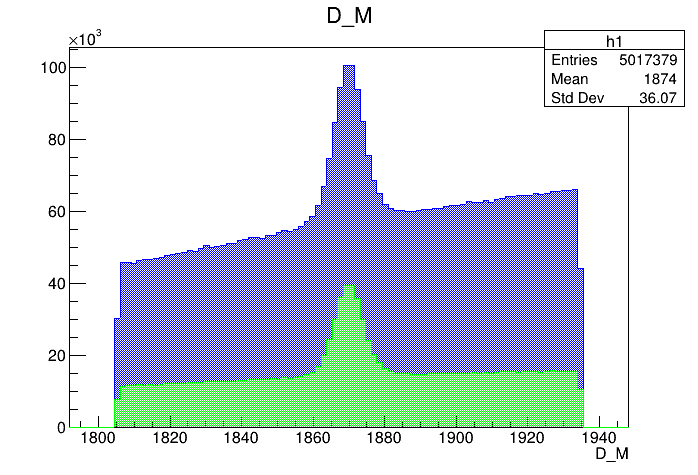
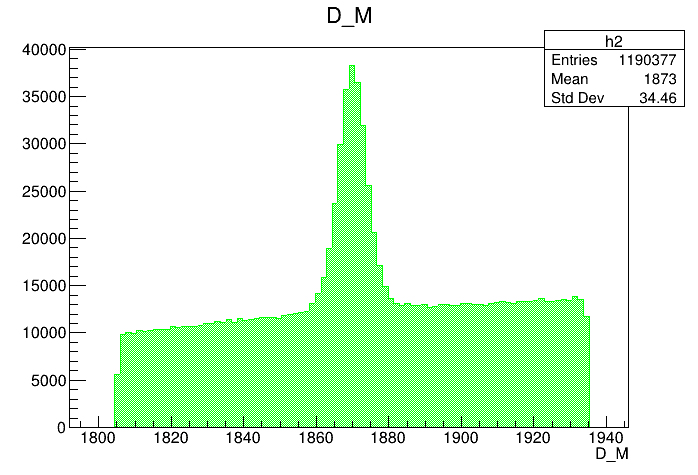
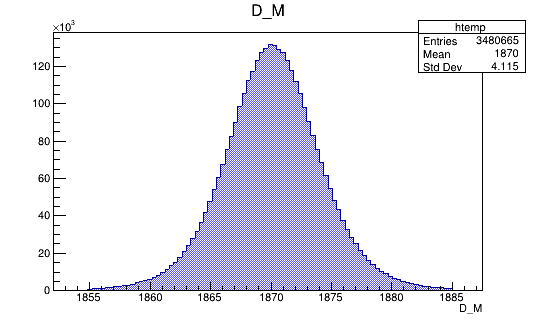
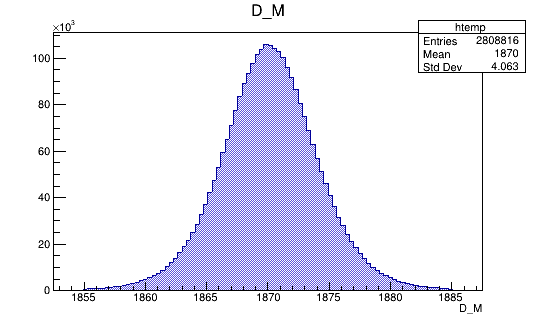
Mass distribution of the \(D\) pre-selected candidates
Preselected sample
2016-Down
(GeV)
(MeV)
Mass distribution of the \(D\) pre-selected candidates
\(s_{K^{-}K^{+}}\) projection of the pre-selected sample
Data analysis: Pre-selection
Data analysis: Pre-selection
Preselected sample
2016-Up
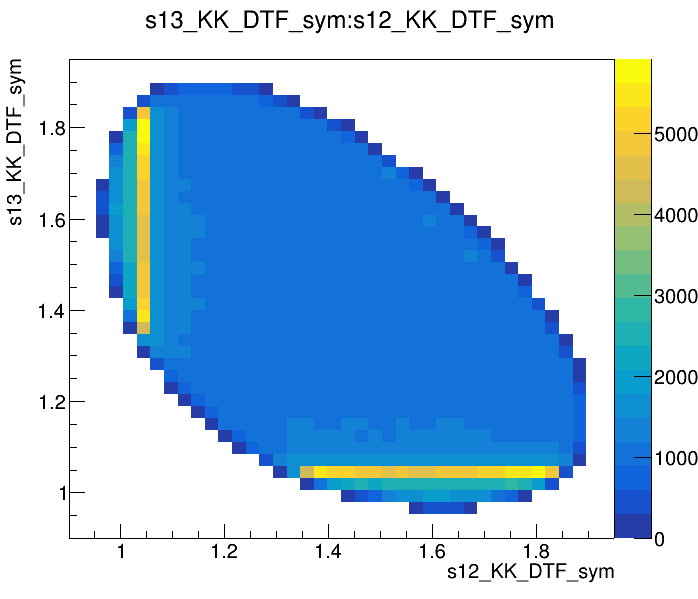
Dalitz plot of the \(D\) pre-selected candidates
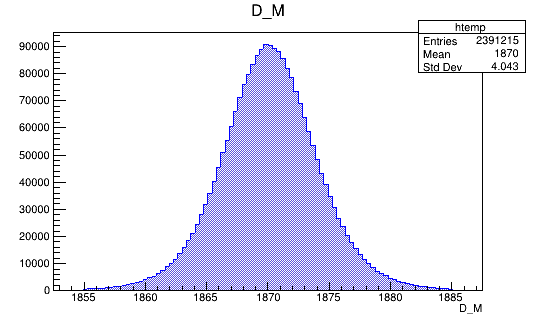
Mass distribution of the \(D\) pre-selected candidates
Data analysis: Pre-selection
Preselected sample
2016-Up
Mass distribution of the \(D\) pre-selected candidates
\(s_{K^{-}K^{+}}\) projection of the pre-selected sample
Data analysis: Pre-selection
Preselected sample
2017-Down
Data analysis: Pre-selection
Preselected sample
2017-Down
Data analysis: Pre-selection
Preselected sample
2017-Up

Data analysis: Pre-selection
Preselected sample

2017-Up
Data analysis: Pre-selection
Preselected sample
2018-Down


Data analysis: Pre-selection
Preselected sample
2018-Down

Data analysis: Pre-selection
Preselected sample
2018-Up
Data analysis: Pre-selection
Preselected sample
2018-Up


Data analysis: MC-matching
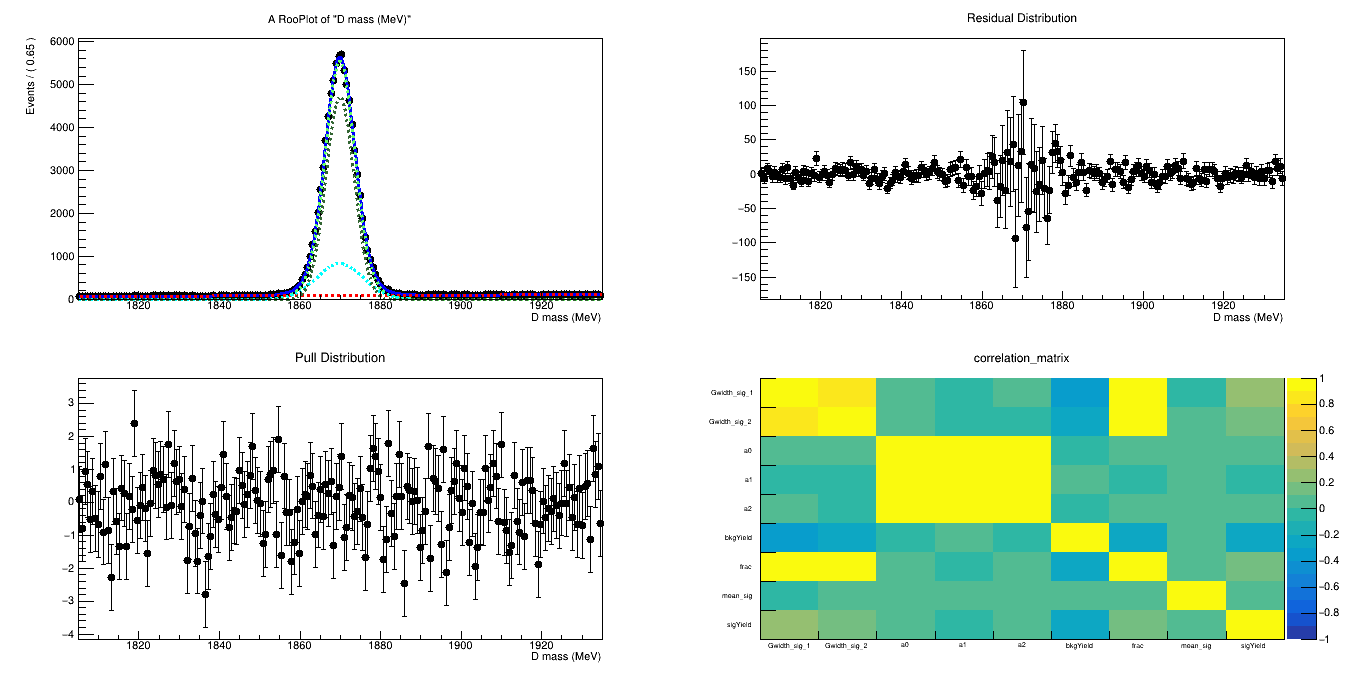
Fits of the preselected sample
2016-Down (Fold 1)
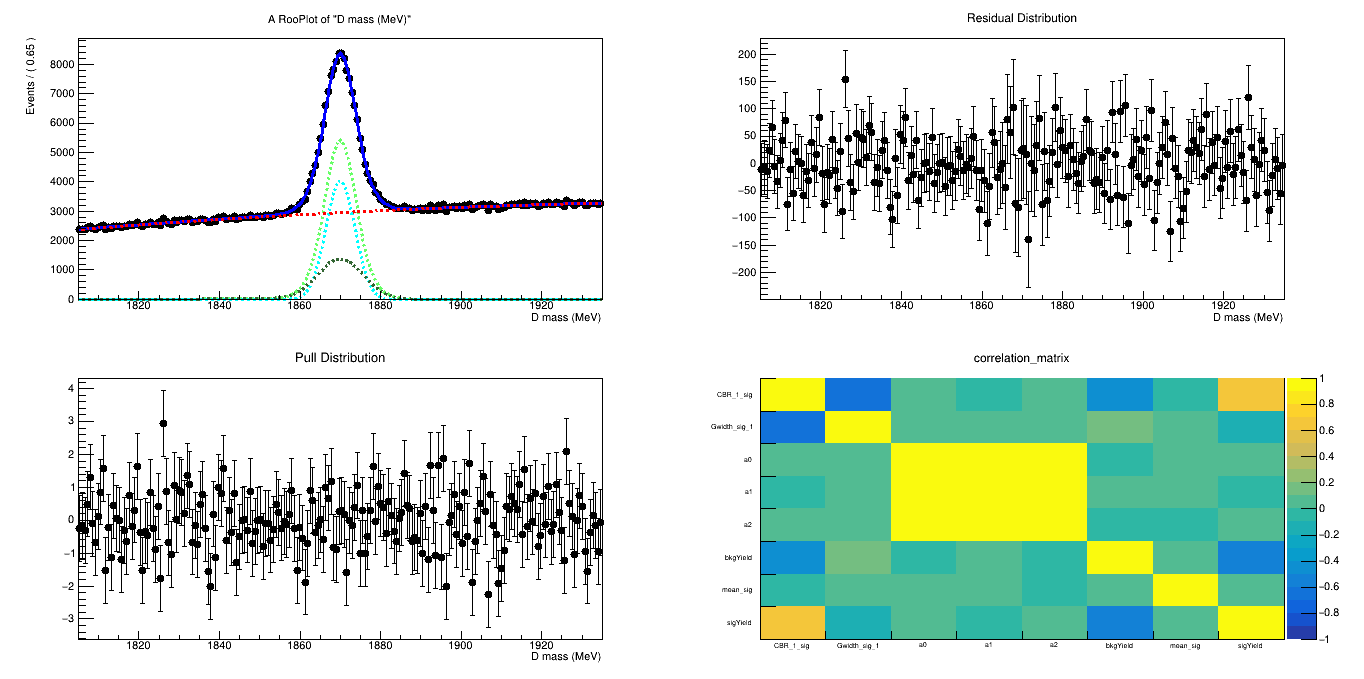
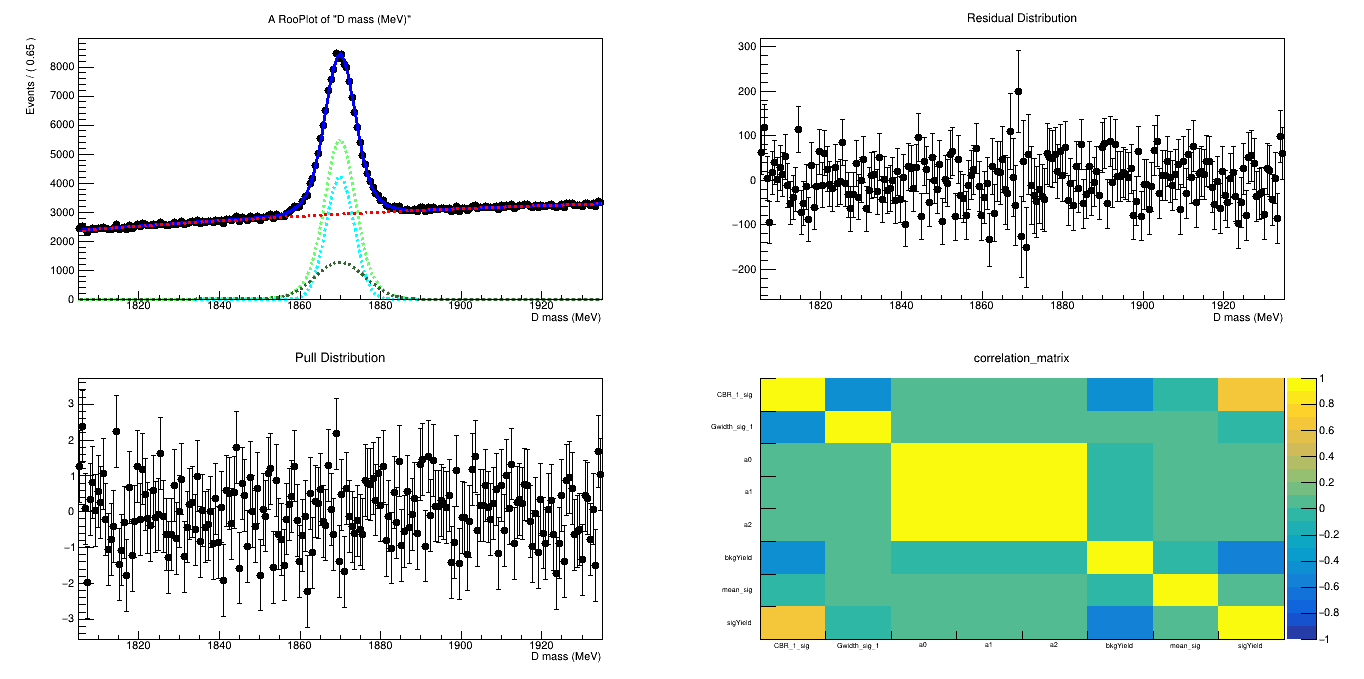
2016-Down (Fold 2)
MC matching: Splot weights
Data analysis: MC-matching
2016-Down (Fold 1)
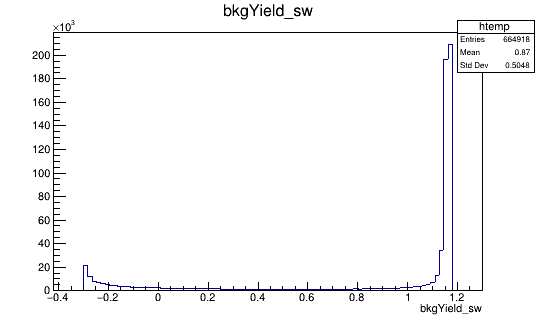
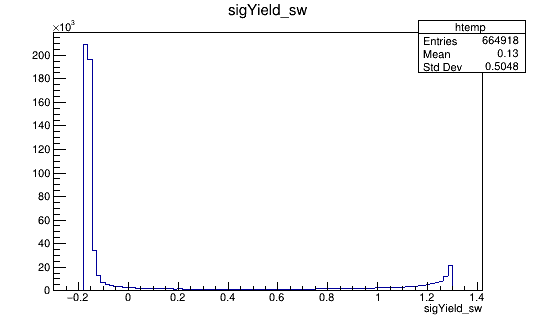
Signal weights
Background weights
MC matching: Splot weights
Data analysis: MC-matching
2016-Down: Fold 1
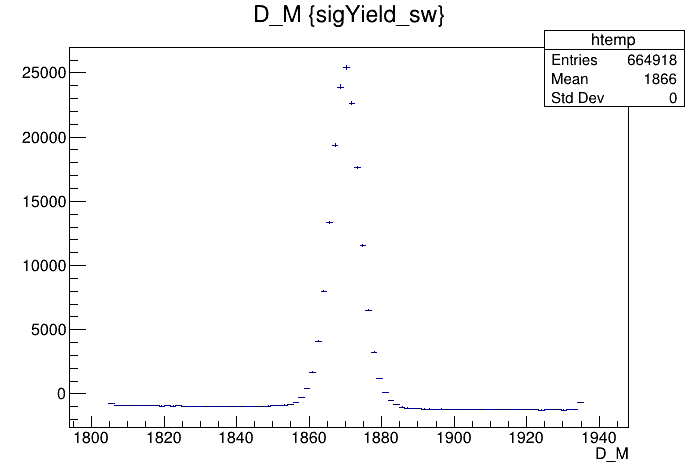
Invariant mass distribution weighted by sWeights
Gradient boosted weights
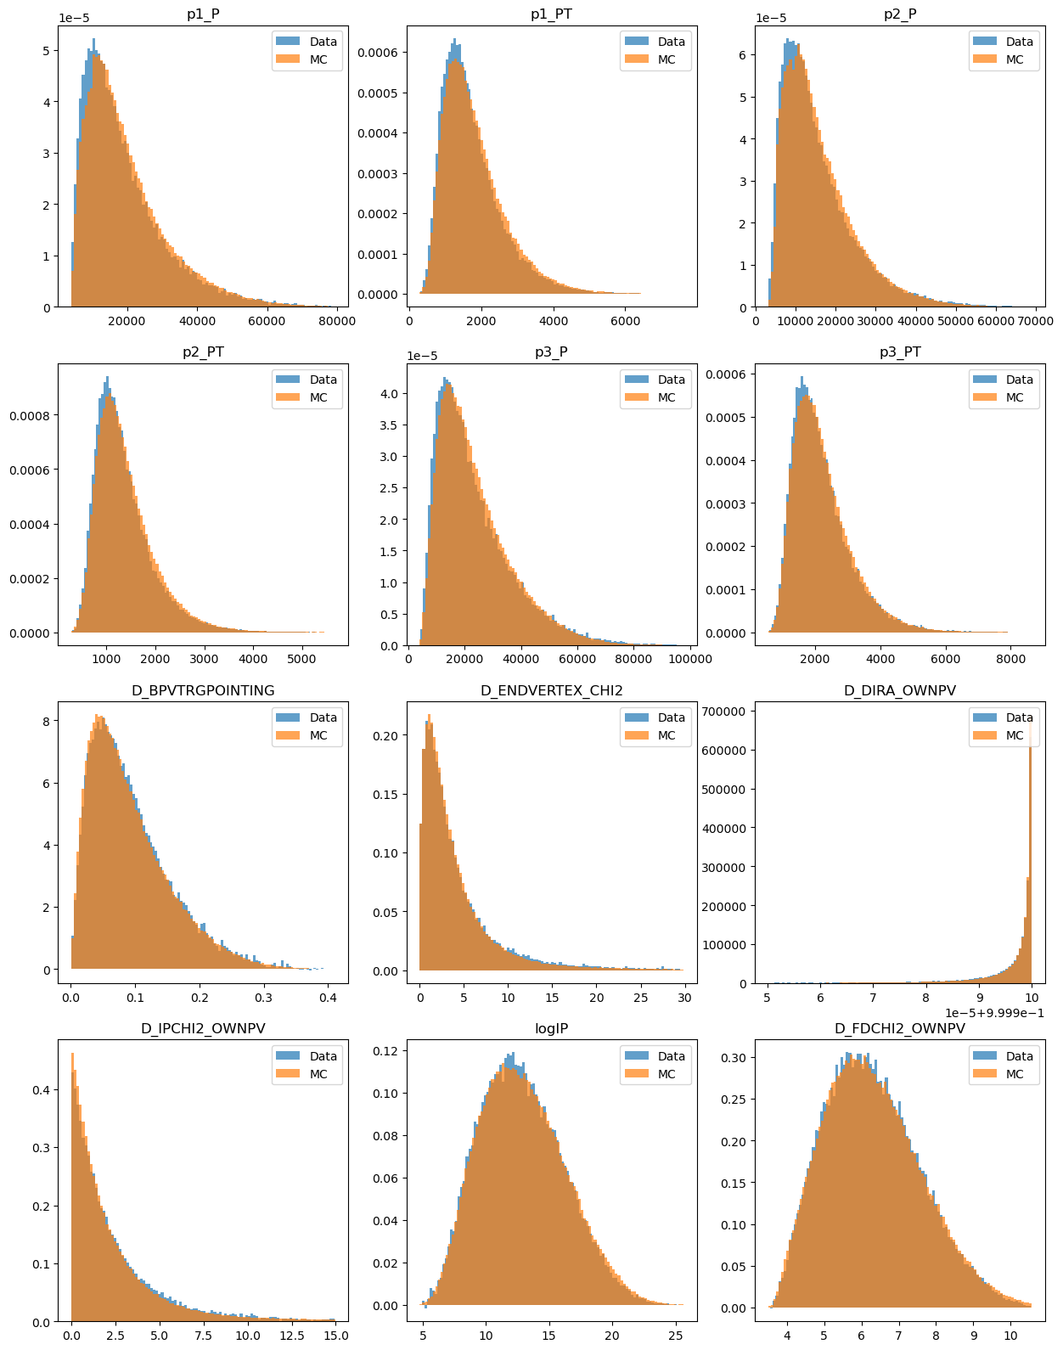
2016-Down (Fold 1)
- Monte Carlo and data distributions before the reweighting
Data analysis: MC-matching
Gradient boosted weights
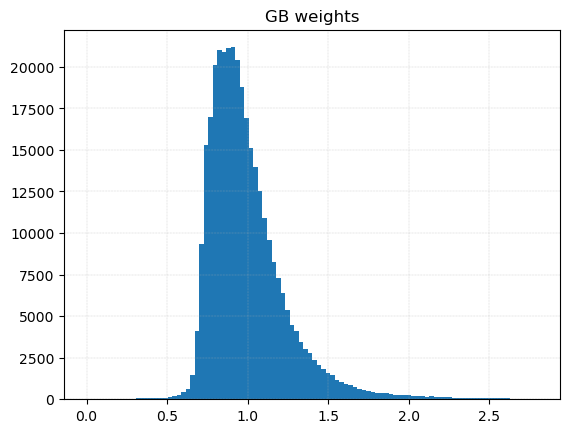
2016-Down (Fold 1)
Data analysis: MC-matching
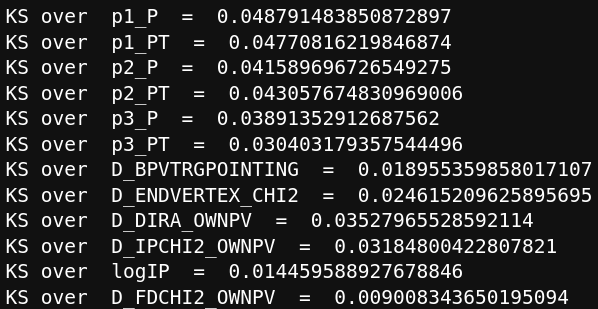
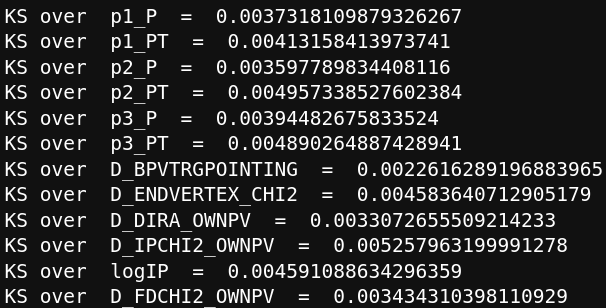
Kolmogorov-Smirnov before reweighting
Kolmogorov-Smirnov after reweighting
Gradient boosted weights
- Monte Carlo and data distributions after the reweighting

2016-Down (Fold 1)
Data analysis: MC-matching
Input data for MVA
2016-Down (Fold 1)
Data analysis: MVA
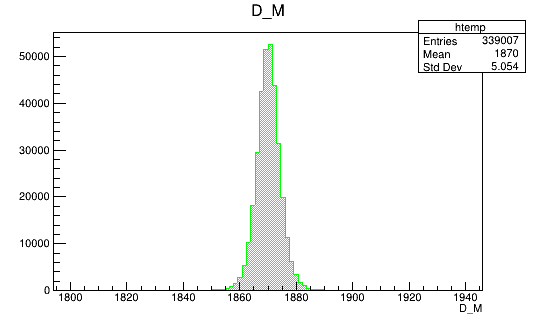
Reweighted Monte Carlo is used as signal
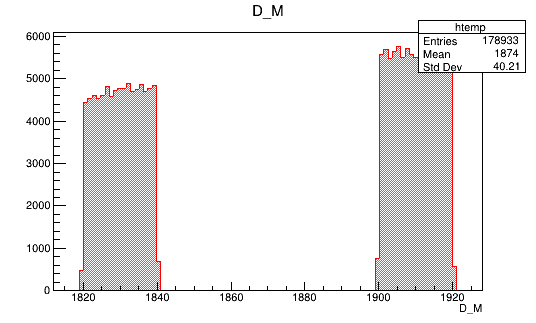
Data sidebands are used as background
(MeV)
(MeV)
MVA training results
Discriminant variables
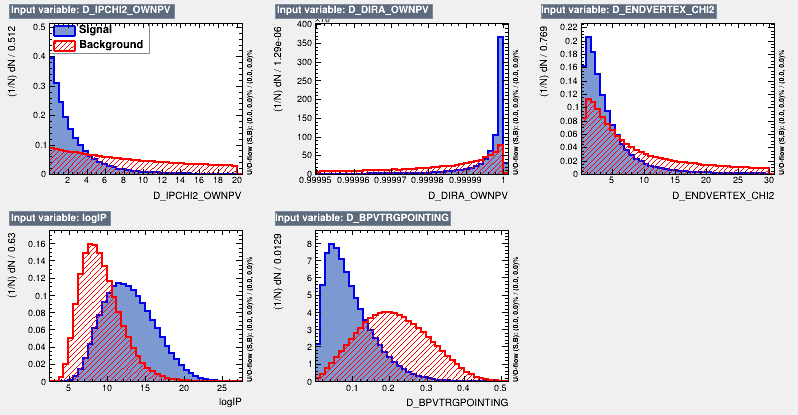
Data analysis: MVA
MVA training results
Correlation matrices
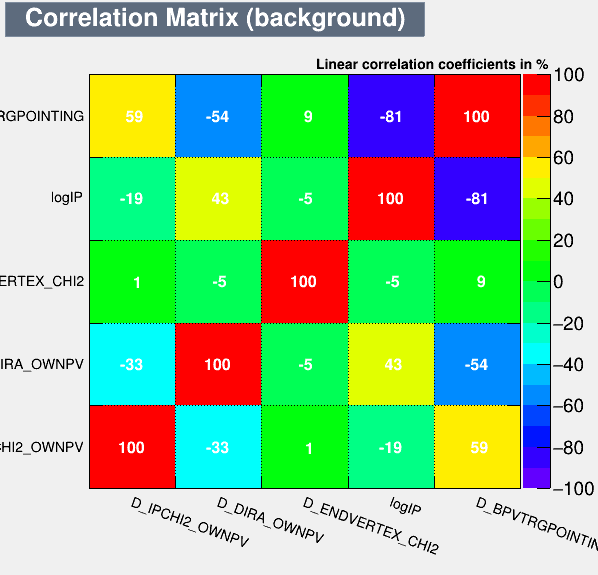
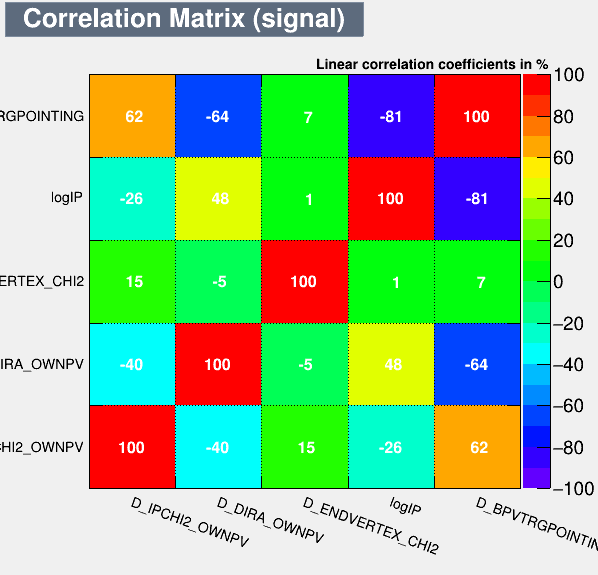
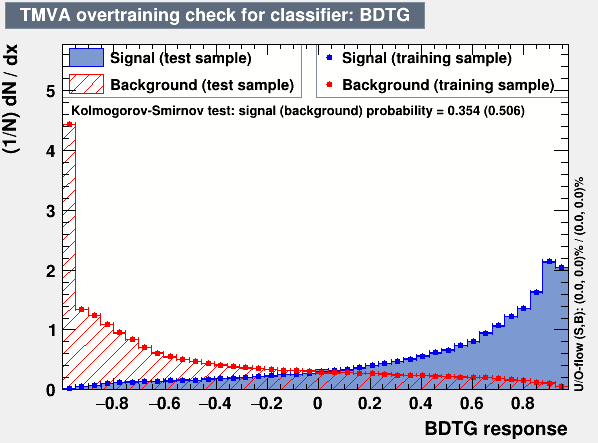
Data analysis: MVA
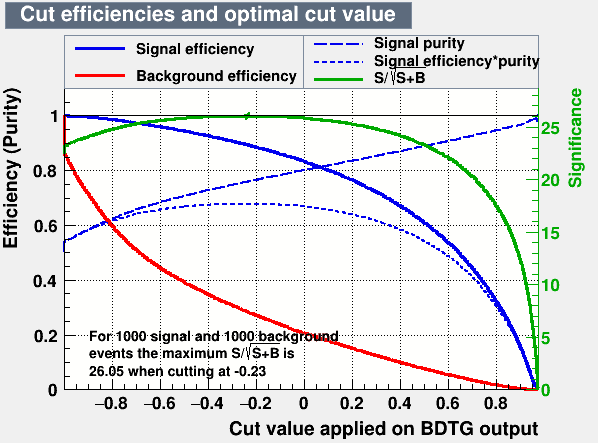
MVA training results
Overtraining check
Figures of merit
Data analysis: MVA
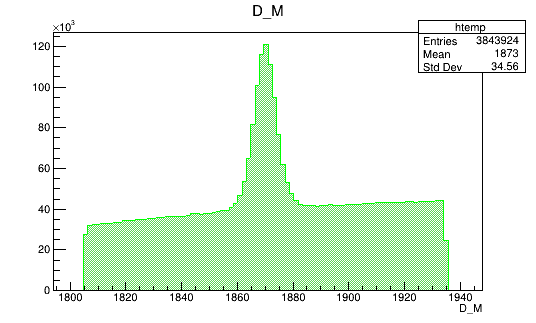
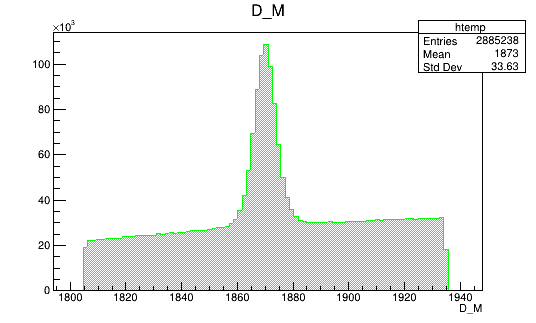
MVA application results
Data (Fold 2)
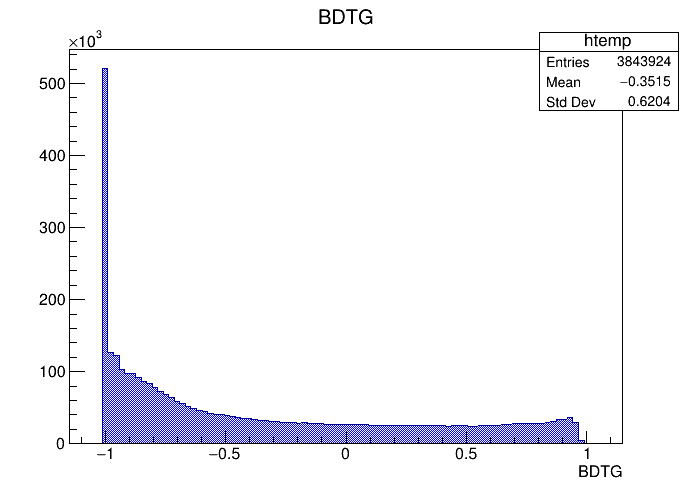
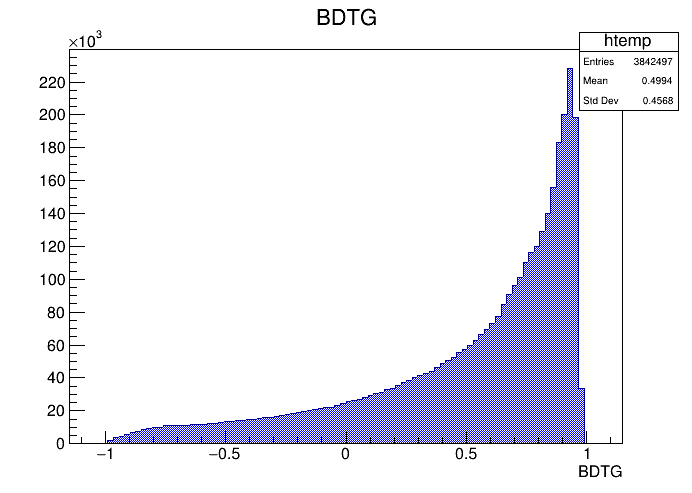
Monte Carlo (Fold 2)
Data analysis: MVA
Optimal cut value
Data (Fold 2)
Monte Carlo (Fold 2)

BDTG_val > -1.0
Data analysis: Figures of merit
(MeV)
(MeV)
Optimal cut value
Data (Fold 2)
Monte Carlo (Fold 2)

BDTG_val > -0.9
Data analysis: Figures of merit
(MeV)
(MeV)
Optimal cut value
Data (Fold 2)
Monte Carlo (Fold 2)


BDTG_val > -0.7
Data analysis: Figures of merit
(MeV)
(MeV)
Optimal cut value
Data (Fold 2)
Monte Carlo (Fold 2)

BDTG_val > -0.5
Data analysis: Figures of merit
(MeV)
(MeV)
Optimal cut value
Data (Fold 2)
Monte Carlo (Fold 2)
BDTG_val > -0.3
Data analysis: Figures of merit
(MeV)
(MeV)
Optimal cut value
Data (Fold 2)
Monte Carlo (Fold 2)

BDTG_val > -0.1
Data analysis: Figures of merit
(MeV)
(MeV)
Optimal cut value
Data (Fold 2)
Monte Carlo (Fold 2)

BDTG_val > 0.1
Data analysis: Figures of merit
(MeV)
(MeV)
Optimal cut value
Data (Fold 2)
Monte Carlo (Fold 2)
BDTG_val > 0.3
Data analysis: Figures of merit
(MeV)
(MeV)
Optimal cut value
Data (Fold 2)
Monte Carlo (Fold 2)

BDTG_val > 0.5
Data analysis: Figures of merit
(MeV)
(MeV)
Optimal cut value
Data (Fold 2)
Monte Carlo (Fold 2)
BDTG_val > 0.7
Data analysis: Figures of merit
(MeV)
(MeV)
Optimal cut value
Data (Fold 2)
Monte Carlo (Fold 2)

BDTG_val > 0.9
Data analysis: Figures of merit
(MeV)
(MeV)
Fits after BDTG cut
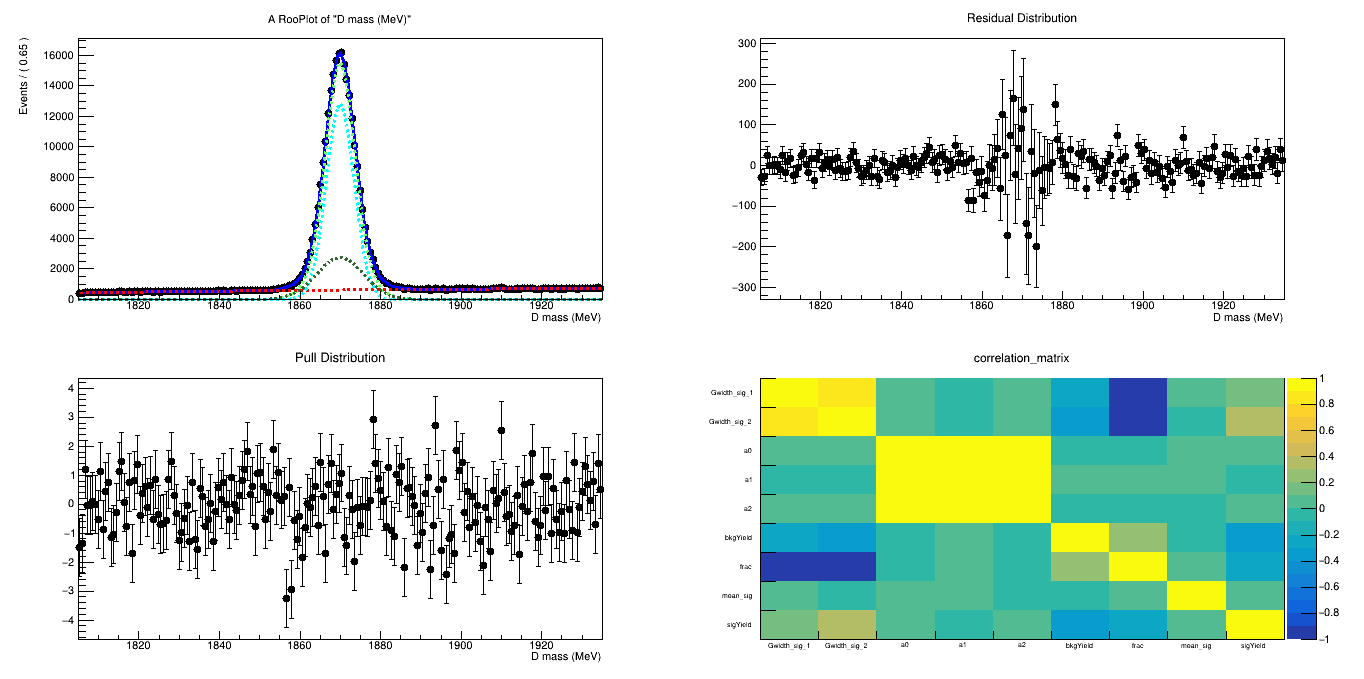
BDTG_val > 0.9
BDTG_val > 0.8
Data analysis: Figures of merit
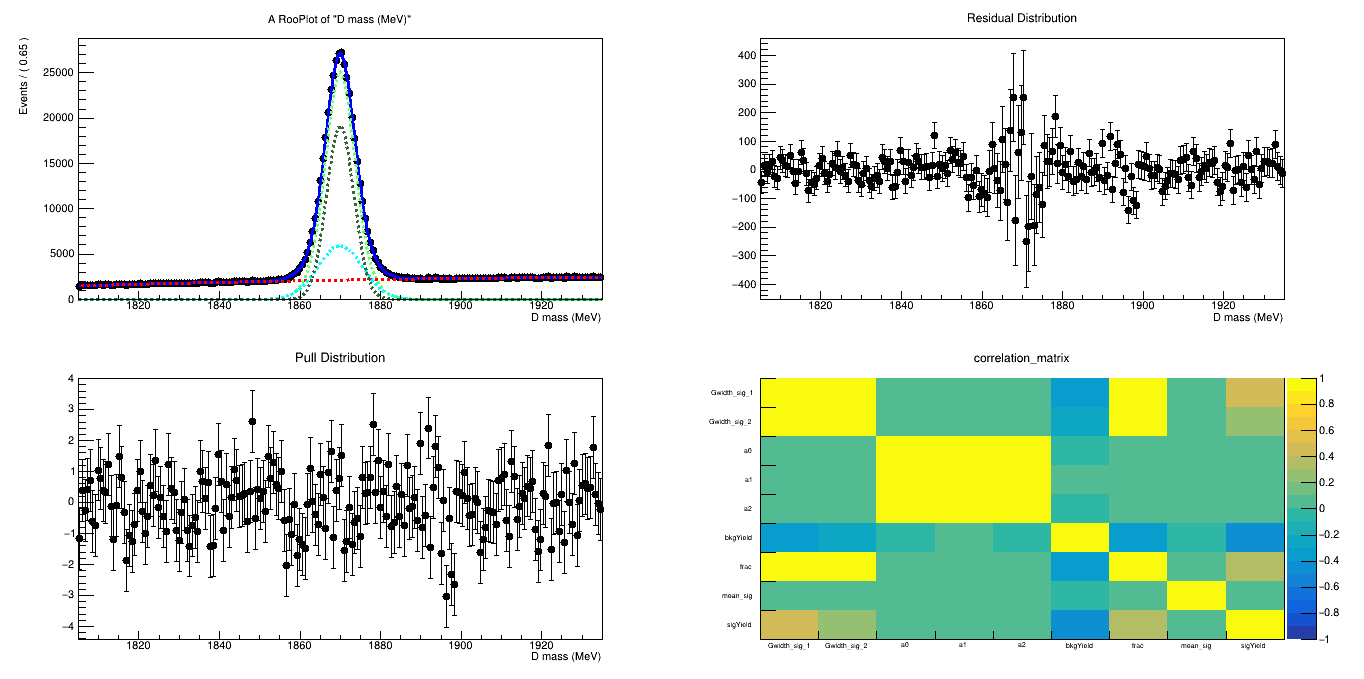
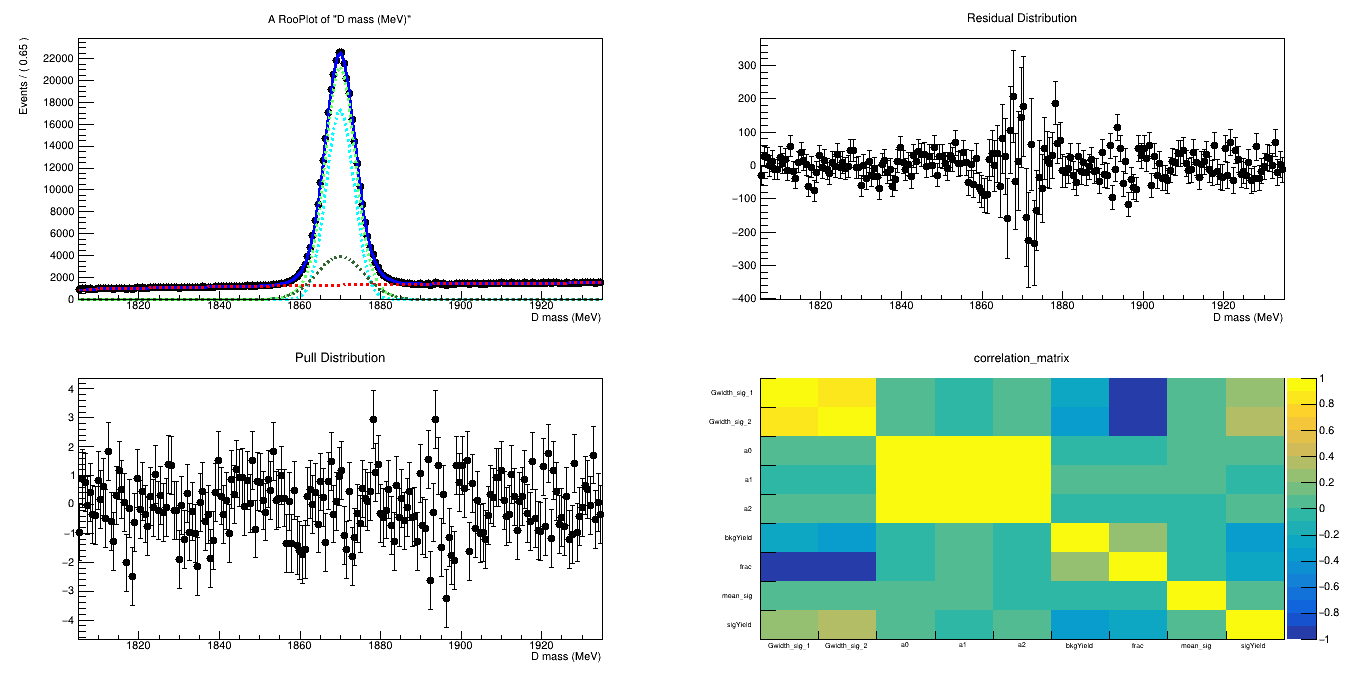
BDTG_val > 0.7
BDTG_val > 0.6
Data analysis: Figures of merit
Fits after BDTG cut
Monte Carlo efficiency
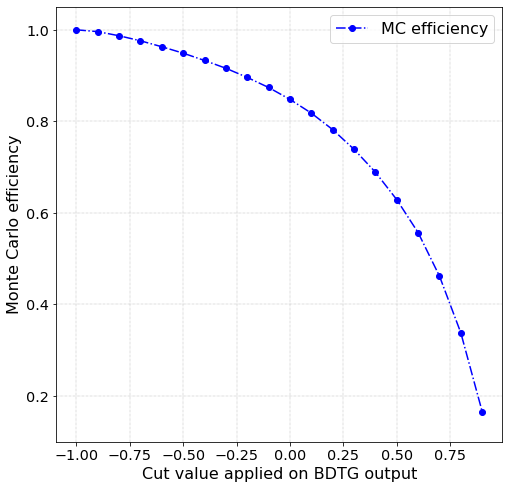
Data analysis: Figures of merit
Signal efficiency and purity
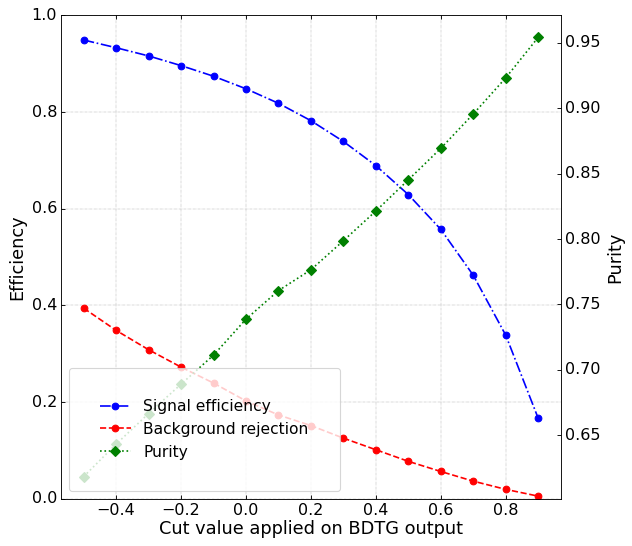
Data analysis: Figures of merit
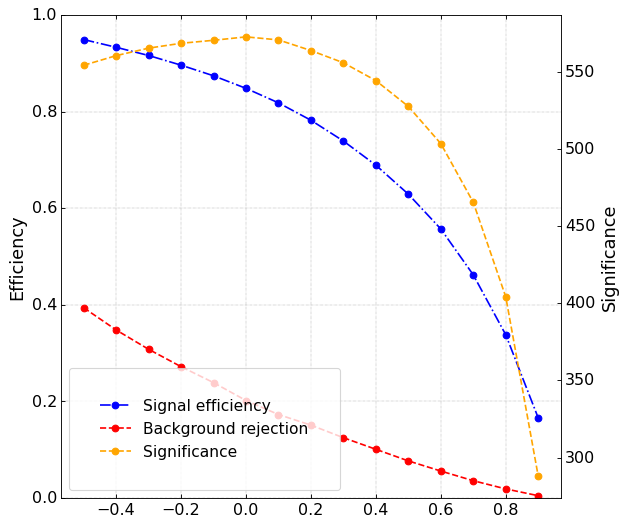
Significance
Data analysis: Figures of merit
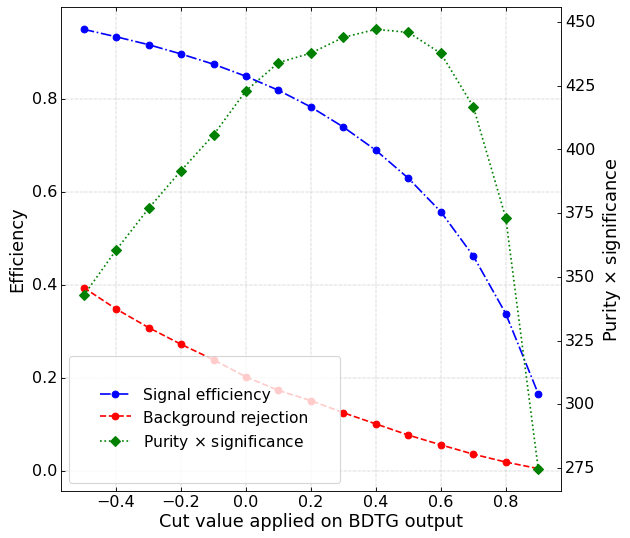
Purity x Significance
Data analysis: Figures of merit
Significance as figure of merit
Optimal cut: BDTG_val = 0.0
Data analysis: Final distributions
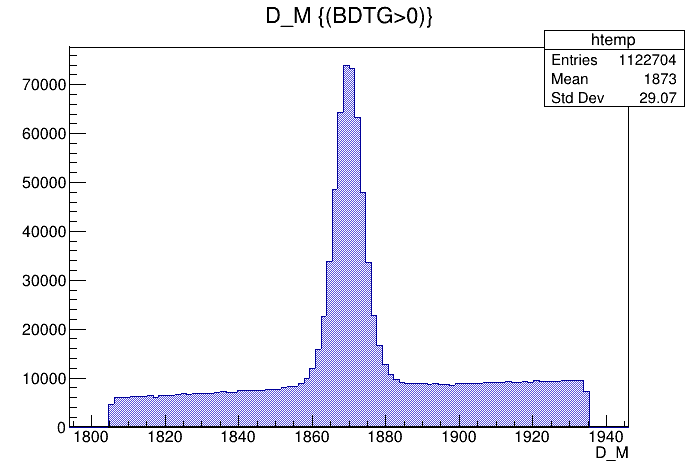
(MeV)
Mass distribution of the \(D\) selected candidates
Optimal cut: BDTG_val = 0.0
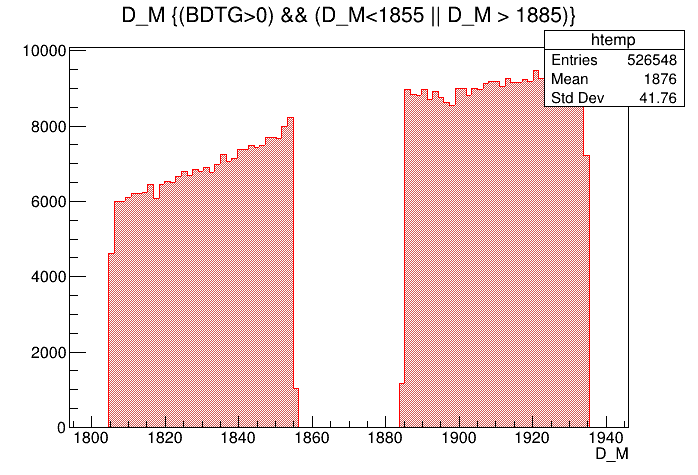
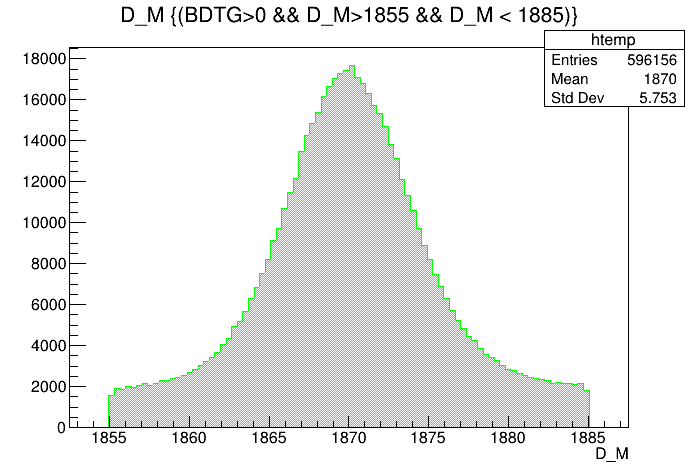
(MeV)
(MeV)
Data analysis: Final distributions
Mass distribution of the \(D\) selected candidates (Signal region)
Mass distribution of the \(D\) selected candidates (Background region)
Significance as figure of merit
Significance as figure of merit
Optimal cut: BDTG_val = 0.0
(GeV)
(GeV)
(GeV)
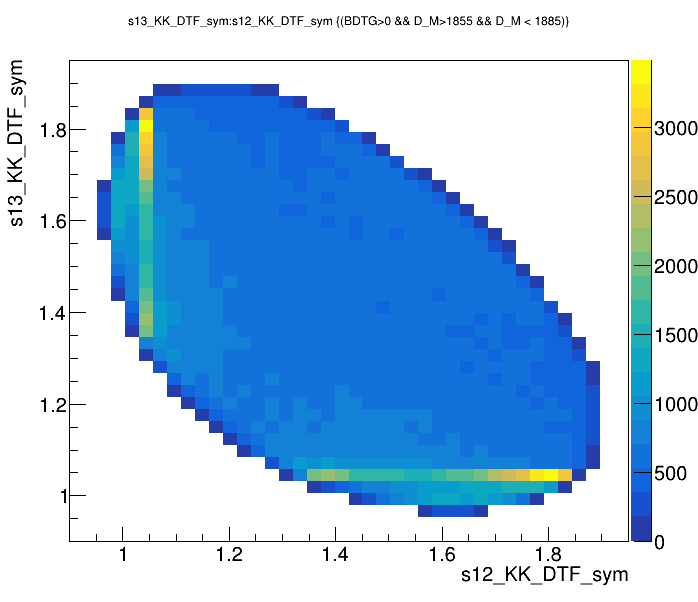
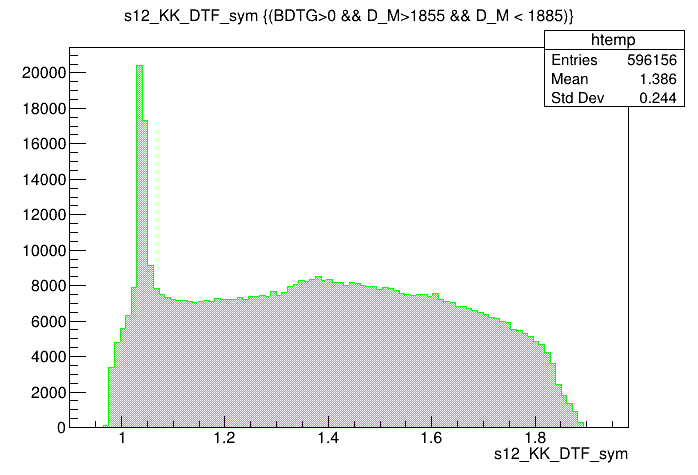
Data analysis: Final distributions
Dalitz plot of the \(D\) selected candidates in the signal region
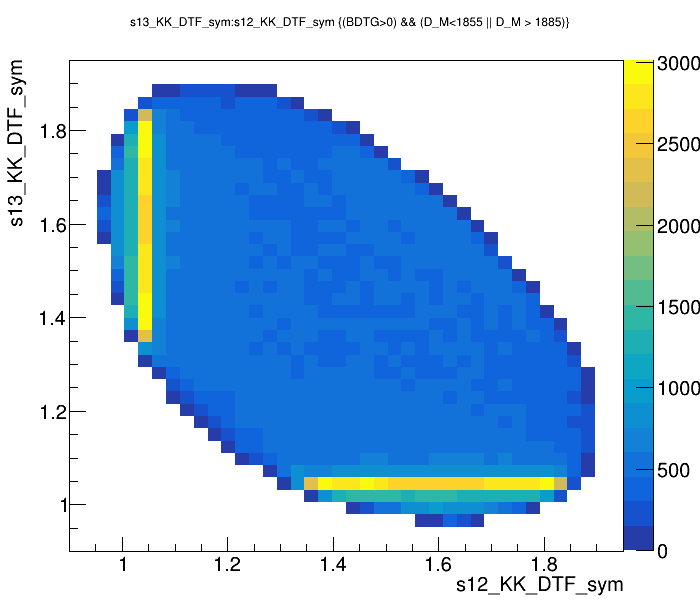
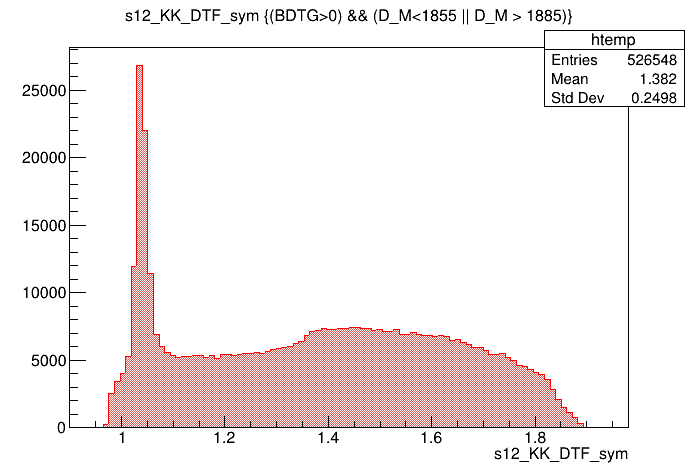
Optimal cut: BDTG_val = 0.0
(GeV)
(GeV)
(GeV)
Data analysis: Final distributions
Dalitz plot of the \(D\) selected candidates in the sidebands